Your Aerobic Capacity Falls Twice As Fast As The Textbooks Say

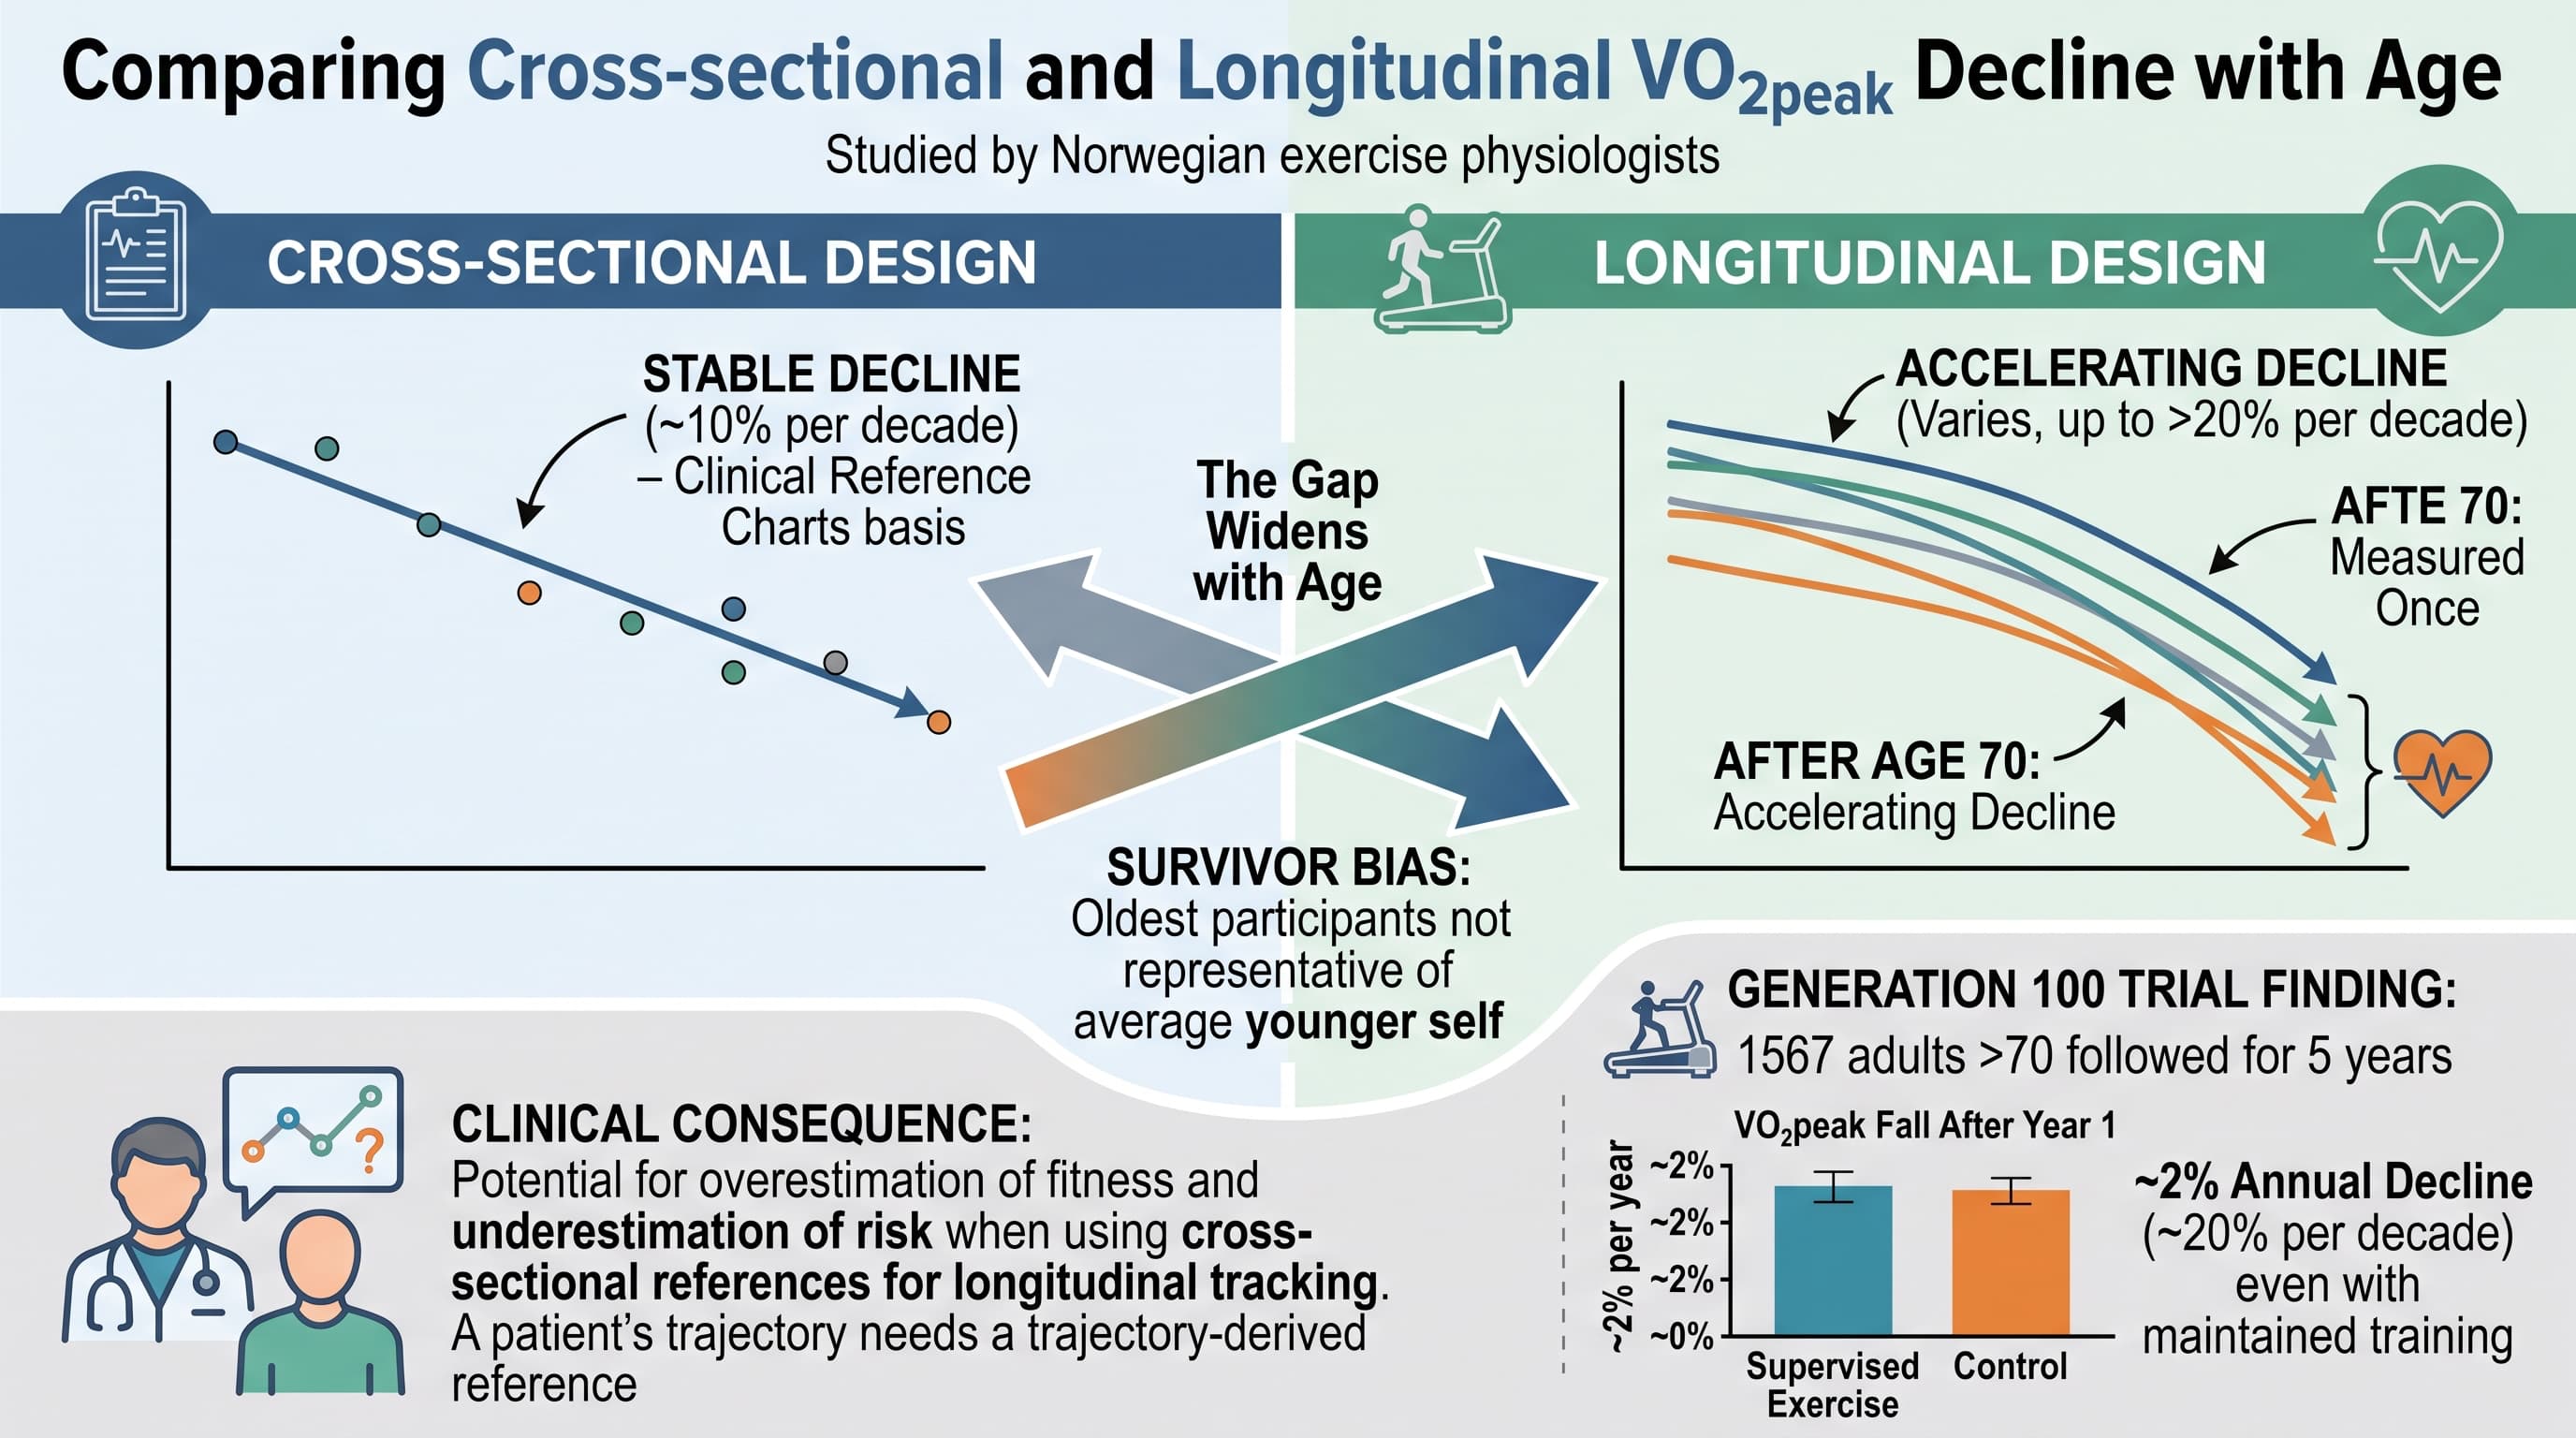
Three Norwegian exercise physiologists compared how fast VO2peak declines with age when measured two different ways: by testing many people of different ages once (cross-sectional), versus testing the same people repeatedly over years (longitudinal). The cross-sectional literature, which is what almost every clinical reference chart is built from, produces the familiar figure of roughly 10 percent lost per decade, holding steady across the lifespan. The longitudinal literature says something different and worse. Decline is not linear. It accelerates. After age 70 it reaches 15 to 20 percent per decade in women and 20 to 25 percent per decade in men. The gap between the two designs is largest exactly where it matters most clinically, in the oldest patients, and the likely cause is survivor bias: the 80-year-olds who show up for a maximal treadmill test were never average 40-year-olds.

There is a number that shows up in nearly every discussion of aerobic fitness and aging: 10 percent per decade. It is tidy, it is memorable, and according to this review it is wrong in the age range where it gets used most.

The problem is architectural. To build a fitness reference chart you need thousands of people, so researchers recruit a wide age range, test everyone once, and draw a line through the results. That line is a snapshot of different people, not a trajectory of one person. It compares today’s 30-year-olds to today’s 80-year-olds, and the 80-year-olds in that room are a survivor population. Low fitness predicts death and disease with unusual reliability, so the people who were unfit at 50 are disproportionately absent from the 80-year-old group. What looks like a gentle slope is partly a filter.

Follow the same individuals instead and the slope steepens. Two large longitudinal cohorts, the Baltimore Longitudinal Study of Aging in the United States and the HUNT Study in Norway, tracked participants across a wide age range and reported results by decade. Both found acceleration. Both found the acceleration is worse in men. In men past 70, aerobic capacity falls by roughly a quarter every ten years.

The designs disagree in a specific, age-dependent pattern. In young adults, cross-sectional estimates run slightly high. Through middle age the two converge. After about 60 the longitudinal estimates pull decisively ahead. One repeated-measures study of older adults put the annual loss at 0.69 mL/kg/min per year in men when tracked over time, against 0.34 when estimated across ages, a factor of two.

The clinical consequence is direct. A physician following a patient’s fitness over a decade, and comparing it against a cross-sectional chart, will see a normal-looking decline and reassure. The patient may in fact be losing capacity at the expected longitudinal rate, which is far larger, or at an abnormal rate hidden inside a too-generous expectation. Trajectory needs a trajectory-derived reference.

The review also leaves a hard finding sitting in plain sight. In the Generation 100 trial, 1567 adults over 70 were followed for five years, and VO2peak fell about 2 percent per year after the first year in the supervised exercise groups and the control group alike, despite training volume being maintained. Twenty percent per decade, with the exercise already priced in.

Actionable Insights

Four things follow from this paper.

First, your own previous test result is a better benchmark than any age-matched chart, particularly after 60. Charts built from one-time testing of many people understate how fast a real person declines.

Second, expect acceleration. Planning around a steady 10 percent per decade will overestimate where you land at 80. A man testing with a VO2Max at 31 mL/kg/min at age 70 would project to about 25 by age 90 under the 10 percent rule, but to roughly 17 under the observed 25 percent rule. That difference of about 8 mL/kg/min is more than 2 METs, and 18 mL/kg/min is near the level where daily independent living becomes effortful.

Third, the size of a fitness difference is worth knowing in risk terms. One MET, which is 3.5 mL/kg/min, is associated with roughly 13 percent lower all-cause mortality and 15 percent lower cardiovascular event risk in meta-analysis. The measurement-design gap alone, about 3.5 mL/kg/min per decade in older men, is one whole MET.

Fourth, and least comfortable: in the one large randomized trial cited, five years of supervised training in over-70s produced a VO2peak advantage over controls of 0.76 mL/kg/min. That is a small effect, worth about a year of delay in decline. Peak aerobic reserve built before 60 appears to matter more than training started after 70. Build the VO2Max ceiling early.

Context and Source

  • Open Access Paper: Age-related decline in peak oxygen uptake: Cross-sectional vs. longitudinal findings. A review., 2023 Jan 13.
  • Institution: Department of Circulation and Medical Imaging, Norwegian University of Science and Technology (NTNU), Trondheim, with St. Olavs University Hospital, Norway, and the University of Queensland, Australia.
  • Country: Norway (with Australian affiliation).
  • Journal: International Journal of Cardiology Cardiovascular Risk and Prevention.
  • Journal impact evaluation: This journal is a companion title to International Journal of Cardiology and does not carry a confirmed Clarivate Journal Impact Factor in the JCR core collection.

Related Reading:

5 Likes

Biomarker Data (Effect Size Extraction)

Reported decline rates

The primary outcome throughout is one biomarker: VO2peak, the maximum oxygen a person can consume during exercise to exhaustion. It is measured by gas analysis, which is the gold standard rather than an estimate from a watch or a step test. It is also one of the strongest single predictors of death in medicine, which is why the size of its decline matters.

Median and maximum values, mapped onto what this paper actually reports

Since there is no lifespan outcome, the closest honest translation of “median and maximum improvement” is the typical versus the worst-case rate of decline reported across the literature reviewed.

Median or typical decline, from cross-sectional studies (the one-time testing designs that clinical reference charts are built from):

  • 0.40 mL/kg/min lost per year in men, from meta-analysis, the same in active and sedentary men.
  • 0.44 in physically active women and 0.35 in sedentary women, from meta-analysis.
  • Published prediction equations across many countries cluster between 0.30 and 0.50 per year.
  • Expressed as a percentage: about 10 percent per decade, assumed constant across the lifespan.

Maximum or worst-case decline, from longitudinal studies (the same individuals retested years later):

  • Men over 70: 20 to 25 percent per decade, found independently in both large cohorts, the Baltimore Longitudinal Study of Aging in the United States and the HUNT Study in Norway.
  • Women over 70: 15 to 20 percent per decade.
  • Fastest single reported annual rate: 0.69 mL/kg/min per year in older men (Hollenberg, 592 adults with a mean age of 65, repeated testing over 6.3 years).

The spread between the typical figure and the worst-case figure is the entire point of the paper. In percentage terms it is 10 versus 25 per decade, a factor of 2.5. [Confidence: High on the direction and that the gap is real; Medium on the exact endpoints, since both come from two cohorts with 8 to 10 year observation windows extrapolated out to a decade]

Effect size 1: the exposure itself, fitness versus death risk

This is the anchor that makes every other number below interpretable. It comes from an external source, the Kodama 2009 meta-analysis in JAMA, not from this review.

  • Per 1 MET higher fitness (3.5 mL/kg/min): relative risk of death from any cause 0.87, meaning 13 percent lower risk.
  • Per 1 MET higher fitness: relative risk of coronary or cardiovascular events 0.85, meaning 15 percent lower risk.
  • Per 2 METs (7 mL/kg/min): 0.87 squared equals 0.76, meaning 24 percent lower risk of death.

Plain reading: a difference of about 3.5 mL/kg/min between two otherwise similar people is associated with roughly one in eight fewer deaths over follow-up. Note this is a comparison between different people, not proof that raising your own number by 1 MET delivers the same benefit. [Confidence: High on the association, Medium on applying it to within-person change]

Effect size 2: how much the two study designs disagree

From Hollenberg, the one study in the review reporting both estimates in the same people. Annual decline, longitudinal versus cross-sectional:

Men, 0.69 versus 0.34 mL/kg/min per year.

  • Ratio: 2.03, so the longitudinal decline is twice the cross-sectional one.
  • Absolute gap over ten years: 3.5 mL/kg/min, which is exactly 1.0 MET.
  • As a percentage of a typical 70-year-old man’s 31 mL/kg/min: 11 percent of his total capacity, per decade, unaccounted for.
  • Cohen’s d, using an assumed male standard deviation of 6 mL/kg/min: 3.5 divided by 6 equals 0.58, a moderate effect.
  • Translated through Kodama: 1 MET equals a risk ratio of 0.87, so the reference-chart error hides about 13 percent of mortality-relevant change per decade.

Women, 0.39 versus 0.23 mL/kg/min per year.

  • Ratio: 1.70.
  • Absolute gap over ten years: 1.6 mL/kg/min, which is 0.46 MET.
  • As a percentage of a typical 70-year-old woman’s 26 mL/kg/min: 6 percent per decade.
  • Cohen’s d, using an assumed female standard deviation of 5 mL/kg/min: 1.6 divided by 5 equals 0.32, small to moderate.
  • Translated through Kodama: about 6 percent of mortality-relevant change hidden per decade.

Plain reading: judging an older man’s ten-year fitness trajectory against a standard age chart quietly forgives him a full MET of loss. [Confidence: High on the arithmetic, Medium on the mortality translation]

Effect size 3: how big one decade of aging actually is

Using the review’s own longitudinal figures and typical starting values.

Man aged 70, starting at 31 mL/kg/min, declining 25 percent per decade:

  • Absolute loss: 7.75 mL/kg/min in ten years.
  • In METs: 2.21 METs.
  • Cohen’s d, assumed SD 6: 1.29. Large. This is the size of change that moves a man out of his fitness percentile band entirely.
  • Risk translation: losing 2.21 METs corresponds to a risk multiplier of about 1.36, so roughly 36 percent higher all-cause mortality risk than his 70-year-old self, from the fitness change alone.

Woman aged 70, starting at 26 mL/kg/min, declining 17.5 percent per decade:

  • Absolute loss: 4.55 mL/kg/min in ten years.
  • In METs: 1.30 METs.
  • Cohen’s d, assumed SD 5: 0.91. Large.
  • Risk translation: risk multiplier about 1.20, so roughly 20 percent higher mortality risk.

Compare against what the conventional 10 percent per decade rule predicts for the same man: 3.1 mL/kg/min lost, 0.89 MET, Cohen’s d of 0.52, moderate rather than large. The heuristic and the observation differ by three quarters of a population standard deviation per decade. [Confidence: Low to Medium, because both standard deviations are imported from external reference data rather than reported in this paper. The direction is robust, the decimal places are not.]

Effect size 4: the actual treatment effect, with both arms reported

This is the only randomized treatment-versus-control comparison anywhere in the review’s evidence base: the Generation 100 trial, 1567 Norwegian adults over 70, five years.

Groups and baselines:

  • Control, n = 780, advised to follow national physical activity guidelines. Baseline VO2peak 31 mL/kg/min in men, 26 in women.
  • Moderate continuous training, n = 387. Baseline 32 in men, 26 in women.
  • High intensity interval training, n = 400. Baseline 31 in men, 26 in women.

Outcome after five years:

  • HIIT versus control: 0.76 mL/kg/min higher (99 percent confidence interval 0.02 to 1.51).
  • Both exercise arms combined versus control: 0.39 mL/kg/min higher (99 percent CI minus 0.22 to 1.00), which includes zero and is therefore not distinguishable from no effect.
  • Moderate continuous training versus control: no significant difference.
  • All groups, control included, lost about 2 percent per year after the first year, equivalent to 20 percent per decade, despite exercise volume being maintained.

Effect size of the best-performing arm, HIIT versus control:

  • Absolute: 0.76 mL/kg/min.
  • Percentage: 2.5 percent of the 31 mL/kg/min starting value.
  • In METs: 0.22 MET.
  • Cohen’s d, assumed SD 6: 0.76 divided by 6 equals 0.13. Small, well below the 0.2 threshold at which an effect is normally considered even modest.
  • Risk translation through Kodama: about 3 percent lower all-cause mortality risk. The confidence interval spans 0.1 percent to 5.8 percent, so the honest range runs from almost nothing to modest.
  • Time translation: at a decline of roughly 0.62 mL/kg/min per year in this age group, an advantage of 0.76 buys about 1.2 years of delay, bought with five years of supervised training.

Plain reading: five years of supervised high intensity training in adults over 70 produced a benefit around one tenth the size of a decade of aging in the same population. The lower bound of the confidence interval is 0.02, effectively zero, so even that small benefit is not securely established. This is the single most consequential number in the review for anyone building a protocol, and the review mentions it in one sentence. [Confidence: High that the effect is small; Medium on interpretation, because the control group was actively counselled on activity guidelines and many controls trained hard, compressing the contrast between arms]

Summary table of effect sizes

What is being measured Absolute size Percentage Standardized effect
One decade of aging, man over 70 7.75 mL/kg/min (2.21 METs) 25 percent of baseline Cohen’s d 1.29; risk multiplier 1.36
One decade of aging, woman over 70 4.55 mL/kg/min (1.30 METs) 17.5 percent of baseline Cohen’s d 0.91; risk multiplier 1.20
Same decade under the 10 percent rule, man 3.10 mL/kg/min (0.89 MET) 10 percent of baseline Cohen’s d 0.52; risk multiplier 1.13
Cross-sectional versus longitudinal gap, men 3.5 mL/kg/min per decade (1.0 MET) 11 percent of baseline Cohen’s d 0.58; 13 percent of risk hidden
Cross-sectional versus longitudinal gap, women 1.6 mL/kg/min per decade (0.46 MET) 6 percent of baseline Cohen’s d 0.32; 6 percent of risk hidden
Five years of supervised HIIT versus control, over-70s 0.76 mL/kg/min (0.22 MET) 2.5 percent of baseline Cohen’s d 0.13; risk multiplier 0.97

Reading the table in one line: aging is a large effect, the measurement error in how we track it is a moderate effect, and the best available exercise intervention in the elderly is a small effect. All Cohen’s d values assume external standard deviations of 6 mL/kg/min in men and 5 in women, because this paper reports none. All risk multipliers apply an external per-MET mortality estimate.

Secular trend, for context

Pooled data across eight high and upper-middle income countries showed cardiorespiratory fitness declining about 1.6 percent per decade at population level between the 1960s and 2016. That is roughly one sixth the size of the individual aging effect, and it pushes in the same direction for cross-sectional comparisons, since people born earlier were fitter at any given age than people born later. It contributes to the design discrepancy without explaining it.

The phenotype in physiological terms

VO2peak is the product of cardiac output (heart rate times stroke volume) and arteriovenous oxygen difference (peripheral extraction). Any accelerating decline must be driven by acceleration in one of those terms.

Maximum heart rate declines close to linearly, roughly 0.7 beats per year. That is a linear input and cannot by itself produce a non-linear output. Stroke volume at peak effort is relatively preserved into old age in the healthy. This points to the periphery, specifically the arteriovenous oxygen difference, as the accelerating term: skeletal muscle mass, capillary density, and mitochondrial oxidative capacity. [Confidence: Medium]

Organ-specific aging priorities implied

Priority one is skeletal muscle, not the heart. Sarcopenic loss accelerates after 70, and VO2peak expressed per kilogram of body mass falls both because the numerator falls (less oxidative muscle) and because the denominator holds or rises (fat mass replacing lean mass). The review does not decompose this, which is a real weakness, but it is the most parsimonious explanation for the sex difference the authors report. Men lose more absolute lean mass and their peak capacity was higher, so they have more to lose and lose it faster.

Priority two is mitochondrial quality control in muscle. Priority three is the vasculature, specifically arterial stiffening and reduced exercise hyperemia limiting oxygen delivery. Priority four is central cardiac function, which appears to be the least of the four in healthy aging.

3 Likes

I don’t know how to reconciile my own situation with the bleak picture given by the study showing that even HIIT only compensates for a tenth of the worsening of VO2max for the 70+. I am at 79 improving my VO2 max a little every 18 months that I test. Last time it increased by 3% to 35.8 ml/kg/minute.

What am I doing differently? I do all-out 2 x 20 second sprint intervals, all-out barbell, dumbell, bodyweight, cable resistance exercises to the very last possible repetition, total 80 minutes. I pant like a madman surrounded by silent mainly men at the gym. Is it simply because the people in the study didn’t exert themselves that much?

Or could my supplements be contrbuting? Before my last VO2 I gambled on ultra high-dose proline.

6 Likes

What is ultra high prolinr

Ulf - I appreciate you sharing this more optimistic story of your own results. Have you always been an athlete? What is your history in sports? Do you cross-country ski in the winter? Have you ever done competitive sports? What about your family members… did your parents stay healthy and active throughout their lives too?

We do have, it seems, many counter examples to the paper posted in at the start of this thread. So yes - we need to be careful not to take this as Gospel.

I remember this thread:

Crucially, the cross-sectional rate of VO2max decline among these extreme runners was significantly more gradual than that seen in the general public. While standard population trajectories show steep, predictable drops, linear regression modeling demonstrated that multi-marathoner men experienced a cross-sectional decline slope of just -0.23 mL/kg/min per year, while multi-marathoner women exhibited an even shallower decline of -0.15 mL/kg/min per year. Older female multi-marathoners demonstrated a particularly pronounced relative advantage compared to their normative counterparts.

From: Running Against Time: Can Completing 100+ Marathons Decouple Cardiovascular Fitness from Chronological Aging?

and also this example: Never Too Late To Start Exercising - The Amazing Results of one 93 year old

and: I'm 54 But My VO2 Max is Over 70. Here's How I Did It - Dr Elie Abirached (Siim Land)

Here is a summary of the paper in the last thread I mentioned, on the 93 year old:

The Late Starter: A 92-Year-Old Champion Rower Shows What Two Decades of Training Can Buy, and What It Cannot

Irish and Dutch researchers performed a full laboratory workup on Richard Morgan, a 92-year-old four-time world champion indoor rower who did not begin structured exercise until age 73. Across a resting metabolic assessment and a 2,000 m rowing time trial, he showed muscle oxygen-uptake kinetics identical to healthy 25-year-olds (time constant 30.2 s), fat-free mass in the top 5 percent of men aged 70 to 79, body fat of 15.4 percent, lung volumes 19 to 21 percent above age-predicted, and a peak power output of 220 W. His training was roughly 40 minutes per day on the rowing ergometer at mostly easy intensity, plus two to three resistance sessions weekly, supported by a protein intake of 2.3 g per kg of lean body mass. The findings are real but narrow: his maximal aerobic ceiling was only 11 percent above sedentary men his age and 48 percent below lifelong-trained octogenarians, and his airway flow was 35 percent below predicted. This is a single, uncontrolled, cross-sectional case description with no baseline data from age 73.

Richard Morgan did not touch an oar until he was 73. Nineteen years later, at 92, he holds four world titles in indoor rowing and has become one of the oldest people ever to have his physiology mapped in this kind of detail. A team from the Technological University of the Shannon and the University of Limerick put him through a full laboratory workup, and the results are more interesting for what they qualify than for what they confirm.

The headline number is how fast his body switches on. When he starts rowing, the time his muscles take to reach a steady rate of oxygen use is 30.2 seconds. That is the same figure reported for healthy 25-year-olds and for master endurance athletes in their sixties, seventies and eighties. It is a measure that depends heavily on how well muscle mitochondria and their blood supply work, and by that yardstick his muscles behave like those of a man decades younger.

His body composition is equally striking. At 59.2 kg he carries 15.4 percent body fat and 50.2 kg of fat-free tissue, placing him in the top 5 percent of men aged 70 to 79, a reference group already 15 years his junior. His lung volumes are 19 to 21 percent above what is predicted for his age, and his heart reached 153 beats per minute, about 10 beats above the standard age-based prediction.

Then come the qualifiers. His peak oxygen uptake, 23.2 millilitres per kilogram per minute, is only about 11 percent above that of sedentary men in their eighties, and roughly 48 percent below octogenarians who have trained all their lives. His mechanical efficiency, 15.5 percent, sits well under the 18.7 percent recorded for a former Olympic champion rower. His peak expiratory flow is 65 percent of predicted, a reminder that airway mechanics do not respond to training the way muscle does. And his own race times tell a blunt story: nearly identical through his eighties, then 14 percent slower once he passed 89.

The big idea here is narrower than the coverage suggested when this study circulated in early 2024. It is not that starting to train at 73 makes you 25 again. It is that specific systems, muscle mass and the speed of oxidative metabolism above all, appear to stay unusually responsive to a training stimulus deep into the tenth decade, while others, particularly the maximal aerobic ceiling and airway function, largely do not. This is one man, measured once, with no baseline from age 73, so the causal question of what the training actually did remains open. [Confidence: High that the measurements are accurate; Low that they generalise to the population.]

Actionable Insights

Four things in this case are worth acting on, and it is worth being clear how large each effect is.

Starting late still buys something. He began at 73 and reached a peak oxygen uptake about 11 percent higher than sedentary men his age. In plain terms that is roughly 2.3 millilitres per kilogram per minute, or about two-thirds of one MET of extra capacity. That is a small gain in absolute terms, but it sits in the range that separates independent living from assisted living in the very old.

Muscle is the domain that responds. His fat-free mass places him in the top 5 percent of men 15 years younger. The plausible drivers are the parts of his regime that were deliberate: resistance work two to three times weekly taken to failure, and protein intake of 1.9 g per kg body mass, roughly 58 percent above the usual minimum recommendation for older adults and about 2.4 times the standard adult RDA.

Volume beat intensity. Seventy percent of his rowing distance was easy. Total training was about 40 minutes per day, costing roughly 190 kcal daily. This is an achievable dose, not an elite one.

What training did not fix. His airway flow, his gross mechanical efficiency and his maximal aerobic ceiling were all substantially below younger or lifelong-trained comparators. Expect training to protect muscle and metabolic responsiveness far more than it protects peak capacity. [Confidence: Medium]

Context and Source

  • Full title: Physiological characteristics of a 92-yr-old four-time world champion indoor rower
  • Institutions: Technological University of the Shannon, Midlands Midwest, Athlone, Ireland (lead); University of Limerick, Ireland; Maastricht University Medical Centre+, Maastricht, The Netherlands
  • Country: Ireland (primary), with Dutch collaboration
  • Journal: Journal of Applied Physiology (American Physiological Society), volume 135
    Impact evaluation. The impact score of this journal is 3.3 (Journal Impact Factor; CiteScore 5.9, SJR 1.106, H-index 251 to 276), evaluated against a typical high-end range of 0 to 60+ for top general science, therefore this is a Low-to-Medium impact journal on the general science scale.
2 Likes

I am fortunate in this regard. My father was an elite marathon runner in his middle age years and completed 18 marathons with good results. I completed one marathon at age 26 while doing my anesthesiology residency with a time of 2:52 minutes. I’ve done cardio exercise all my adult life. I did a formal VO2 max last year at age 68 and a result of 46, which put me just barely in the “elite” age adjusted range. I do cardio on a Peloton bike and had an FTP of 205 two months ago. There are no guarantees, but theoretically I can glide down into the 90s with adequate cardio reserves.

2 Likes

This stood out to me the most and it’s something everyone here can understand:

Peak aerobic reserve built before 60 appears to matter more than training started after 70. Build the VO2Max ceiling early.

I am decently fit with a current VO2 max of about 53 (it would have been higher 5-10 years ago when I was training 5-10 hours per week for triathlons and endurance races), but this number still puts me at the 95 percentile for my age… according to WHOOP anyway, which I’ll admit needs to be interpreted with caution compared to actual lab testing.

My concern is this though - I am in my early 40’s and my body (joints, ligaments, tendons, etc) feel decent. In order for me to stay above average to avoid this “twice as fast decline,” I’ll need to engage in a decent amount of activity that could be hard on these parts of my physiology, even if they are greatly beneficial to the lungs, heart, and reducing all-cause mortality.

My point is that there is a likely a “sweet spot” and that one should be mindful about chasing VO2 max alone. If you max out VO2 max and wreck your joints in the process, you aren’t any better off.

This brings me to the question. Why is he still performing much better than average persons.

Aging changes the microcirculation in ways that can reduce the efficiency of oxygen, glucose, amino acids, hormones, and waste exchange between blood and tissues. Importantly, this is not simply a matter of having “less blood flow.” In many older people, the main problem is that blood flow becomes less precisely regulated and less efficiently distributed at the capillary level. And exercise is the nr 1 action to take when it comes to reducing the negative effects from hypoperfusion of organs.

Exactly. For that reason I bought a Peloton bike , and stopped running.

3 Likes

Me too: you only get so much knee. After running (make that “jogging”) for years, even with knees hurting, finally stopped and bought a Peloton bike. Trouble is, cycling does not provide the impact required to stave off bone loss, and I have major bone loss. So also have a linear vibrating platform and walk a lot (in addition to leg press, lunges, RDL’s, wall sits. )

2 Likes

Super! Weight training is critical for bone health. While jogging is better than cycling for bone density, weight training beats both.

2 Likes

I’m 67. VO2 Max is 58. I stopped running and speed skating after I tore my meningeal ligament. Now it’s cycling for zone 2, and rowing or sprinting upstairs for HIIT. Oddly, running up stairs is fine and down slowly is OK. Basically, just shift to low impact cardio. For cardio demand, rowing beats and other activities that involved the whole body (elliptical, cross country skiing) beats running anyway.

2 Likes

I wonder if the above could explain your good results, Ulf. This seems to suggest that holding on to lean mass, and not gaining fat, improves VO2peak. It sounds like you’re doing serious resistance training. Thus, likely you’re doing a good job (on an age-adjusted basis) of holding onto muscle & not gaining fat, which should – especially in conjunction with the HIIT – keep your VO2peak maintained, or even allow for increase if you hadn’t done a lot of this training when younger. If this is so, it would seem to suggest that a mix of HIIT and resistance training might be optimal for longevity in the long run (and that steady state cardio underperforms here, according to the original post which showed it seemed to have no effect in terms of maintaining VO2peak).

1 Like

I don’t believe this has been reported on RN, but Richard died at age 94 (Sept 2024)

I do find it a bit confusing how VO2 max is measured. If they are primarily using a treadmill at a slope, I think the “decline” in peak VO2 max is largely related to muscle and tendon/ligament decline. Using a treadmill undermines this physiological handicap. For myself, I see this sort of play out in a summer sprint triathlon I have done over the past 12 years. In my early 70’s, my running time has slowed, but my bike and swim have stayed steady or steadily improved. When training this summer, I found my running slowing primarily related to perceived muscle fatigue rather than aerobic decline. I did a short course training implementation of Muscular Endurance which helped my running a lot. My finish this summer placed me 52/122 total participants (m/f) and all event times improved or stayed steady. Finish place improved also compared to results the past 4 years.

When I jump on Concept 2 rowing machine without having rowed for a year, their VO2 Max calculator reflects a higher value than if comparing to my running V02 Max trial. My main point is that V02 Max decline seen with aging is as reflective of ligament/tendon/cartilage decline as it is of the main thing it is supposed to measure - aerobic decline. I would even add how your nervous system perceives the exertion is equally important.

I think this study could just say people as they age get fat, lose lean mass, don’t tolerate exertion as well and therefore their VO2 Max sucks. Or I should say some people - not all people. Nothing is inherent in losing VO2 Max at a certain pre-ordained rate.

2 Likes

That article on Richard the rower, and his grandson is a good one: A sports scientist switched from weightlifting to rowing as his main workout. He says it’s the perfect exercise to start later in life.

Daly, a lecturer in sports science at the Technological University of the Shannon, Ireland, analyzed his grandfather, Richard Morgan, for a study he published in the Journal of Applied Physiology in 2024, and found that his heart health, muscle mass, and overall fitness were comparable to that of healthy young adults around the age of 25.

Morgan died at age 94 in September 2024, but Daly continued to study the characteristics of other top athletes in their 50s, 60s, and 70s. He published his findings in the journal Medicine & Science in Sports & Exercise earlier this year.

He suggests that elite-level rowers can maintain exceptionally high levels of physical performance into older age by consistently training as they age, eating enough to maintain their weight, and consuming sufficient protein.

On measuring VO2Max, when I’ve gone to the physiology lab for my test they give me an option of what I’d prefer - treadmill or stationary bike. Sometimes they also offer the rowing machine I think. I guess the assumption is that one of these is your predominant mode of exercise (or close to it). But yes - I imagine it’s hard to distinguish between muscle or tendon degradation and cardio limitations… how do you identify the critical path that is limiting the output?

2 Likes