Prompt:
break down some of these findings by the 3 health groups in the study . For example, we can see that successful agers’ fat mass gain and fat % was lowest among the 3 groups and the more fat mass gained and %, the worse.
It would be nice to know on which medication subjects were.
Claude Opus 5.5 Response:
You’re right that fat gain tracked with worse outcomes, but the group ordering is different from what you described. Successful agers (SA) did not have the lowest fat gain. Optimal agers (OA) gained the least fat mass. OA and SA tied on body fat percentage. The compromised-health group (CH) was worst on both. The overall pattern is a gradient from OA to SA to CH, not an SA advantage.
Breakdown by Health Group (Table 2)
Group sizes: OA n = 35 (23 men, 12 women), SA n = 24 (14, 10), CH n = 23 (16, 7). Only 19 CH participants completed exercise testing.
A caution before the numbers: the authors say the within-group changes in Table 2 are descriptive and were not tested. Only the flagged rows showed a statistically significant between-group difference in the mixed-effects model. Everything else is directional at best.
Body composition
| Measure (9-year change) |
OA |
SA |
CH |
Significant group difference? |
| Fat mass |
+2.8 kg (+18%) |
+3.5 kg (+21%) |
+3.9 kg (+23%) |
None |
| Body fat % |
+5.1 points |
+5.1 points |
+6.1 points |
None |
| Lean mass |
-4.2 kg (-8.1%) |
-3.7 kg (-7.0%) |
-5.1 kg (-9.3%) |
SA vs CH |
| Total “recomposition” (lean lost + fat gained) |
7.0 kg |
7.2 kg |
9.0 kg |
Not tested (my calculation) |
| Body weight |
-1.0 kg |
+0.1 kg |
-1.0 kg |
None |
SA had the smallest lean-mass loss, and that is the only body-composition contrast that reached significance. CH had the worst recomposition on every measure. The spread in fat gain between groups is only about 1 kg, and the confidence intervals overlap heavily. OA ranged 1.9 to 3.7 kg and CH 2.6 to 5.3 kg. [Confidence: High that the gradient is directional, Low that it is real]
Cardiorespiratory function
| Measure (9-year change) |
OA |
SA |
CH |
Significant group difference? |
| VO2peak (ml/kg/min) |
-7.8 (-17.3%) |
-8.6 (-19.5%) |
-10.5 (-24.2%) |
OA vs CH |
| VO2peak per kg lean mass |
-6.6 (-11.4%) |
-7.9 (-13.6%) |
-10.3 (-18.0%) |
OA vs CH |
| Power at VO2peak (W) |
-44 (-17.5%) |
-49 (-18.7%) |
-73 (-27.4%) |
OA vs CH, SA vs CH |
| Oxygen pulse (ml/beat) |
-2.4 (-13.6%) |
-2.3 (-12.5%) |
-3.9 (-21.2%) |
OA vs CH, SA vs CH |
| Max heart rate (bpm) |
-9 |
-14 |
-11 |
OA vs SA |
| VT per kg lean mass |
-2.2 (-5.0%) |
-4.3 (-9.5%) |
-5.6 (-12.8%) |
OA vs CH |
| VE/VCO2 slope |
25.6 to 30.7 |
26.0 to 30.5 |
28.1 to 35.0 |
None |
| VO2 kinetics tau (s) |
+1.5 |
+4.7 |
+5.7 |
None (very wide CIs) |
| Resting heart rate (bpm) |
+1.9 |
+3.1 |
+4.9 |
None |
The CH penalty is mostly central. Oxygen pulse fell about 60% more than in the other groups, and power at peak fell by 73 W against about 45 W. This fits cardiac disease plus beta blockers or pacemakers limiting maximal cardiac output.
The CH group’s VE/VCO2 slope was already the highest at baseline (28.1) and reached 35.0 at follow-up. In cardiology, slopes above about 34 carry prognostic weight, so this points to emerging cardiopulmonary pathology rather than aging alone. [Confidence: Medium]
Normalizing to lean mass does not close the gap for CH. They lost 18% per kg of lean tissue against 11% in OA. So their extra fitness loss is not just the product of losing more muscle or gaining more fat. It is a loss of function per unit of tissue. [Confidence: Medium]
Metabolic and blood pressure
| Measure (9-year change) |
OA |
SA |
CH |
Significant group difference? |
| LDL (mmol/L) |
0.0 |
-0.9 (-26%) |
-0.4 |
OA vs SA |
| Total cholesterol (mmol/L) |
-0.1 |
-0.8 |
-0.5 |
OA vs SA |
| Fasting insulin (pmol/L, median) |
+8 |
+11.5 |
+11.5 |
None |
| Systolic BP (mmHg) |
127 to 129 |
135 to 141 |
134 to 136 |
None |
| Glucose, HDL, triglycerides |
Flat |
Flat |
Flat |
None |
The insulin rise follows the same OA-lowest pattern as fat gain, which fits your hypothesis directionally. The differences are small and were not significant.
Wellbeing and activity
- SF-12 physical health score: CH fell 3.6 points against less than 1 point in OA and SA. This was significant against both groups, so the CH participants noticed their decline.
- Anxiety: fell in OA (-1.0) but was flat in CH.
- Training: cycling volume fell by a similar amount in all three groups (roughly 200 to 250 km/month). The CH group’s “very hard” activity fell by 20 min/day while OA’s rose by 9. This contrast was not flagged as significant.
Baseline predictors (who ended up where)
- CH membership was predicted by higher baseline systolic BP, higher lean mass and slightly less light activity.
- SA membership was predicted by higher baseline systolic BP, higher sodium intake and lower FEV1 % predicted.
- Non-return was predicted by higher systolic BP. Non-returners averaged 138.8 mmHg against 126.6 in OA.
Blood pressure at age about 63, even within the “healthy” range, was the most consistent early signal of who would develop disease or drop out. For a biohacker audience, this is arguably the most actionable group-level finding in the paper. [Confidence: Medium, given small n and exploratory models]
On your fat hypothesis
Across the three groups, more fat gain lines up with worse cardiorespiratory decline, higher insulin and more disease. But this is a comparison of group averages across only three groups defined by disease status, not by fat gain. It cannot show that fat gain drove the worse outcomes. Emerging cardiovascular disease, medications and reduced training could each drive both fat gain and fitness loss.
Testing your hypothesis properly would need an individual-level regression of fat mass change against VO2peak change, which the authors did not report. The dataset is available on request from the corresponding author. [Confidence: Medium on direction, Low on causality]
I added the supplementary information when Claude could not get them
The supplementary figures change several of my earlier inferences. One is confirmed, one is refuted, and a new finding stands out: most of the compromised-health (CH) group were not being treated for their cardiovascular disease.
A reminder on the fat question: successful agers (SA) did not gain the least fat. Optimal agers (OA) gained the least fat mass (+2.8 kg, against +3.5 kg in SA and +3.9 kg in CH). OA and SA tied on body fat percentage (+5.1 points each), and CH was worst (+6.1). None of these differences were statistically significant.
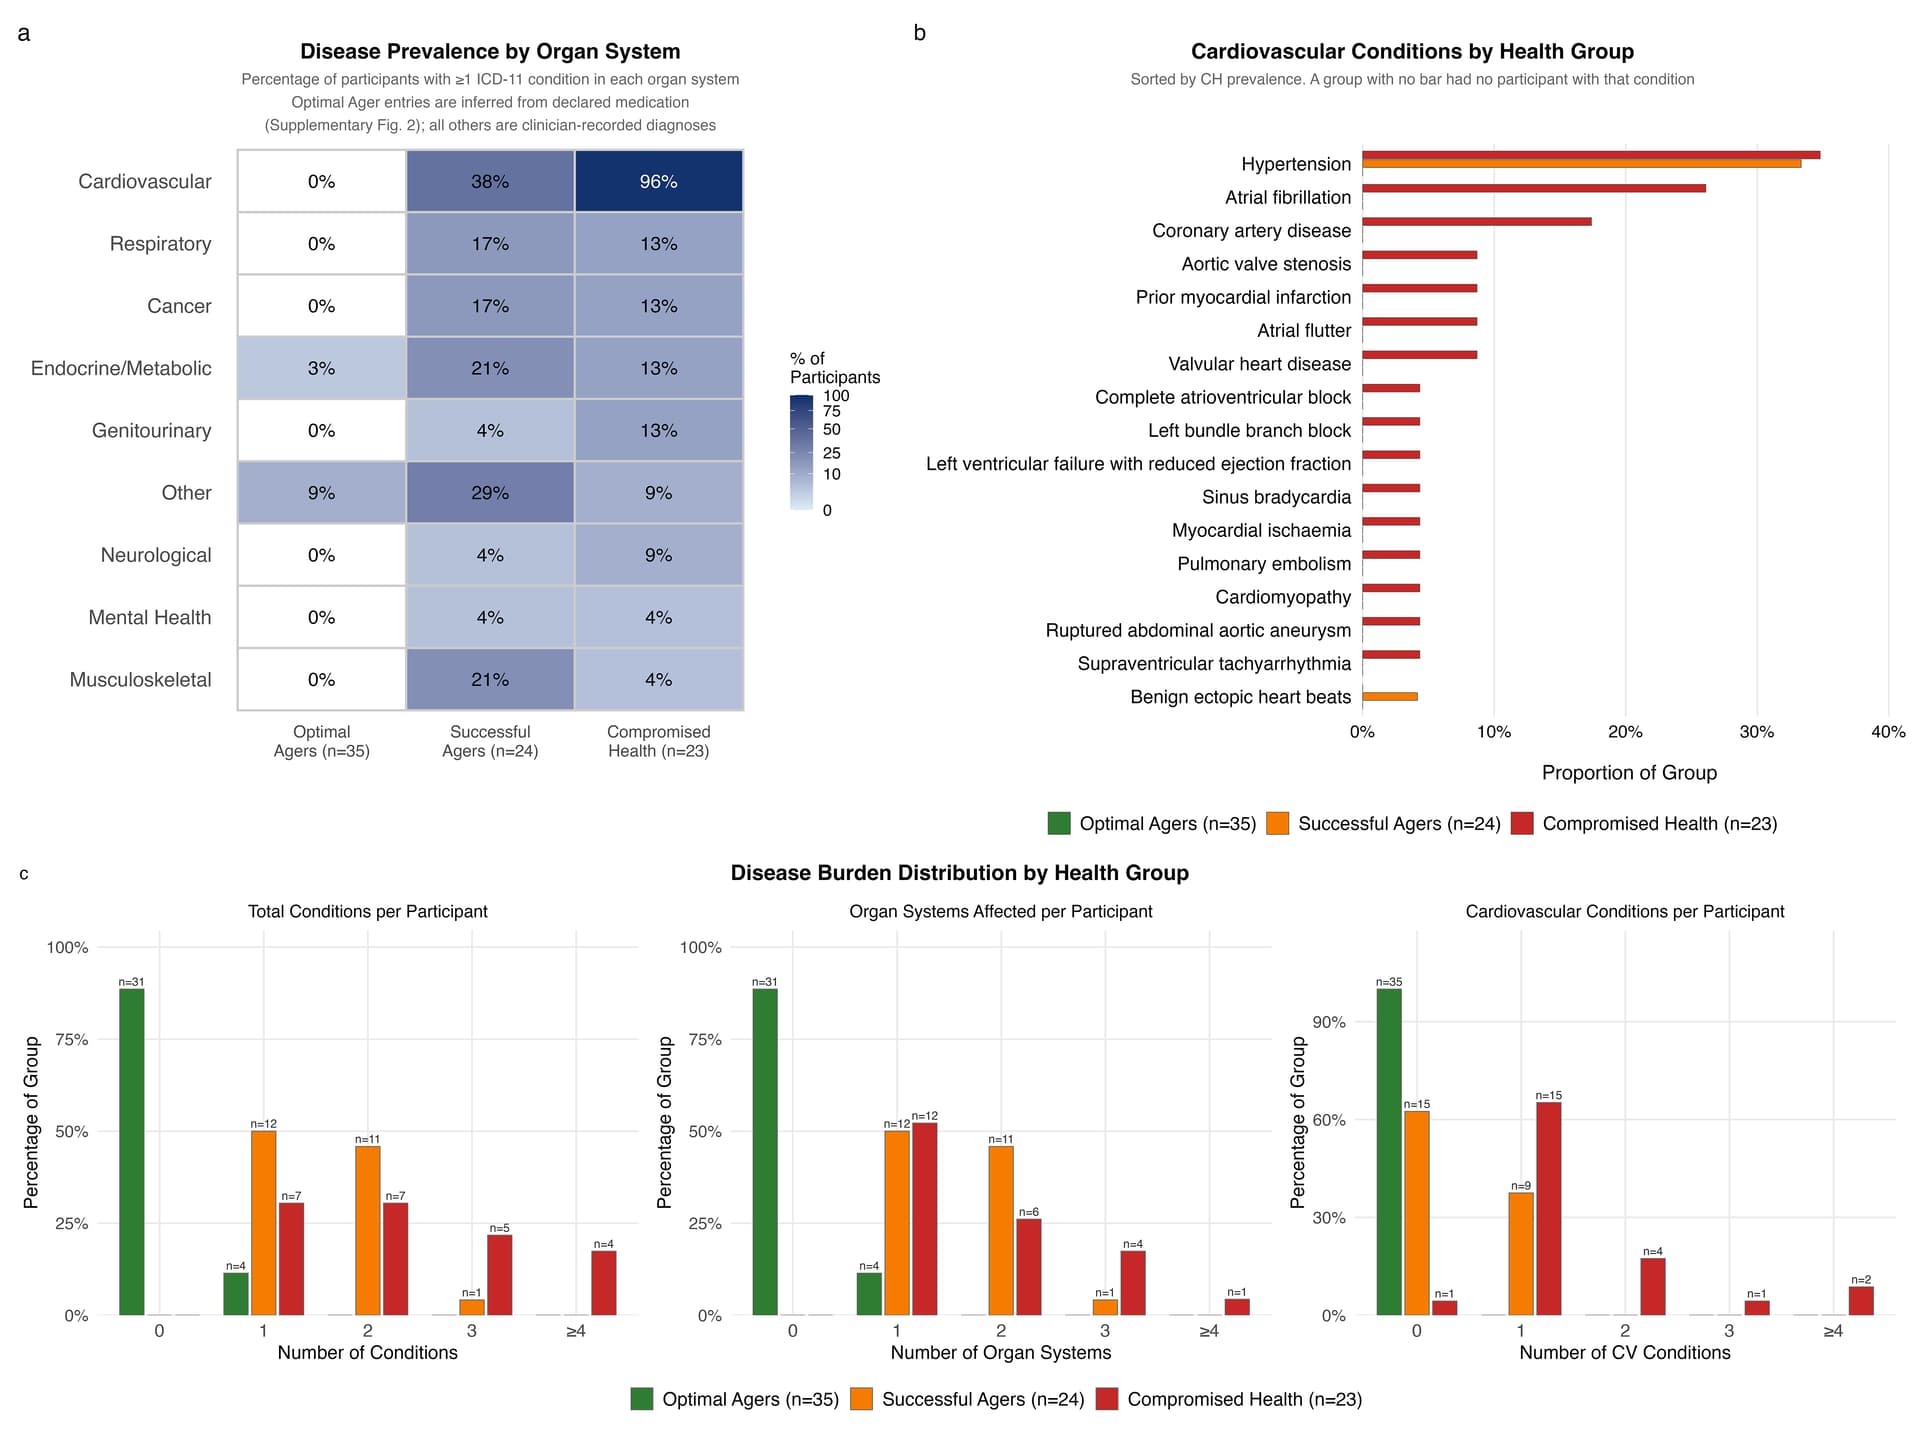
1. Who Was in Each Group (Supplementary Fig. 1)
|
OA (n=35) |
SA (n=24) |
CH (n=23) |
| Participants with zero diagnosed conditions |
31 (89%) |
0 |
0 |
| Participants with 3 or more conditions |
0 |
1 (4%) |
9 (39%) |
| Any cardiovascular condition |
0% |
38% |
96% |
| Cancer |
0% |
17% |
13% |
| Respiratory |
0% |
17% |
13% |
| Endocrine or metabolic |
3% |
21% |
13% |
| Musculoskeletal |
0% |
21% |
4% |
Cardiovascular conditions, approximate counts read from the bars:
- SA: hypertension in about 8 people and benign ectopic beats in 1. Hypertension is essentially the whole cardiovascular story in this group.
- CH: hypertension about 8, atrial fibrillation about 6, coronary artery disease about 4. Two people each had aortic valve stenosis, prior myocardial infarction, atrial flutter or other valvular disease. There was one case each of complete AV block, left bundle branch block, heart failure with reduced ejection fraction, sinus bradycardia, myocardial ischaemia, pulmonary embolism, cardiomyopathy, ruptured abdominal aortic aneurysm and supraventricular tachycardia.
Rhythm and conduction problems dominate the CH group. Atrial arrhythmias (AF, flutter and SVT) affect roughly 8 to 11 of the 82 returners, depending on overlap between diagnoses. This matches the pattern described in veteran endurance athletes, where atrial fibrillation, conduction disease and coronary plaque are over-represented.
Without an age-matched population comparison, however, the study cannot say whether this rate is actually elevated. AF prevalence in people in their 70s is already in the mid-to-high single digits. [Confidence: Medium that the pattern fits athlete’s-heart pathology, Low that the rate is elevated]
Cancer appears in 7 returners (4 SA, 3 CH), in addition to the 4 cancer deaths among non-returners.
2. Medications by Group (Supplementary Fig. 2)
By drug class (% of group)
| Class |
OA |
SA |
CH |
| Antithrombotics |
0% |
4% |
26% |
| Antihypertensives |
0% |
17% |
22% |
| Beta-blocker or rate control |
0% |
0% |
13% |
| Lipid-lowering |
3% |
25% |
9% |
| Thyroid |
0% |
17% |
9% |
| Acid suppression (PPI) |
9% |
0% |
9% |
| Respiratory inhalers |
0% |
8% |
9% |
| Urological (BPH) |
0% |
4% |
9% |
| Antidepressant or anxiolytic |
0% |
4% |
4% |
| Bone health |
0% |
8% |
0% |
| Heart-failure therapy |
0% |
0% |
4% |
| Systemic corticosteroid |
0% |
0% |
4% |
Specific cardiovascular drugs (approximate counts)
- OA: statin (1).
- SA: statin (6), amlodipine (3), alirocumab (1), losartan (1), perindopril (1), aspirin (1).
- CH: ramipril (4), bisoprolol (3), aspirin (2), rivaroxaban (2), statin (2), amlodipine (1), apixaban (1), edoxaban (1), lercanidipine (1), sacubitril/valsartan (1).
Medication burden
|
OA |
SA |
CH |
| Taking no medications |
31 (89%) |
8 (33%) |
10 (43%) |
| Taking 4 or more medications |
0 |
0 |
3 |
| Taking no cardiovascular drugs |
34 (97%) |
15 (63%) |
13 (57%) |
3. What the Medications Explain (and What They Don’t)
SA’s cholesterol drop: confirmed as drug-driven
A quarter of SA were on lipid-lowering therapy: six on a statin, one of whom was also on alirocumab (a PCSK9 inhibitor that lowers LDL by roughly half). This easily accounts for SA’s 0.9 mmol/L LDL drop, against no change in OA.
This matters for interpretation. The paper’s finding that SA had a “larger reduction in total and LDL cholesterol” is a treatment effect, not an effect of aging or exercise. [Confidence: High]
SA’s larger max heart rate drop: not explained by beta blockers
No SA participant took a beta blocker or rate-control drug. Their decline of 14 bpm in max heart rate (against 9 in OA) came from something else. Candidates include true biological variation, a chance finding in an exploratory test, or effort differences on test day. The confidence interval (-9.6 to -0.5 bpm) sits close to zero. [Confidence: Low for any explanation]
CH’s larger VO2peak decline: only partly explained by drugs
Only 3 of 23 CH participants took bisoprolol. At most one or two had pacemakers, inferred from the AV block and bradycardia diagnoses. The authors cite beta blockers and pacemakers as a reason for CH’s steeper decline, but this applies to only a small minority of the group.
Most of CH’s extra loss in oxygen pulse and peak power is better attributed to the disease itself: AF, valve disease, coronary disease and one case of heart failure with reduced ejection fraction. [Confidence: Medium]
Most of the CH group was untreated
This is the finding that stands out. Ninety-six percent of CH had cardiovascular disease, yet 57% took no cardiovascular medication and 43% took no medication at all. Roughly 6 CH participants had AF, but only 4 were on an anticoagulant (rivaroxaban, apixaban or edoxaban).
“Poorly controlled” therefore appears to mean mostly untreated or undiagnosed, not failing on therapy. Some diagnoses were probably made by the study’s own clinician-reviewed ECG and blood pressure screening. If so, the study effectively found a sizeable burden of unrecognized heart disease in fit older cyclists.
The practical message for fit older adults: high fitness can mask significant cardiac disease, so screening should not be skipped because someone is fit. [Confidence: Medium, since the timing of diagnosis is not reported]
SA’s hypertension was not really “well controlled”
About 8 SA participants had hypertension, but only 4 took antihypertensives. SA’s mean systolic pressure at follow-up was 141 mmHg, above the usual 140 threshold. This is a definitional weakness in the grouping. [Confidence: Medium]
OA was not entirely medication or disease free
Four OA participants took medication: one a statin and three a PPI. The figure notes that the authors inferred conditions for these participants from their medications. These people were still classed as meeting the original health criteria. This is a minor inconsistency, but it slightly blurs the line between the “disease-free” and “successful” groups.
A statin caveat for a mitochondria audience
In a randomized trial of previously sedentary adults, simvastatin blunted the improvement in VO2max from exercise training and reduced muscle mitochondrial content. SA, with 25% on statins, had an intermediate VO2peak decline (-19.5%, between OA and CH).
Six statin users are far too few to test this, and the context differs: these were maintenance-trained athletes, not people starting training. Still, it is a question worth raising for statin-using endurance athletes who track VO2max. [Confidence: Low for relevance here]
4. Training and Age Did Not Predict Decline (Supplementary Fig. 5)
| Correlation with % change in VO2peak |
Spearman rho |
P |
n |
| Baseline age |
-0.117 |
0.31 |
78 |
| % change in cycling volume |
0.108 |
0.35 |
76 |
| % change in sedentary time |
0.097 |
0.41 |
74 |
| % change in light activity |
0.134 |
0.26 |
74 |
| % change in moderate activity |
-0.039 |
0.74 |
74 |
| % change in hard activity |
-0.018 |
0.88 |
74 |
| % change in very hard activity |
0.041 |
0.73 |
74 |
In plain terms, none of these factors explains more than about 2% of the differences between people in how much fitness they lost. That is effectively nothing.
“Not significant” is not the same as “no effect,” though. For the cycling-volume correlation, the 95% confidence interval runs from about -0.12 to +0.34 (my calculation). A true correlation of 0.3, meaning training explains about 10% of the variation, cannot be ruled out with 76 people and a self-reported measure. The authors’ statement that training change was unrelated to VO2 decline should be read as “no detectable relationship.” [Confidence: High]
By eye, the scatterplots show two more things:
- The worst decliners (losses beyond about 32%) are disproportionately red, meaning CH. Health status appears to matter more than age or training change.
- Several people increased their cycling volume, one by roughly 300%, and still lost 18% of their VO2peak. Adding more volume did not protect against decline.
5. Your Fat Hypothesis Revisited
The supplementary data do not support fat gain as the driver of group differences.
- Disease burden and cardiac pathology (AF, valve and coronary disease) are much stronger candidates. These are the variables that most sharply separate CH from the other groups.
- Drugs that commonly cause weight gain were rare. Only 3 people took a beta blocker, a class associated with modest weight gain, and systemic corticosteroid use was a single case.
- Thyroid replacement was most common in SA (17%). Treated hypothyroidism could plausibly influence body composition, but SA’s fat gain was intermediate, so there is no clear signal.
Group-level fat gain does run in the same direction as worse outcomes (OA lowest, CH highest). But with a spread of about 1 kg, heavily overlapping confidence intervals, and a group structure defined by disease, the data cannot separate fat gain from the diseases that cause both. An individual-level analysis within groups would be needed, and it isn’t reported. [Confidence: Low for fat as an independent driver]
Revised Bottom Line by Group
- OA (35): Nearly all medication free and disease free. This is the cleanest “exercise plus aging” signal: a 17% VO2peak decline, 4.2 kg lean loss and 2.8 kg fat gain over nine years.
- SA (24): Mainly mild, partly treated hypertension, plus thyroid, respiratory, musculoskeletal and cancer diagnoses. They look physiologically much like OA. Their “better cholesterol” is a statin and PCSK9 effect.
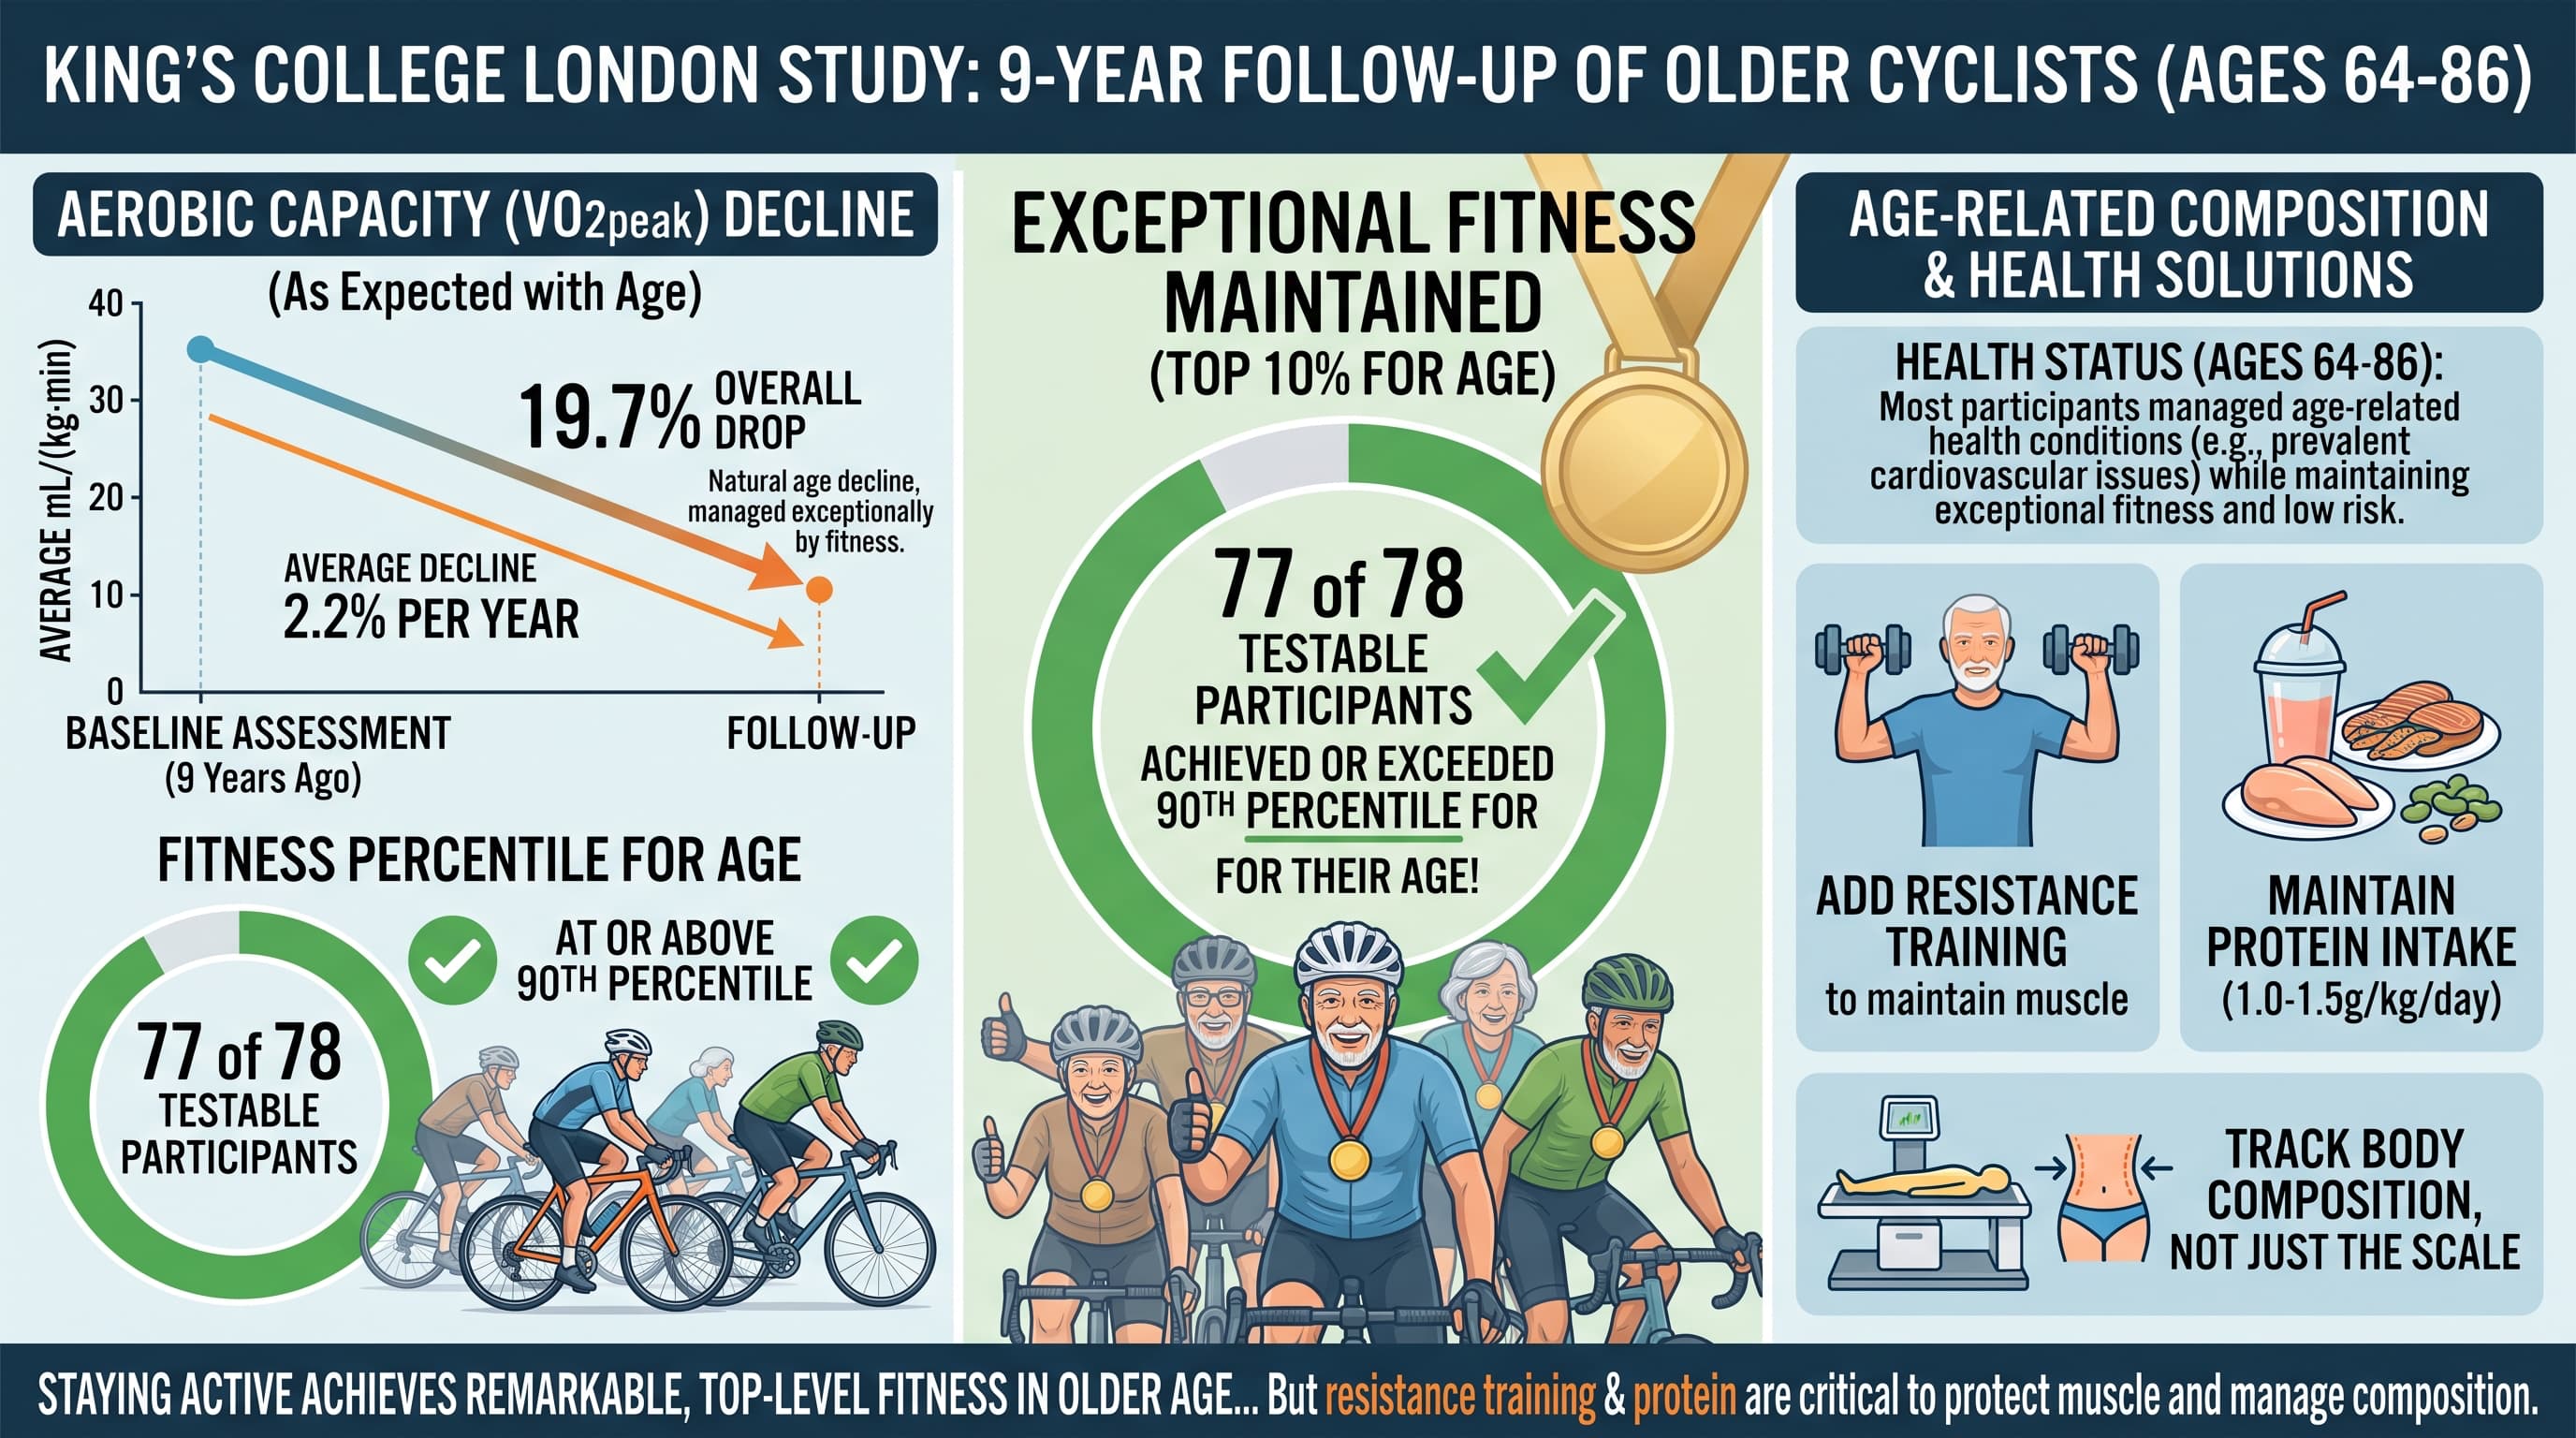
- CH (23): Mainly arrhythmia, conduction, valve and coronary disease, and mostly untreated. They had the largest fitness and lean mass losses and the largest fat gain. Even so, all but one stayed at or above the 90th percentile for fitness, which shows how much a high fitness level can hide.
References
- Fathi AS, Francis T, Milbourn E, et al. A 9-year longitudinal investigation into physiological aging in highly active older adults. GeroScience. 2026. A 9-year longitudinal investigation into physiological aging in highly active older adults | GeroScience | Springer Nature Link (Table 2; Supplementary Figs. 1, 2 and 5)
- Mikus CR, Boyle LJ, Borengasser SJ, et al. Simvastatin, with or without exercise, attenuates improvements in cardiorespiratory fitness in overweight or obese adults. J Am Coll Cardiol. 2013;62(8):709-714.
- Sharma AM, Pischon T, Hardt S, Kunz I, Luft FC. Hypothesis: beta-adrenergic receptor blockers and weight gain: a systematic analysis. Hypertension. 2001;37(2):250-254.
- Robinson JG, Farnier M, Krempf M, et al. Efficacy and safety of alirocumab in reducing lipids and cardiovascular events (ODYSSEY LONG TERM). N Engl J Med. 2015;372(16):1489-1499.