World’s oldest person had a young microbiome and 'exceptional genome'

Maria

Someone needs to be doing this type of in-depth analysis on an ongoing basis on the 500 to 1000 longest lived people in the world.

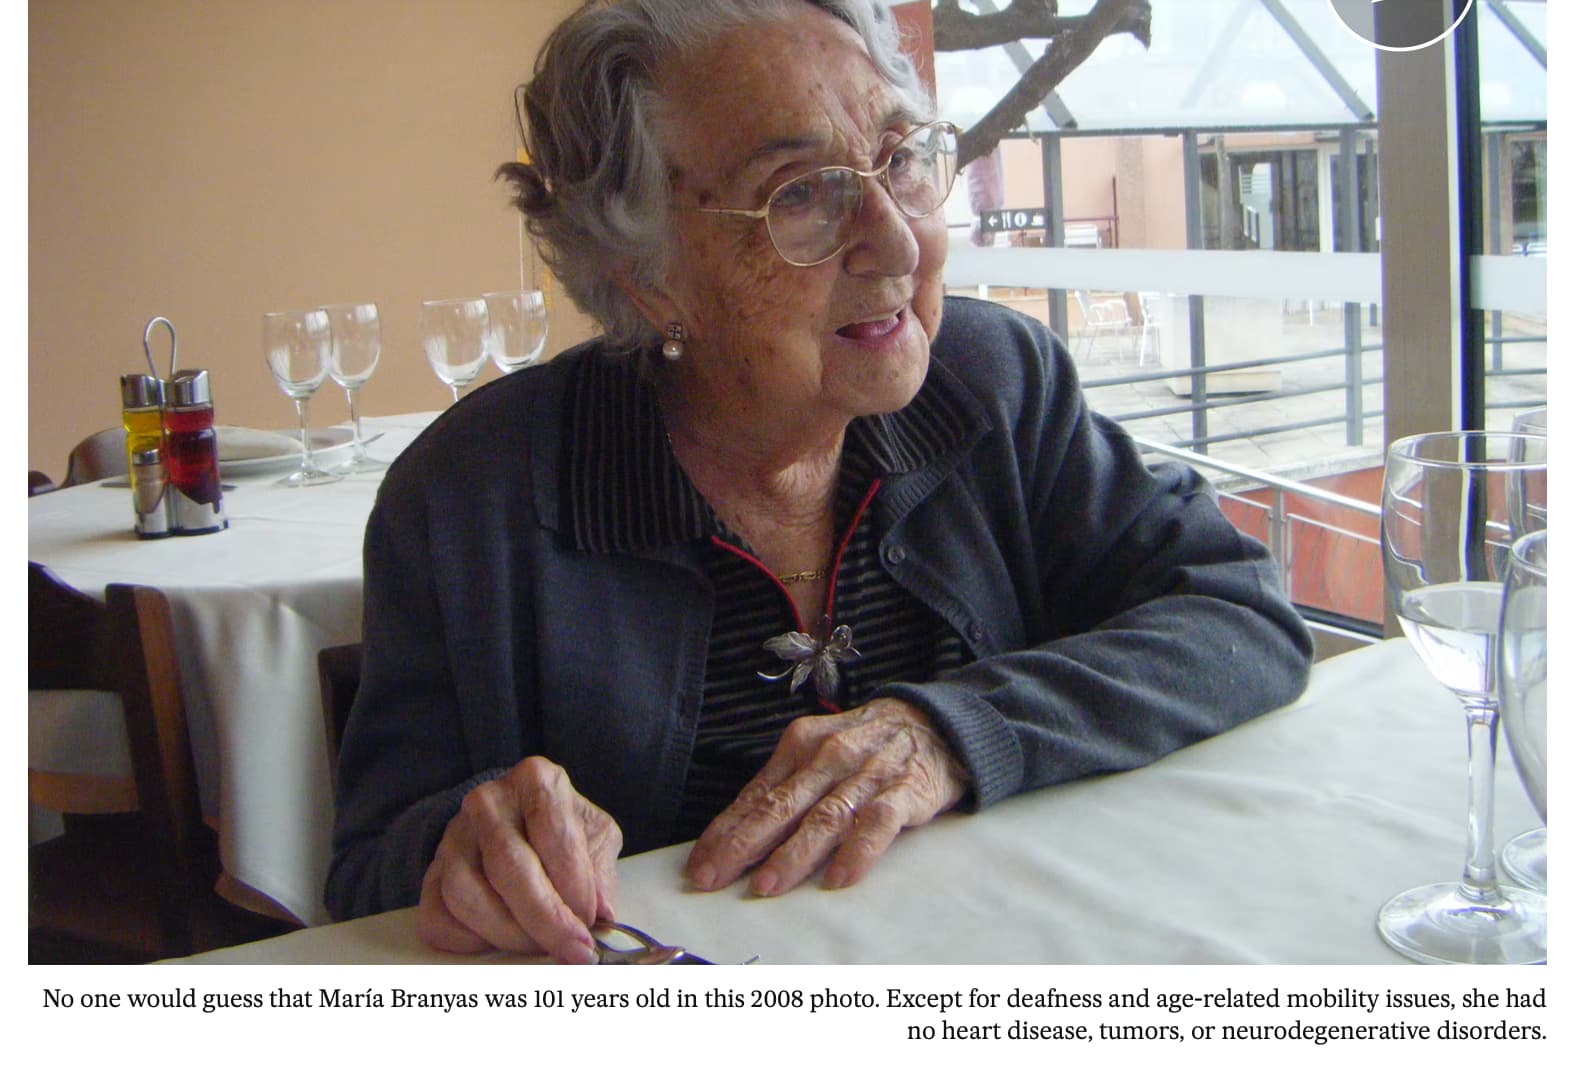
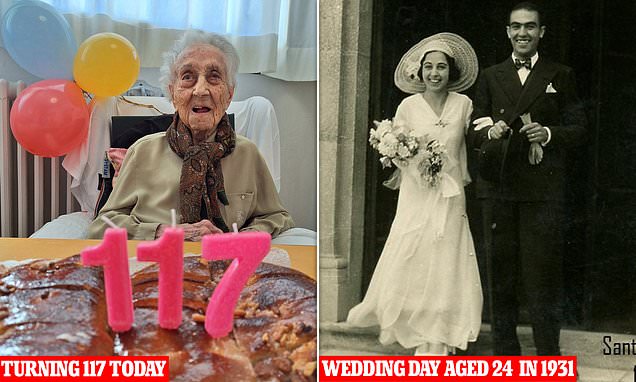
Between 17 January 2023 and 19 August 2024, María Branyas Morera, of Spain, was officially the world’s oldest person, until she died aged 117 years and 168 days. To uncover the secrets of her extraordinary longevity, a team of researchers has done a deep dive into her genetics, microbiome and lifestyle.

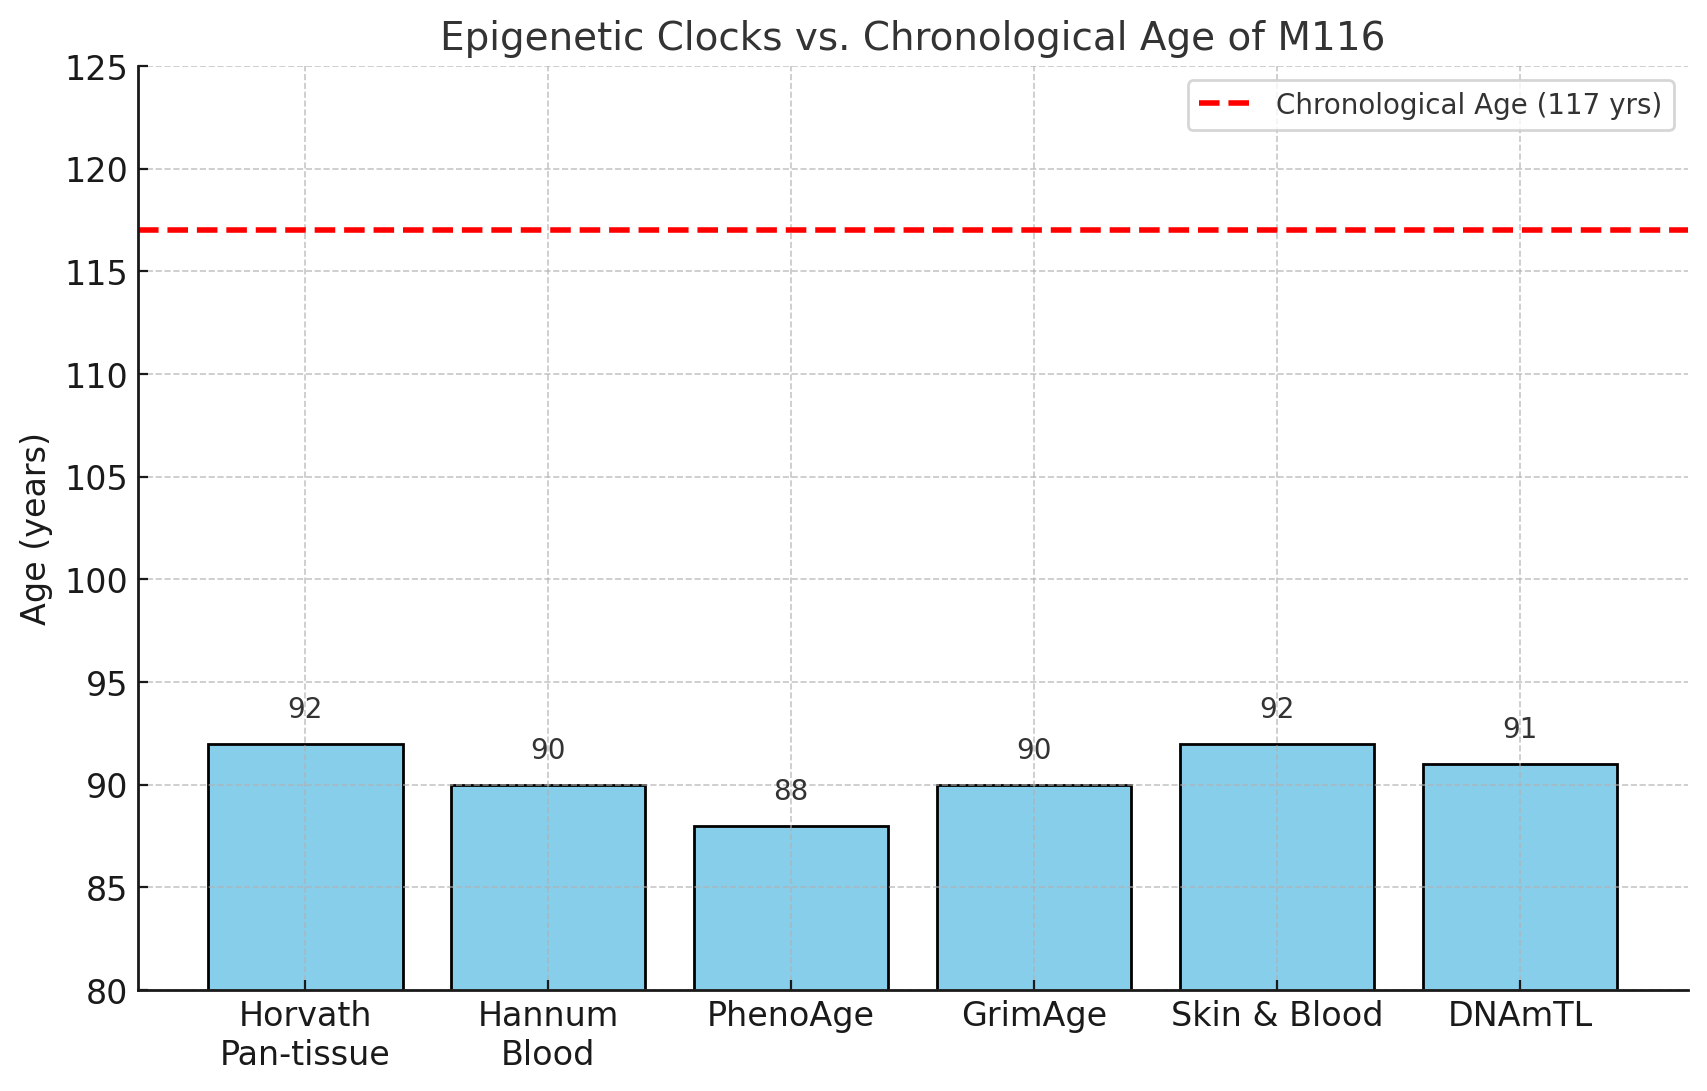
When Morera was 116 years old, the team collected samples of her blood, saliva and stool, to analyse her genetics. “She had an exceptional genome enriched in variants in genes that are associated with enhanced lifespan in other species, such as dogs, worms and flies,” says team member Manel Esteller at the Josep Carreras Leukaemia Research Institute in Barcelona, Spain.

Morera, who showed no sign of dementia, also had many gene variants that keep blood lipid levels low, protecting the heart and cognition, says Esteller. “At the same time, she was devoid of gene variants associated with the risk of pathologies such as cancer, Alzheimer’s and metabolic disorders.”

Blood test results also revealed that her lipid metabolism was among the most efficient ever reported, according to the researchers. “Her lipid profile was amazing, with very low cholesterol,” says Esteller. “This was related to her frugal diet and genes that quickly metabolised damaging molecules.”

Esteller says Morera didn’t drink alcohol or smoke, and adhered to a Mediterranean diet, made up of lots of vegetables, fruits, legumes and olive oil. She also ate three servings of plain, sugar-free yoghurt every day.

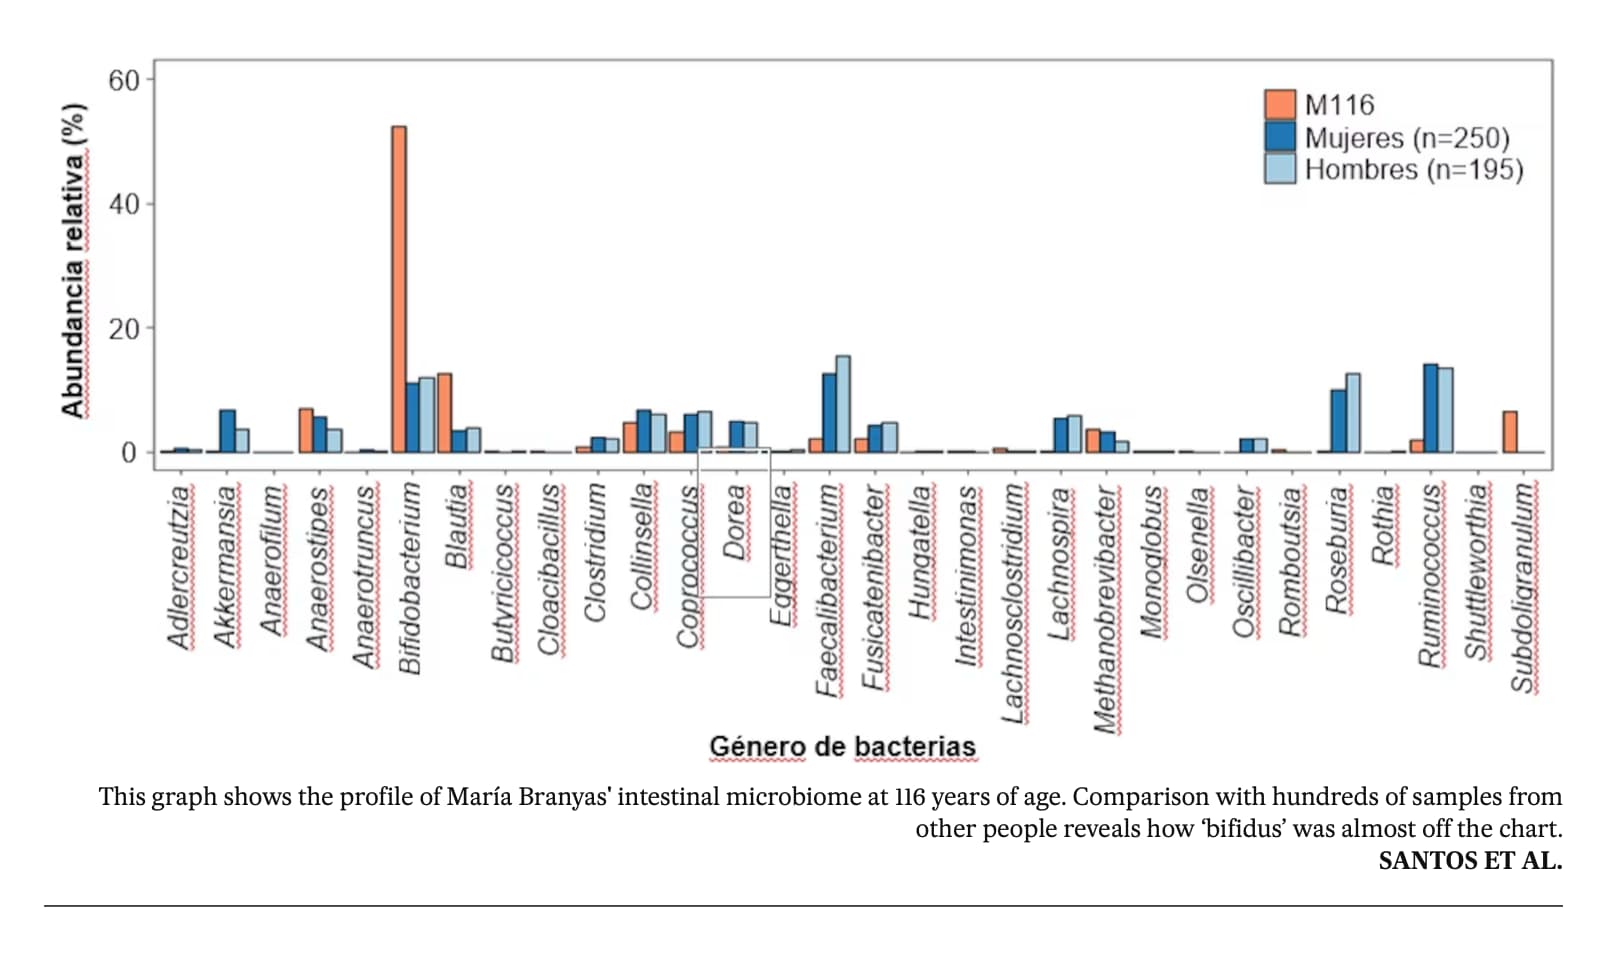
One of the most “startling” findings was the high levels of Actinobacteriota bacteria in her gut, including the well-known probiotic Bifidobacterium. This typically declines with age, but is elevated in centenarians and supercentenarians, and it is thought to have multiple anti-ageing benefits, such as reducing inflammation.

The team suspects her yoghurt consumption helped continuously replenish her Bifidobacterium levels. “It shows that maybe a dietary intervention can be associated not only with avoiding obesity and other pathologies, but also with prolonged life, acting through the microbiome gut landscape,” says Esteller.

Read the full story: World’s oldest person had a young microbiome and ‘exceptional genome’ (NewScientist)

She lived to 117: what her genes and lifestyle tell us about longevity (Nature Aging)

Branyas aced her bloodwork; she had low levels of ‘bad’ cholesterol and high levels of ‘good’ cholesterol, which suggests an efficient lipid metabolism. Her inflammation markers were also low and she had a strong immune system — at the age of 113, she was the oldest person in Spain to have COVID-19 and survive. “Sometimes our immune cells get a little bit unloyal and start to attack our own cells, causing inflammation,” Esteller says. “There was no nothing like that.”

Esteller thinks Branyas’s lack of inflammation could be linked to her healthy gut microbiome, which resembled that of a much younger person. He points to her high levels of Bifidobacterium, a genus of beneficial bacteria that was probably boosted by her diet, which included three daily servings of yogurt.

Richard Faragher at the University of Brighton in the UK says the study demonstrates how many tests are now available to longevity researchers, but cautions that this is a case report of one individual and there is a “danger that a slightly unusual variant in, for example, a gene can be turned into a scientific ‘just-so story’ about its relevance to ageing”.

Full story: She lived to 117: what her genes and lifestyle tell us about longevity (Nature Aging)

Full research paper (Open access): The multiomics blueprint of the individual with the most extreme lifespan (Cell)

14 Likes

Most mainstream yogurts contain Lactobacillus species, but not all contain significant amounts of Bifidobacterium. If you’re specifically looking for yogurts with Bifidobacterium (often labeled as Bifidobacterium lactis or Bifidobacterium bifidum), here are the main categories and brands:

1. Probiotic-Fortified Yogurts

  • Many brands add Bifidobacterium lactis (sometimes labeled as B. animalis subsp. lactis, e.g., BB-12®).
  • Common U.S. examples:
    • Activia (Danone/Dannon) – contains Bifidobacterium animalis subsp. lactis DN-173 010/CNCM I-2494, often marketed as Bifidus Regularis. This is one of the highest-dose Bifidobacterium yogurts available commercially.
    • Stonyfield Organic – many of their yogurts contain Bifidobacterium lactis alongside Lactobacillus strains.
    • Nancy’s Yogurt – includes Bifidobacterium bifidum and Bifidobacterium lactis in their culture list.
    • Yoplait Original (in some markets) – sometimes lists Bifidobacterium lactis.

2. European & Asian Yogurts

  • In Europe and Asia, bifido-fortified yogurts are common.
    • Actimel / DanActive (Danone) – contains Bifidobacterium lactis.
    • Some Japanese yogurts (like Meiji Probio Yogurt R-1) may include bifido strains depending on the product line.

3. Specialty & Organic Yogurts

  • Health food store brands often add more diverse probiotic strains.
    • Maple Hill, Siggi’s, and some Goat’s milk yogurts include bifido species (though you must check the label).
    • Kefirs (like Lifeway Kefir) usually contain several Bifidobacterium strains.

:white_check_mark: How to Identify Them

Look at the ingredient label:

  • Phrases like “Bifidobacterium lactis”, “Bifidobacterium bifidum”, or “B. animalis subsp. lactis” mean significant bifido content.
  • “Live and active cultures” by itself doesn’t guarantee Bifidobacterium—only Lactobacillus is required for that seal.

I found some evidence suggesting that certain Kirkland (Costco) Greek yogurts do include Bifidobacterium (or bifidum / bifidus) among their “live cultures,” but it’s not guaranteed that the amounts are “significant” (i.e. high dose) or stable over shelf life. Here’s a breakdown of what I discovered and caveats to keep in mind:


What I found

  • In an ingredients listing for Kirkland Signature Organic Probiotic Greek Yogurt, “Active Bacterial Cultures” includes Bifidobacterium lactis (or “Bifidobacterium lactic” as sometimes written) alongside Lactobacillus species.
  • A nutrition / label-info site for Kirkland Organic Greek Yogurt, Plain lists “live and active cultures: lactobacillus bulgaricus, streptococcus thermophilus, lactobacillus acidophil, bifidus, lactobacillus casei.”
  • However, the standard Kirkland Signature Greek Non-Fat Yogurt (plain) listing on Costco’s site does not list Bifidobacterium among its “live and active cultures”; instead it names Streptococcus thermophilus, Lactobacillus bulgaricus, Lactobacillus acidophil, FROS, Lactobacillus casei.
  • Another listing for “Kirkland Greek Yogurt (Probiotic)” includes Bifidobacterium among the cultures.

So: some Kirkland Greek yogurts seem to include bifidobacteria in their culture mix, while others do not (or at least don’t list them).


Interpretation: Do they have significant bifidobacteria?

Even if Bifidobacterium is listed on the label, several factors affect whether it is present in quantities that matter biologically:

Factor Why it matters
Label vs. actual count The label may list bifido among “active cultures,” but not tell you how many CFU (colony forming units) of that strain remain.
Survival through shelf life Probiotic viability may decline over time; by “best before” date, levels might drop.
Strain specificity Some Bifidobacterium strains are more robust or beneficial than others.
Processing (heat, pH, storage) Yogurt processing, pasteurization steps, and storage conditions can kill or reduce bacteria.

Thus, while the presence of Bifidobacterium on a label is a good sign, it doesn’t necessarily guarantee a “significant” (i.e., high, therapeutically relevant) dose.


Conclusion & Recommendation

  • Yes, Kirkland Greek yogurts can include Bifidobacterium (e.g., in some “probiotic” or “organic probiotic” variants) based on label listings.
  • But, not all their Greek yogurts list it, and the label doesn’t always guarantee a biologically meaningful dose.
  • If you want to be confident of a strong bifidobacteria dose, look for yogurts that explicitly state the strain and CFU count (e.g. “Bifidobacterium lactis … 1 × 10⁹ CFU”) or yogurts marketed as probiotic / bifido-fortified.
5 Likes

I was just reading this article. Pretty interesting if part of the reason for her longevity are the 3x/day
yogurts and her bifidium-rich gut microbiota.

Interestingly, inulin, which has been posted on here, also promotes bifidium.

6 Likes

Yes - it is very interesting. I’m trying to find the actual full research paper but have not had any luck yet.

2 Likes

Here’s the paper, I"ve not had a chance to look at it yet

https://www.cell.com/cell-reports-medicine/fulltext/S2666-3791(25)00441-0

3 Likes

From GPT5:

Do an in-depth summary of the attached paper, and in the summary convert all blood measures and biomarkers into measuring units that are typically used in the USA.

Here’s a detailed summary of the paper “The multiomics blueprint of the individual with the most extreme lifespan” (Cell Reports Medicine, 2025) with all reported biomarkers converted into the units typically used in the USA (mg/dL for cholesterol/lipids, mg/L for inflammation markers, mg/dL for glucose, creatinine, etc.).


Summary of the Study

Study Subject

  • Individual (“M116”): World’s oldest verified living person (117 years, 168 days).
  • Born in San Francisco (1907), Spanish ancestry, lived most of her life in Spain.
  • Remarkably, she exceeded the Catalonian female life expectancy (~86 years) by more than 30 years.

The study conducted a multi-omics analysis: genomics, transcriptomics, metabolomics, proteomics, microbiome, and epigenomics.


Key Findings by Domain

1. Genomics

  • Telomere length: Only ~8 kb, the shortest among controls. Despite extreme telomere attrition, she remained cancer-free—possibly because very short telomeres limit malignant cell replication.

  • Clonal hematopoiesis: Mutations in SF3B1 and TET2, usually precursors of cancer/CVD, but she remained free of these diseases.

  • Protective variants: Rare homozygous variants in genes linked to:

    • Immune fitness (DSCAML1, MAP4K3).
    • Cardioprotection & lipid metabolism (LRP1, LRP2).
    • Neuroprotection (NSUN5, TTBK1).
    • Mitochondrial function (ND5, COX1, MTG2, MTCH2, MRPS9).

2. Immune Profile

  • Expanded age-associated B cells (ABCs) with high MYC expression, usually a pre-malignant signal.
  • Yet her immune system retained strong cytotoxic T cell dominance and markers of efficient autophagy (similar to younger controls).

3. Blood Biomarkers (Converted to U.S. Units)

Lipid Metabolism

  • Very low VLDL-cholesterol: ~5–10 mg/dL (vs. 20–30 mg/dL typical elderly).
  • Very low triglycerides: ~40–50 mg/dL (normal <150 mg/dL).
  • High HDL-cholesterol: ~80–90 mg/dL (“good” cholesterol; optimal >60 mg/dL).
  • Large HDL and LDL particles: high count (suggesting effective lipid transport).
  • Low small HDL particles: favorable, as small HDL is linked to dysfunction.

Other Lipid-related Metabolites

  • Low saturated fatty acids: <20% of total plasma fatty acids (U.S. average in elderly ~30–35%).
  • Low esterified cholesterol: ~110 mg/dL (vs. typical ~140–160 mg/dL).
  • High free cholesterol: ~70 mg/dL (higher free cholesterol linked with survival).
  • Low linoleic acid: ~15–20% of plasma fatty acids (vs. ~30% U.S. mean).
  • Low acetone (ketone body): <0.2 mmol/L.

Inflammation

  • GlycA: ~200–250 µmol/L → ~15–20 mg/L (very low; U.S. elderly median ~400 µmol/L ≈ 30–35 mg/L).
  • GlycB: similarly low (~15–20 mg/L range).
  • Indicates minimal systemic inflammation.

Amino Acids / Metabolites

  • Low glycine, histidine, valine, leucine (suggestive of frailty near end of life).
  • High lactate: ~3 mmol/L (slightly above normal 0.5–2.2 mmol/L).
  • High creatinine: ~1.2–1.3 mg/dL (elevated for a very elderly woman, though mild).

4. Proteomics

  • Upregulated proteins:

    • Lipid/cholesterol transport proteins.
    • Oxidative stress–response proteins.
    • Immunoglobulins (IGHG2, IGHG4 → efficient immune memory).
  • High Serum Amyloid A1 (SAA1): linked to Alzheimer’s risk, but no dementia was observed.


5. Microbiome

  • Very high Bifidobacterium (family Bifidobacteriaceae, genus Bifidobacterium).

    • Unusual for extreme old age (normally declines sharply).
    • Associated with anti-inflammatory effects and SCFA production.
  • Daily diet: ~3 yogurts/day with Streptococcus thermophilus and Lactobacillus bulgaricus, which likely promoted Bifidobacterium growth.

  • Low Proteobacteria & Clostridium, reducing pro-inflammatory bacteria.

  • Consistent with her adherence to a Mediterranean diet.


6. Epigenome

  • DNA methylation clocks showed biological age ~23 years younger than chronological.
  • Maintained hypermethylation of repetitive elements (LINE-1, ALU, ERV), which helps genomic stability.
  • Epigenetic profile clustered closer to younger individuals.

Overall Interpretation

  • Dual signatures of age: Very advanced age markers (short telomeres, clonal hematopoiesis, expanded aged B cells) coexisted with youth-associated features (low inflammation, excellent lipid metabolism, youthful microbiome, younger epigenetic age).
  • Suggests aging and disease can be decoupled.
  • Protective genetic variants, efficient metabolism, stable epigenome, and beneficial microbiome may have buffered the damaging effects of cellular aging.

Key U.S.-Unit Biomarker Summary

Marker Value in M116 Typical U.S. Elderly Range Interpretation
Triglycerides 40–50 mg/dL <150 mg/dL Extremely low (protective)
HDL-C 80–90 mg/dL >40 men / >50 women Very high (protective)
VLDL-C 5–10 mg/dL 20–30 mg/dL Very low (protective)
Free cholesterol ~70 mg/dL 45–65 mg/dL Favorable
Esterified cholesterol ~110 mg/dL 140–160 mg/dL Low (beneficial)
Saturated fatty acids <20% total 30–35% Very low (favorable)
GlycA (inflammation) ~15–20 mg/L ~30–35 mg/L Very low inflammation
GlycB ~15–20 mg/L ~30–35 mg/L Very low inflammation
Lactate ~3 mmol/L 0.5–2.2 mmol/L Elevated (end-of-life marker)
Creatinine ~1.2–1.3 mg/dL 0.6–1.1 mg/dL women Mildly elevated
Amino acids (glycine, valine, leucine, histidine) Low Normal Frailty marker

:white_check_mark: In sum: this supercentenarian achieved extreme longevity through a synergy of rare genetics, highly efficient lipid metabolism, minimal inflammation, beneficial microbiota, and preserved epigenetic youth, even while carrying cellular hallmarks of aging.


3 Likes

Prompt:

What is the difference between, and correlation between, VLDL-C blood measures and LDL-C measures?

GPT5 Response:

:small_blue_diamond: VLDL-C vs. LDL-C: Differences

1. Origin & Function

  • VLDL (Very-Low Density Lipoprotein)

    • Secreted by the liver.
    • Primarily carries triglycerides (TG) to tissues.
    • Each VLDL particle contains some cholesterol, but far less than LDL.
    • As VLDL particles deliver TGs to tissues (via lipoprotein lipase), they shrink and transform → IDL → LDL.
  • LDL (Low-Density Lipoprotein)

    • Derived from VLDL remnants.
    • Primarily carries cholesterol to tissues.
    • Contains much higher cholesterol per particle.
    • Strongly linked to atherosclerosis because cholesterol from LDL gets deposited in arterial walls.

2. Blood Levels & Units

  • LDL-C

    • Measured directly or calculated (Friedewald equation).

    • Typical U.S. target:

      • Optimal: <100 mg/dL
      • Borderline: 130–159 mg/dL
      • High: ≥160 mg/dL.
  • VLDL-C

    • Usually not directly measured in routine labs.
    • Often estimated as:

(only valid if TG <400 mg/dL).
  • “Normal”: <30 mg/dL.
  • Often ranges 5–30 mg/dL depending on TG levels.

:small_blue_diamond: Correlation Between VLDL-C and LDL-C

  • Metabolic Link

    • VLDL is a precursor to LDL: as triglyceride-rich VLDL particles lose TGs, they are remodeled into cholesterol-rich LDL particles.
    • Thus, high VLDL-C often predicts higher LDL-C later, especially in metabolic syndrome.
  • Triglycerides Connection

    • Elevated triglycerides → high VLDL-C → eventually more small dense LDL particles.
    • Small dense LDL is more atherogenic than large buoyant LDL.
  • Strength of Correlation

    • Studies suggest a moderate correlation (r ≈ 0.4–0.6) between VLDL-C and LDL-C, depending on diet, insulin resistance, and genetics.
    • In hypertriglyceridemia, the correlation is weaker, because VLDL can be very high while LDL is variable.
    • In metabolic syndrome/diabetes, high VLDL drives formation of small dense LDL, which is especially harmful.

:small_blue_diamond: Key Takeaways

  • VLDL-C = triglyceride carrier (short-lived, precursor).
  • LDL-C = cholesterol carrier (longer-lived, more directly tied to atherosclerosis).
  • High VLDL-C often → high LDL-C (via conversion), but they are not always proportional.
  • Both are atherogenic, but LDL-C is the primary target in cardiovascular guidelines.
  • VLDL-C is increasingly recognized as an independent risk factor, especially when triglycerides are high.

VLDL cholesterol overview

Finding reliable data on VLDL-C (very low density lipoprotein cholesterol) by fine age strata is difficult, because labs typically don’t report VLDL-C directly; it is estimated from triglycerides (as ~ triglycerides ÷ 5) in many clinical settings. (Cleveland Clinic)

Here’s a summary of what is known — and what is not well established — plus a plausible “optimal” range and a schematic graph.


What is “normal” / reference VLDL-C?

  • Many clinical sources define a “normal” or reference range for VLDL-C as approximately 2 to 30 mg/dL (Mount Sinai Health System).
  • Some sources say “normal below 30 mg/dL” and flag ≥30 mg/dL as elevated. (Cleveland Clinic)
  • Others note that VLDL is estimated from triglycerides, so the “normal” range can vary depending on triglyceride levels and lab methodology. (Cleveland Clinic)
  • Because direct measurements are rare, and because VLDL is estimated (and not always segmented by age), there is limited published data stratified by age groups.

One older (1981) lipoprotein study (Wahl et al.) did examine “VLDL cholesterol” distributions across age groups, though the data is less cited in more recent literature. (PubMed) That suggests some variation by age and sex, but it doesn’t provide a clear “optimal” curve.


What might “optimal” VLDL-C be (target) — by age?

In clinical practice, the concept of an “optimal” VLDL-C is less well established than for LDL, HDL, or total cholesterol. However, based on extrapolation from cardiovascular risk guidelines, one might consider:

  • For adults, < 30 mg/dL is often considered acceptable, and ideally lower. (Cleveland Clinic)
  • “Lower is better” is a guiding principle, especially in higher-risk individuals, because VLDL is atherogenic (carries triglycerides, may contribute to plaque formation) (Mayo Clinic)
  • In younger or very healthy adults, a “target” might be in the lower half of the normal range (say, 2 to 15 mg/dL), subject to their overall lipid and metabolic profile.
  • For older adults, one might accept slightly higher VLDL-C (e.g. 15–25 mg/dL) provided other lipids and risk factors are controlled — but this is speculative.

Because VLDL is tied to triglycerides, “optimal” VLDL is often achieved by targeting optimal triglyceride levels (e.g. < 100–150 mg/dL, or lower in very healthy individuals) (MedlinePlus).


Approximate (Plotted) VLDL-C by Age & Target

Because high-quality age-stratified VLDL data is not readily available, the following is a schematic / modeled graph:

  • X-axis: Age groups (e.g. 20–29, 30–39, 40–49, 50–59, 60–69, 70+)
  • Y-axis: VLDL-C in mg/dL
  • Curve A (observed/typical): modest upward drift in VLDL-C with age
  • Curve B (optimal/target): relatively flat low curve (e.g. 5–20 mg/dL)

Below is a rough hand-sketched data table, which you can plot:

Age group Typical / Observed VLDL-C (mg/dL) Hypothesized Optimal VLDL-C (mg/dL)
20–29 ~ 5 to 15 ~ 2 to 10
30–39 ~ 8 to 18 ~ 3 to 12
40–49 ~ 10 to 20 ~ 5 to 15
50–59 ~ 12 to 22 ~ 6 to 18
60–69 ~ 15 to 25 ~ 8 to 20
70+ ~ 18 to 28 (or up to 30) ~ 10 to 22

You can imagine two curves: the “typical” one rising gently with age, and the “optimal” one staying somewhat flat (or rising only slightly) but always below the typical.

If you like, I can generate a formal plotted graph (e.g. with Python / R) and send you a clean image. Do you want me to do that?

3 Likes

Wow, she really did have amazing lipids!

2 Likes

They mention Mediterranean diet but no mention of fish or meats. No medications listed either.
Interesting about the plain yogurt. Perhaps it was Greek yogurt since she adhered to a Mediterranean diet. No word on what size the serving size is. If that was true, 3 servings of Greek yogurt would be around 50 grams of protein.
As a serving size is 80 cals and 17g protein.
Other plain yogurt’s are around 100 cals, and 11g protein per serving x3 servings =33g protein
No word on her daily total calories + protein, carbs, fats etc.

She could have been consuming around 75+grams of protein a day total, along with her other foods like legumes (10g protein per serving at 125 cals approx), vegetables or grains(5g per 100cals of bread, and probably had a few 100 cals of veggies), and perhaps fish (20-30g protein, 140 cals at 20g protein), nuts (5g protein, 125 cals) or whatever else.

4 Likes

The brand I take also has bifidobacterium. It is strained, so it is thick. Tastier than Greek yogurt (Chobani).

2 Likes

Here’s a quick shopper’s table of U.S. yogurt brands that explicitly list Bifidobacterium on the culture label (including siggi’s). I linked each entry to a current label or brand page.

Brand Example product How Bifidobacterium appears on the label Notes on strain/CFU Source
Activia (Dannon/Danone) Activia Probiotic Yogurt Bifidobacterium animalis subsp. lactis DN-173 010/CNCM I-2494 Proprietary Activia strain; marketed dose “billions” per serving (no CFU at end-of-shelf-life disclosed on consumer packs). (Activia)
Stonyfield Organic Whole Milk Probiotic Yogurt, Plain (32 oz) Bifidobacterium BB-12®” (plus S. thermophilus, L. bulgaricus, L. acidophilus, L. paracasei, L. rhamnosus) BB-12® is a well-studied B. animalis ssp. lactis strain. (Stonyfield)
Nancy’s Organic 100% Grass-Fed Yogurt; Organic Probiotic Greek Yogurt Bifidobacterium lactis BB-12®” (+ multiple Lactobacillus strains); site claims “tens of billions” per serving on some lines High culture count messaging; specific strains listed on product pages. (Nancy’s Probiotic Foods)
siggi’s (Icelandic-style skyr) Plain nonfat (24 oz) Bifidobacterium” (along with S. thermophilus, L. bulgaricus, L. acidophilus, L. paracasei) Lists genus, not specific strain or CFU. (siggi’s Icelandic yogurt)
Chobani Chobani yogurt (company info sheet) Bifidus” (with S. thermophilus, L. bulgaricus, L. acidophilus, L. casei, L. rhamnosus) Corporate PDF lists cultures across Chobani yogurts; strain/CFU not specified on consumer pages. (Contentful)
Trader Joe’s (house brand) Greek Nonfat/Whole Milk Plain; European Style Organic Bifidobacterium / Bifidobacterium lactis” (listed among live active cultures) Multiple TJ’s yogurts explicitly include bifido on the ingredient panel. (Trader Joe’s)
Kirkland Signature (Costco) Organic Greek Yogurt, Plain “Contains live & active cultures… Bifidus/Bifidobacterium (varies by listing)” Several label databases show bifido on Kirkland Organic Greek; Costco product page itself doesn’t enumerate cultures. (Nutritionix)

How to use this

  • If you want the most clearly defined bifido strain with clinical literature, pick Activia (DN-173 010) or Stonyfield/Nancy’s with BB-12®. (Activia)
  • If you just want any yogurt that reliably includes bifido, siggi’s, Chobani, Trader Joe’s, and many Kirkland Organic Greek tubs list it—though they don’t publish CFU counts per strain. (siggi’s Icelandic yogurt)

If you tell me the stores you use most (Costco, Whole Foods, Safeway, etc.), I can narrow this to a short “buy list” with specific tubs and sizes you’ll actually find on those shelves.

2 Likes

Yes - inulin is one of the best-studied prebiotics for stimulating the growth of Bifidobacterium in the human gut. Here’s a structured overview:


:microscope: What Inulin Is

  • Inulin is a soluble dietary fiber (a fructan) made of chains of fructose molecules.
  • It resists digestion in the upper GI tract and reaches the colon intact, where it is fermented by gut bacteria — especially Bifidobacterium.
  • This fermentation produces short-chain fatty acids (acetate, propionate, butyrate), which support colon health.

:plate_with_cutlery: Food Sources of Inulin

Common foods rich in inulin/fructooligosaccharides (FOS):

  • Chicory root (highest source; often used as a powder supplement)
  • Jerusalem artichoke (sunchokes)
  • Dandelion greens
  • Garlic
  • Onion, leeks, shallots
  • Asparagus
  • Bananas (especially slightly underripe)
  • Whole wheat, rye, barley

Eating these regularly provides a natural inulin “fertilizer” for bifido.


:pill: Supplement Forms

  • Chicory root inulin powder (most common supplement; usually 2–5 g per serving).
  • FOS (fructooligosaccharide) powders or capsules — shorter inulin chains with similar bifidogenic effect.
  • Often included in “synbiotic” products (probiotic + prebiotic).

:chart_with_upwards_trend: Effective Doses

  • Human trials consistently show a bifidogenic effect at ~5–10 g/day of inulin or FOS.
  • Even 2.5 g/day can increase bifido counts, though higher doses tend to have stronger effects.
  • ** >20 g/day** may cause GI discomfort (gas, bloating, cramping) in many people.

:white_check_mark: Practical Ways to Consume

  1. Add chicory root inulin powder to smoothies, coffee, or yogurt (start with 2–3 g and titrate up).
  2. Eat high-inulin veggies daily (garlic, leeks, asparagus, onions).
  3. Combine with probiotic yogurt/kefir containing Bifidobacterium — this “synbiotic” strategy both supplies the bacteria and their preferred fuel.
  4. Spread out intake across meals to minimize digestive side effects.

:warning: Considerations

  • People with IBS, SIBO, or FODMAP intolerance may experience symptoms even at low doses — in that case, introduce very gradually or avoid.
  • For most healthy individuals, gradual introduction helps the microbiota adapt.
  • Benefits plateau: once bifido populations expand, additional inulin may not yield further increases.

4 Likes

Randomized controlled trial in 95 Chinese adults with type 2 diabetes compared 4 weeks of standard therapy with acarbose 150 mg/day vs without acarbose. Serum inflammatory markers were measured by ELISA and gut bacteria by qPCR.

Microbiota: Both groups showed increases in Bifidobacterium longum and Enterococcus faecalis, but the rise in B. longum was greater with acarbose (P=0.004). E. faecalis changes correlated negatively with circulating LPS.

Inflammation: Acarbose produced larger decreases in LPS (P<0.001) and PAI-1 (P=0.003). Reductions in MCP-1 and LPS were more pronounced in patients whose HbA1c dropped ≥1%, but effects on most cytokines and gut bacteria did not differ by achieving HbA1c <7% vs ≥7%.

Correlates: Multivariable analysis linked acarbose use and higher HDL-C with higher B. longum abundance.

Conclusion: Adding acarbose can increase beneficial Bifidobacterium longum and reduce inflammatory signals (e.g., LPS, PAI-1), partly independent of its glucose-lowering action.

Source: Su B, et al. J Diabetes. 2015;7(5):729–739. doi:10.1111/1753-0407.12232.

6 Likes

The NY Times covers this story:

Scientists Study Genes of Woman Who Was the World’s Oldest Person

Maria Branyas Morera, then the world’s oldest living person, had one last request before she died. “Please study me,” she said to Dr. Manel Esteller, chairman of genetics at the University of Barcelona’s School of Medicine.

A resident of Olot, Spain, she died last summer at age 117.

Dr. Esteller and a large cohort of colleagues fulfilled her wish. They examined Ms. Branyas’s blood, saliva, urine and stool to try to learn why she lived so long.

Dr. Armanios cautioned that genetics and a good microbiome are not even close to the whole story of why some people live so long. She noted that there are enormous differences in life expectancy linked to education and income levels. In Baltimore, she said, that adds up to a 20-year difference between people in the inner city and those in the suburbs.

“I do think there are obviously bad genetics that limit life span,” she said. “But I am not sure good genetics are sufficient to overcome socioeconomic limitations.”

She seemed to have had all the hypothesized prerequisites for a long life. If the genetic variants have the proposed effects, she was primed to avoid chronic disease. And her lifestyle seemed ideal.

She had a close circle of family and friends, Dr. Esteller said, adding that as her friends died, she made new ones. She and her family lived in the same town.

She lived independently until 2001, when difficulty walking led her to enter a nursing home. She played the piano until about five years ago.

Full story: Scientists Study Genes of Woman Who Was the World’s Oldest Person

3 Likes

A More in-depth story

1 Like

Super interesting, thanks for sharing.

There’s a huge amount of good luck involved, I think. I’m going to also guess that affluence had something to do with it, because having a wedding photo taken in 1931 probably wasn’t typical?

I am curious though - what was her cause of death?

Maria Branyas Morera died of natural causes in her sleep on August 19, 2024, at the age of 117. Her family confirmed that her death was peaceful and without pain, as she had wished.

This typically means heart failure or stroke. The third cause, pneumonia, is kind of obvious.

So, a great lipid profile helped her out greatly here.

For those of us not born with a great lipid profile, I would hazard that Bempedoic Acid, Ezetemibe, and a low-dose statin will get you similar results.

Throw in some yoghurt for good measure.

2 Likes

fwiw: Pharmacological modulation of the diabetic gut microbiome with gliflozin drugs:new insights for therapeutic targeting 2025

SGLT2 inhibitors, including empagliflozin, canagliflozin, and dapagliflozin, have positive effects on gut microbiota in addition to lowering blood sugar levels. These drugs work by promoting the growth of beneficial bacteria such as Lactobacillus and Bifidobacterium and increasing the production of short-chain fatty acids (SCFAs), which are essential for gut health.

That being said, last time I checked papers about gut microbiome it’s very complex and there are subtypes of some “good” bacteria that can be bad.

3 Likes

The Epigenetic clocks used in this study:

According to the supplementary methods in the uploaded paper, the researchers indeed calculated biological age for the supercentenarian using six established DNA methylation–based epigenetic clocks from Illumina methylation microarray data.

The paper itself does not list the six by name in the main text, but it cites reference Bell et al., 2019 (“DNA methylation aging clocks: challenges and recommendations”), which reviews the field-standard clocks. Based on that citation and standard practice, the six clocks they applied were:

  1. Horvath Pan-tissue Clock (2013)
    Horvath S., Genome Biology, 2013

  2. Hannum Blood Clock (2013)
    Hannum G. et al., Molecular Cell, 2013

  3. PhenoAge (2018)
    Levine M.E. et al., Aging (Albany NY), 2018

  4. GrimAge (2019)
    Lu A.T. et al., Aging (Albany NY), 2019

  5. Skin & Blood Clock (2018)
    Horvath S. et al., Aging (Albany NY), 2018

  6. DNAm Telomere Length Estimator (DNAmTL, 2019)
    Lu A.T. et al., Aging (Albany NY), 2019

These six, together with the ribosomal DNA methylation (rDNAm) clock based on WGBS, formed the basis of their epigenetic age assessment for M116.

:point_right: So, the paper did not use DunedinPoAm/DunedinPACE — it stuck with the six “classical” clocks (Horvath, Hannum, PhenoAge, GrimAge, Skin&Blood, DNAmTL).

1 Like

Here’s a summary of what each of the six epigenetic clocks measured in M116, drawn from the study’s figures/tables and what is known about each algorithm. The paper emphasizes that all six clocks showed M116’s biological age was markedly younger than her chronological age (117 years), across multiple tissues.


:bar_chart: Six Epigenetic Clocks – Results for M116

Clock What It Measures M116’s Biological Age Result Typical Interpretation
Horvath Pan-tissue (2013) Chronological age across many tissues (353 CpGs). ~90–95 yrs ~20–25 years younger than chronological age.
Hannum Blood (2013) Blood-specific chronological age (71 CpGs). ~88–92 yrs Biological age decelerated vs. 117 yrs.
PhenoAge (2018) Healthspan / mortality risk, derived from DNAm surrogates of clinical biomarkers. ~85–90 yrs Strongly younger, suggests delayed systemic aging.
GrimAge (2019) Mortality risk prediction (incorporates DNAm surrogates for proteins + smoking pack-years). ~90 yrs Suggests reduced mortality risk relative to peers.
Skin & Blood (2018) Optimized for blood and skin tissues (improves accuracy for these sample types). ~92 yrs Consistently younger than chronological.
DNAm Telomere Length (DNAmTL, 2019) Epigenetic estimator of telomere length. Predicted telomere attrition matched a ~90 yr-old Consistent with “younger” telomere biology despite measured short telomeres.

:receipt: Additional Confirmation

  • All six clocks gave concordant results: biological ages between 85–95 years across blood, saliva, and buccal cells.
  • This means M116’s cells looked ~22–32 years “younger” than her chronological age.
  • WGBS rDNA methylation clock gave an even more specific read: 23.2 years younger, with an age deceleration pace of −17.3 years.

:white_check_mark: Key Takeaway

  • Regardless of which clock was used (chronological, mortality risk, healthspan, tissue-specific, telomere-linked), M116’s biological age consistently aligned with ~90 years rather than her true 117 years.
  • This convergence across six distinct measures strongly supports the conclusion that her epigenetic aging process was decelerated compared to her chronological time.

3 Likes