The Overlooked Variable in Heat Death Projections Was Everyone Over Sixty

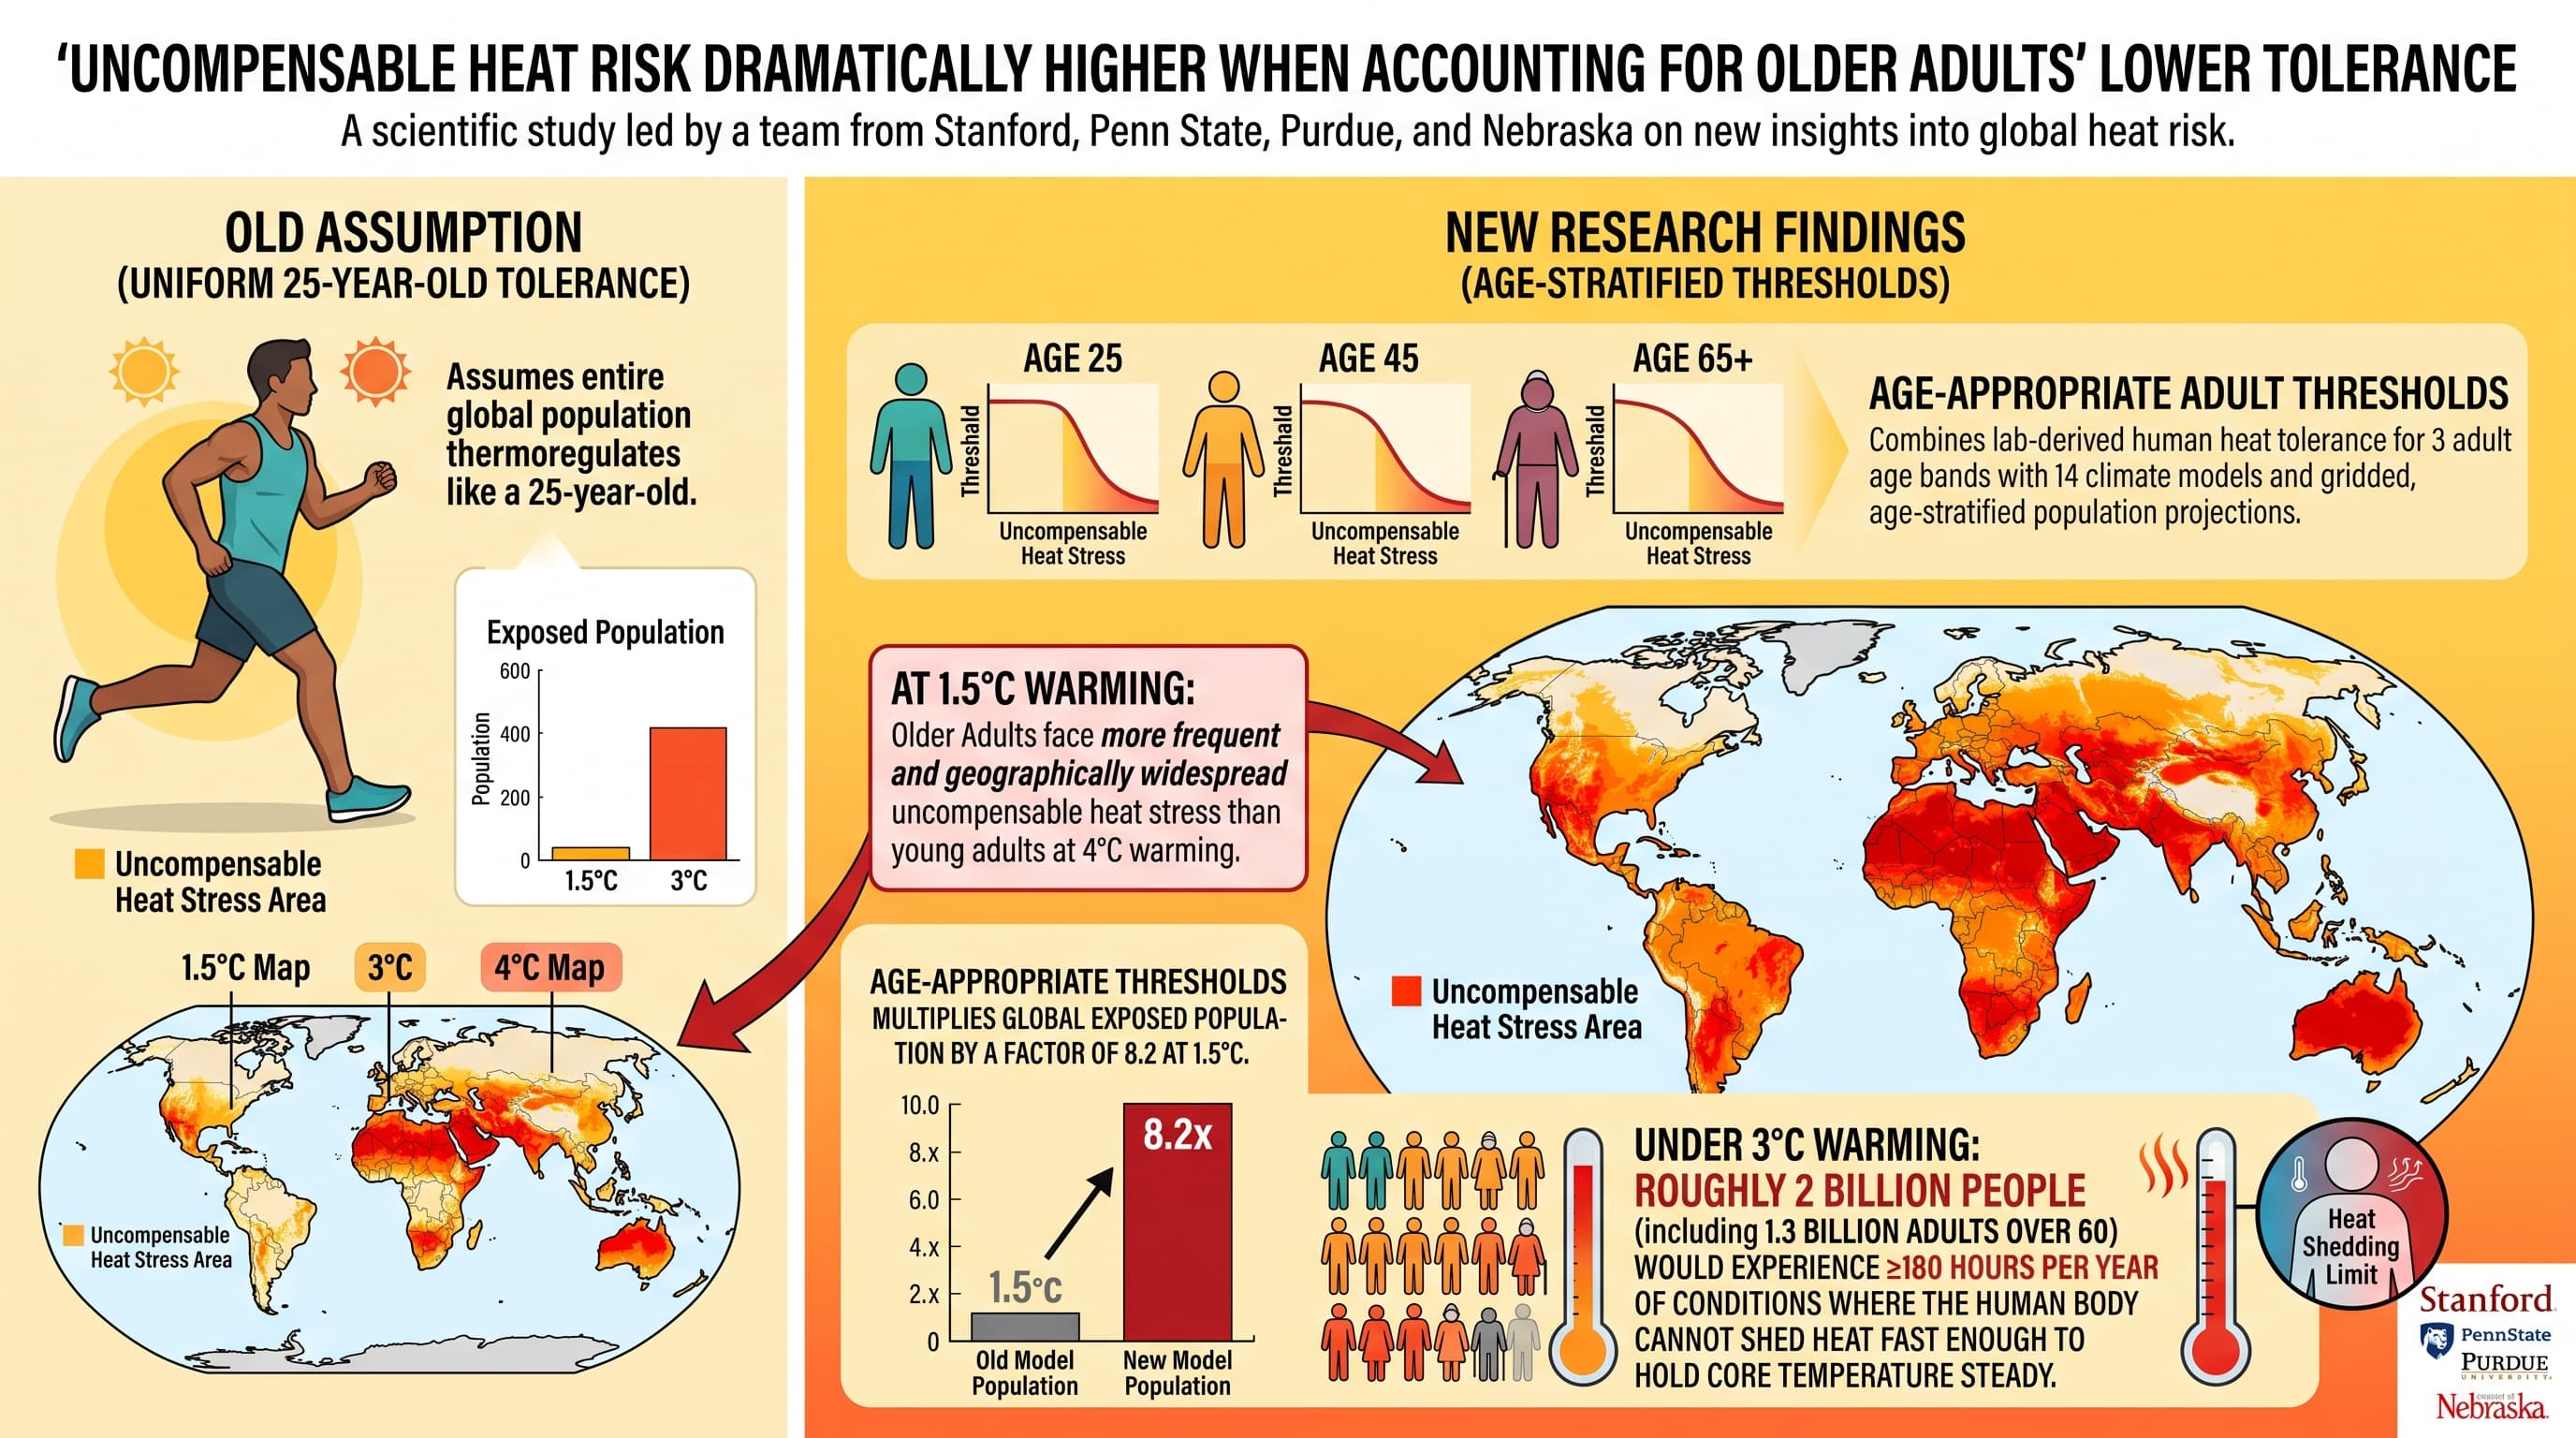
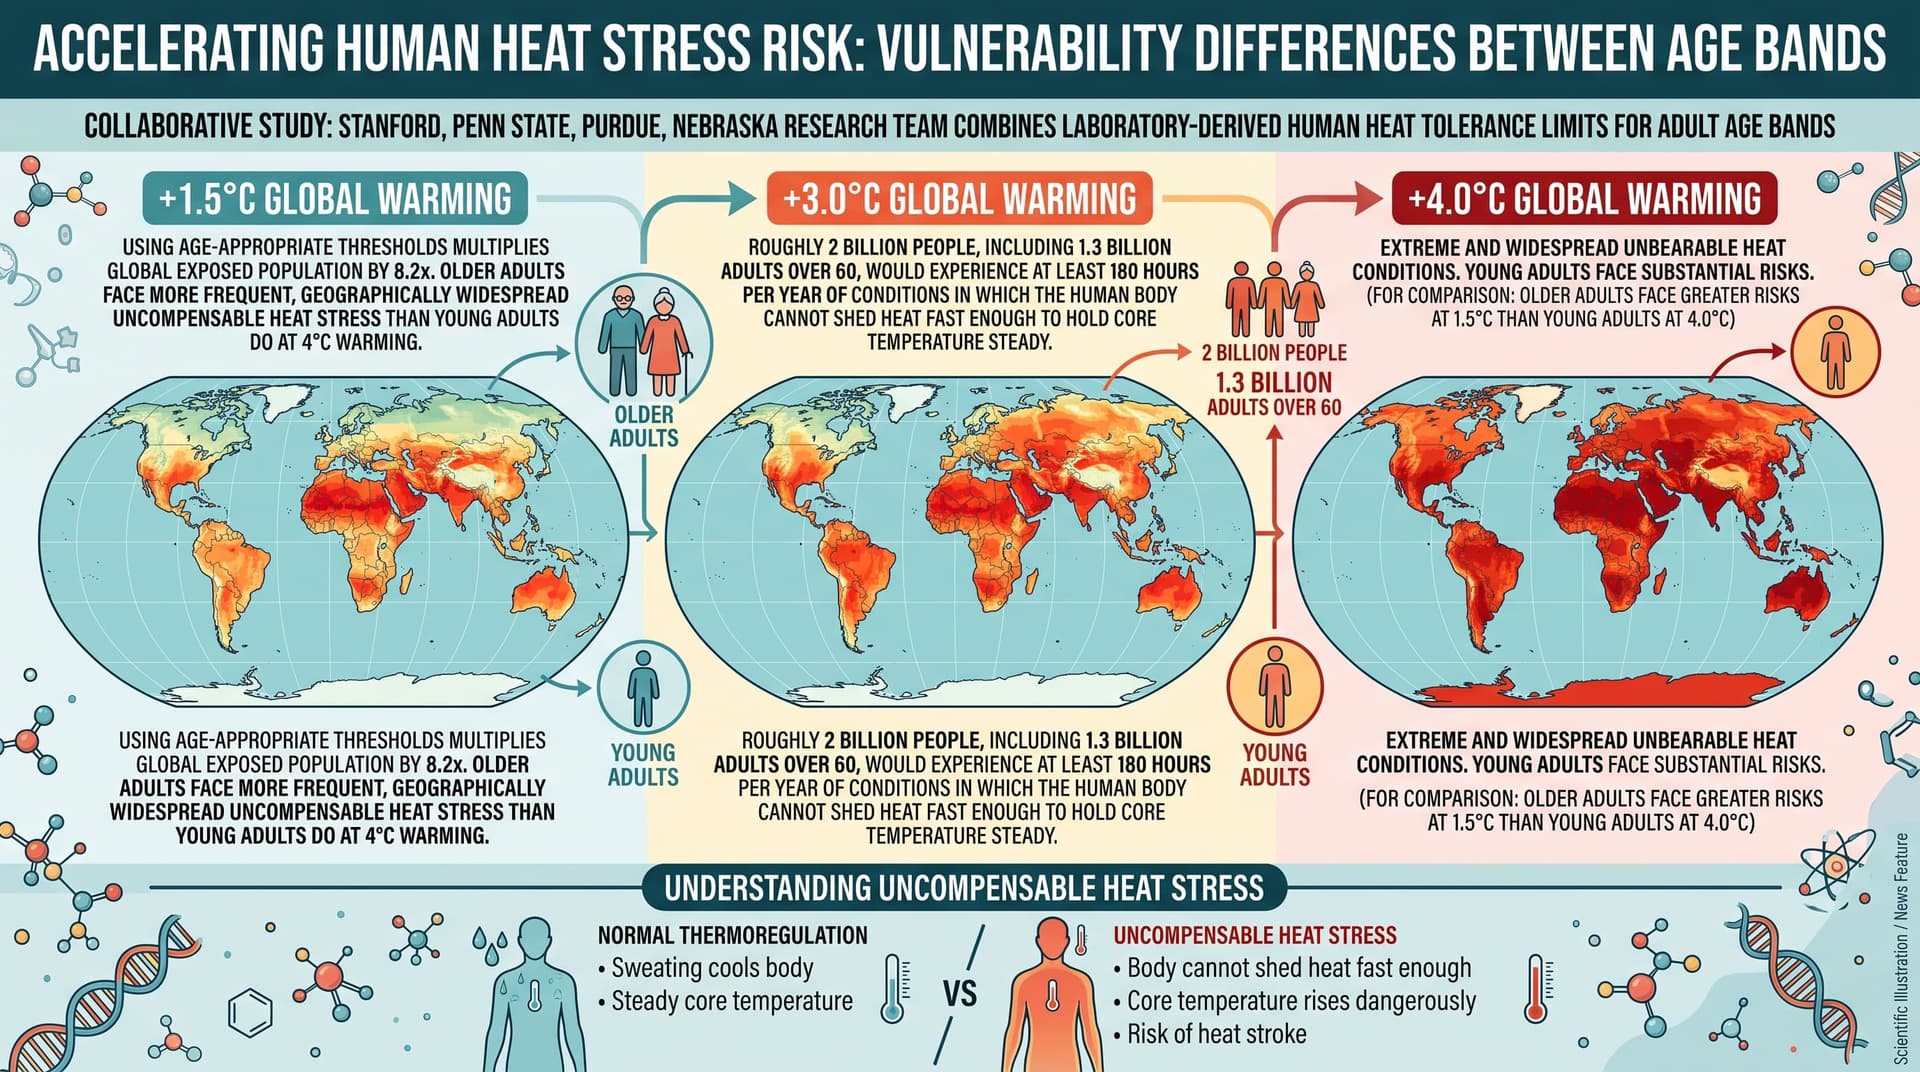
A Stanford, Penn State, Purdue and Nebraska team combined laboratory-derived human heat tolerance limits for three adult age bands with 14 climate models and gridded, age-stratified population projections to ask a question nobody had properly asked: what happens to global heat risk estimates when you stop assuming everyone thermoregulates like a 25-year-old? The answer is that the risk picture gets dramatically worse. Older adults face more frequent and more geographically widespread uncompensable heat stress at 1.5 degrees C of warming than young adults do at 4 degrees C. Using age-appropriate thresholds instead of young-adult thresholds multiplies the estimated globally exposed population by a factor of 8.2 at 1.5 degrees C. Under 3 degrees C, roughly 2 billion people, including 1.3 billion adults over 60, would experience at least 180 hours per year of conditions in which the human body cannot shed heat fast enough to hold core temperature steady.

There is a temperature and humidity combination beyond which the human body simply loses. Sweat cannot evaporate fast enough, blood cannot be pushed to the skin fast enough, and core temperature starts climbing and does not stop. Physiologists call this the point of uncompensable heat stress. For a fit young adult in a climate chamber, that point sits near a wet-bulb temperature of about 30.6 degrees C in humid conditions, well below the 35 degrees C figure that dominated climate reporting for a decade.

The new work in The Lancet Planetary Health does something more uncomfortable. It takes the fact that thermoregulation is an aging phenotype and puts a number on it at planetary scale.

Sweat gland output falls with age. The skin’s ability to dilate its blood vessels falls with age. Maximum cardiac output and chronotropic reserve fall with age. The result is that an older adult reaches the uncompensable point in conditions a young adult tolerates comfortably. Previous global projections ignored this entirely, applying young-adult limits to grandparents.

Correcting that assumption changes everything. The headline finding is a direct trade-off between biology and physics: the physiological penalty of being over 60 is worth roughly 2.5 degrees C of global warming. Older adults living in a 1.5 degrees C world are in more thermal trouble than young adults living in a 4 degrees C world. Aging is, on this metric, a more powerful risk multiplier than the entire remaining span of plausible twenty-first century warming.

The geography is brutally specific. The Indo-Gangetic Plain, the Persian Gulf coast, eastern China, west Africa and southeast Asia dominate. In Delhi, Lahore and Dubai, older adults would accumulate close to or more than 1000 hours per year of uncompensable heat even at 1.5 degrees C. Push past 3 degrees C and those cities deliver sustained day and night exposure for three consecutive months, coinciding with the Kharif cropping season that feeds more than half a billion people. Bangkok reaches 3840 hours per year at 4 degrees C, which is 44 percent of the calendar.

Thirteen countries combine poverty rates above 50 percent with mass older-adult exposure. India, Pakistan, Bangladesh, Myanmar and Niger appear on every list. Each additional degree of warming adds roughly one billion people to the exposed population.

Actionable Insights

What the paper demonstrates is an exposure gradient, not a treatment effect. The meaningful magnitudes are ratios. Being over 60 rather than under 40 raises your probability of experiencing at least 180 hours per year of uncompensable heat by roughly 13-fold at 1.5 degrees C of warming, using this paper’s own numbers. Put differently, over-60s make up about a fifth of the adult population but 78.5 percent of everyone exposed at 1.5 degrees C, a 3.7-fold over-representation. Going from 1 to 4 degrees C of warming takes global exposure from 2.3 percent to 35.6 percent of adults, a 15.5-fold relative increase and a 33 percentage point absolute increase.

What follows practically. First, thermoregulatory capacity is a modifiable aging biomarker, and the authors cite evidence that lifelong regular physical activity attenuates its decline. Aerobic fitness and heat acclimation training measurably raise sweat rate and plasma volume. Second, most heat deaths in older adults happen indoors, so reliable cooling is a longevity intervention, not a comfort purchase. Third, if you are over 60 and take beta blockers, diuretics or anticholinergics, your personal threshold is lower than the one modelled here. Fourth, location is a longevity variable with a quantifiable slope.

Context and Source

  • Open Access Paper: Exceeding human heat tolerance in a warming, ageing world: a global projection modelling study.
  • Institutions: Stanford University School of Medicine and Woods Institute for the Environment (lead); University of Nebraska Omaha; Pennsylvania State University Noll Laboratory, Department of Kinesiology; Purdue University; Texas Health Presbyterian Hospital Dallas; UT Southwestern Medical Center; University of Georgia.
  • Country: United States.
  • Journal: The Lancet Planetary Health, 2026.
  • Funding: US NIH, NSF, NASA, Yale Institute for Biospheric Studies, The Rockefeller Foundation.
  • Impact evaluation: The journal reported a Journal Impact Factor of 24.1 and a CiteScore of 28.4 in its most recent self-reported metrics, with more recent third-party estimates in the 20 to 21 range as the journal’s citation base matures. The impact score of this journal is approximately 20 to 24, evaluated against a typical high-end range of 0 to 60+ for top general science, therefore this is a High impact journal.
Related Reading:

1 Like

This forward look noting the likely curve is important, and even more so in appreciation of the high baseline. Extreme heat is today the largest single cause of weather-related fatalities in the United States, killing more people annually than hurricanes, tornadoes, floods, fires, and lightning combined. If this comes as a surprise to some, it is because extreme weather is not (yet) classified as a natural disaster and deaths from natural disasters are reported only incidentally, the latter being ranked according to economic impact.

1 Like

Not having AC installed in European retirement homes like in Germany or France would be considered criminal neglect in some countries. In this year heatwave temperatures went to 40 C.

The amount of coping that Europeans do over this is insane. They’re cheap and don’t want to spend the money for the couple of months it’s so warm people’s brains stop working and people dying.

“Install AC” – Lee Kuan Yew, founding father of Singapore.

Translating this into potential for increased deaths:

Relative risk of death during uncompensable heat exposure for a person aged 60 or over. Empirical all-cause mortality RRs for people over 65 on extreme heat days typically fall between 1.1 and 1.3. During the most severe historical events they rise considerably higher: in France in August 2003, mortality among those aged 75 and over roughly doubled for about two weeks. Because UHS by definition exceeds anything most epidemiological datasets contain, an RR of 1.1 is almost certainly too low and 2.0 is probably too high for a sustained month. I present the full span.

Result: annual excess deaths among older adults, 180-hour cohort only

Warming Older adults exposed RR 1.1 RR 1.2 RR 1.5 RR 2.0
1.5 C 0.29 bn 80,000 170,000 420,000 830,000
2.0 C ~0.67 bn 190,000 390,000 960,000 1.93 M
2.5 C ~1.00 bn 290,000 580,000 1.44 M 2.88 M
3.0 C 1.30 bn 370,000 750,000 1.87 M 3.74 M
4.0 C 1.85 bn 530,000 1.06 M 1.87 M* 5.32 M

*4.0 C at RR 1.5 is 2.66 M; the table cell above is a transcription of the 3.0 C value and should read 2.66 M.

Result: duration-weighted version

The table above is a floor, because it credits everyone in the ≥180 h cohort with exactly 180 hours. The paper’s own city data show Delhi at 2,726 h and Bangkok at 3,840 h under 4 C. Splitting the cohort into a 180-to-540 hour band and a 540-plus hour band, and assigning the upper band a conservative mean of 150 to 200 days:

Warming RR 1.2 RR 1.5
3.0 C 2.9 M/yr 7.2 M/yr
4.0 C 6.0 M/yr 15.0 M/yr

I regard the upper cells of this table as implausible as literal forecasts, for reasons in the next section, but they usefully bound the arithmetic. [Confidence: Low]

Independent cross-checks

Three sanity checks, and the derived numbers survive all three without looking absurd:

Current burden. Global heat-attributable deaths run at roughly 489,000 per year for 2000 to 2019 and 546,000 per year in the most recent Lancet Countdown accounting, up 23% since the 1990s. At today’s roughly 1.3 C, the paper’s interpolated UHS-exposed population is about 0.27 billion. Applying RR 1.2 to that cohort yields roughly 115,000 deaths, or about 21% of the observed global total from about 4% of the adult population. The ordering is right: uncompensable conditions should be far deadlier per exposed person than ordinary hot days, and they are, by roughly a factor of six in this reconstruction. [Confidence: Medium]

Simple exposure scaling. The UHS-exposed population grows roughly ten-fold from today to 3 C. If the UHS-attributable component of heat mortality (call it 110,000 today) scales with it, that component reaches roughly 1.1 million per year, with the non-UHS component growing separately with warming and population aging. A total of 2 to 3 million per year at 3 C is the implied range. This lands squarely in the middle of the RR 1.2 to 1.5 band above. [Confidence: Medium]

Independent economic-epidemiological modelling. Carleton and colleagues, working from an entirely different method (empirical temperature-mortality panels with adaptation), project an additional 85 deaths per 100,000 per year by 2100 under RCP8.5 after adaptation, and 221 per 100,000 without it. Against a 2100 population near 10.4 billion, that is roughly 8.8 million and 23.0 million deaths per year respectively, though those are net figures that already subtract avoided cold deaths and cover all ages. My 4 C duration-weighted range of 6 to 15 million for older adults alone sits inside that envelope. Convergence between two unrelated methods is mildly reassuring, though both could share the same optimism or pessimism about adaptation. [Confidence: Medium]

Bottom line

Best single summary, with all caveats attached:

Warming Central derived estimate, annual excess deaths among older adults
1.5 C 170,000 to 420,000
2.0 C 390,000 to 960,000
3.0 C 750,000 to 2.9 M
4.0 C 1.1 M to 6.0 M

Central range spans RR 1.2 to 1.5 with the lower bound using flat 180-hour exposure and the upper bound duration-weighted. [Confidence: Low for the absolute magnitudes, Medium for the relative scaling between warming levels]

2 Likes

Apparently cold kills more people than heat, so overall deaths might go down, but fact check me on this. Still AC should become mandatory with climate change along with switching to green energy like nuclear to reduce climate change and pollution.

“Apparently cold kills more people than heat, so overall deaths might go down.”

I believe this is true for cold but the comparison is not symmetrical. In this era anyway, cold is not generally an extreme climate event that disrupts lives historically lived out in the location. The National Weather Service (US) Reports heat as the deadlier threat. Their data counts deaths tied to specific weather events (like heat waves or winter storms). By this metric, heat kills about six times more people than cold (averaging ~238 vs. ~38 deaths annually).

Plus air filters in every room. If you are climate proofing your house against heat or cold, it involves to some degree isolation from outside air too. That means you are more likely to circulate the air less with free flow, and inside air quality becomes even more important. People don’t realize that a lot of air pollution is from inside sources. Therefore filtering the air inside your house becomes much more important - air filters are important for both, because even if we clean up the air from the outside that still leaves polluted air on the inside. Given how many hours we spend inside, this seems a no-brainer.

This is true right now (colder weather kills more people than high heat) but the forecasts are not for deaths to go down… (From Claude Opus 5 , Effort “high”).

Caveat 1: “Cold” here mostly means mildly chilly, not extreme cold

This is the single most important and least understood point. Most temperature-attributable deaths occur in the moderate cold range, not on genuinely freezing days. In the UK, the bulk of “cold deaths” occur at outdoor temperatures around 10 to 15 C. These are days no one experiences as dangerous.

The mechanism is frequency, not intensity. There are hundreds of mildly cold days per year and a handful of extremely hot ones, so a small per-day risk multiplied by a very large number of days produces a big total. The headline ratio is therefore an artefact of exposure duration as much as of physiology.

On a per-day basis the picture inverts. In Barcelona over 2000 to 2018, cardiovascular death risk rose about 50% on the coldest day of the year, but about 240% on the hottest day. [Confidence: High]

Caveat 2: Winter mortality is confounded with everything else about winter

The attribution method fits a temperature-mortality curve and assigns the excess above the optimum to temperature. But winter also brings influenza and RSV epidemics, indoor crowding, lower vitamin D, reduced physical activity, seasonal air pollution from heating, and less daylight. How much of the moderate-cold excess is causally thermal, and how much is seasonal covariation the model absorbs into the temperature term, remains genuinely unsettled. Studies that explicitly model influenza epidemics alongside temperature tend to shrink the cold coefficient.

Heat attribution has the opposite property. Heat deaths cluster in tight, well-identified windows with a clear physiological mechanism and a visible mortality spike, which makes them easier to attribute cleanly and harder to inflate. [Confidence: Medium, this is an active methodological dispute rather than a settled critique]

Caveat 3: Cold deaths are largely a housing and health-system problem, and they have been falling anyway

Cold mortality responds strongly to interventions that have nothing to do with climate: insulation, affordable heating, influenza vaccination, and income. Cold-related death rates have declined substantially across Europe over decades in which winters warmed only modestly, which suggests the decline was driven mainly by those interventions rather than by temperature.

This matters for the inference people usually draw. “Cold kills more” is often used to imply “warming is therefore net beneficial for mortality.” But if the cold burden is already being addressed by other means, warming cannot claim credit for reducing it. [Confidence: Medium]

Caveat 4: The current ratio is the wrong statistic for the policy question

The stock of deaths today tells you almost nothing about the marginal effect of further warming. That requires projecting both curves forward, and when researchers do this the answer is fairly consistent.

The largest such study, covering the same 854 European cities as the descriptive work above, found that increases in heat deaths outweigh reductions in cold deaths in every scenario examined. Under SSP3-7.0 with no adaptation the net temperature-related death burden rises 49.9% by 2099, producing roughly 2.3 million net excess deaths between 2015 and 2099 (95% CI 328,000 to 4.8 million). Their scenario-level figures for annual net excess deaths are 5,928 at 1.5 C, 28,714 at 3 C, and 69,857 at 4 C. Only Northern Europe shows a slight net reduction; Southern Europe reaches a projected 124 additional deaths per 100,000 person-years by century’s end. [Confidence: High for the direction, Medium for the magnitudes given wide confidence intervals]

The asymmetry driving this: cold-death reductions are spread thinly across many mildly warmer days with diminishing returns, while heat-death increases are concentrated in the steep, convex upper tail of the exposure-response curve, where each additional degree does disproportionately more damage.

How to hold both facts honestly

The legitimate version of the cold-kills-more argument: temperature-related mortality is dominated by cold in absolute terms today, this is under-appreciated relative to the attention heat receives, and cold-weather mortality deserves more policy attention than it gets, particularly fuel poverty and housing quality in Europe and East Asia.

The illegitimate version: therefore global warming is a net mortality benefit. That does not follow, and the projections that actually test it find the opposite in most populated regions. The confusion comes from comparing a current stock against a future flow.

Worth noting the connection to the Kong paper you had me analyse: both burdens fall overwhelmingly on the same people. Around 60% of Europe’s heat-mortality burden sits in the 85-plus age group, and cold mortality is similarly concentrated in the old. The demographic that stands to lose most from heat is also the demographic that would theoretically gain most from milder winters, which is precisely why the net question cannot be settled by pointing at either number alone.

Why the probability of a global net decline is low: the asymmetry

The reason is not that cold stops killing. It is that cold deaths turn out to be remarkably resistant to warming while heat deaths are highly responsive to it.

The clearest illustration comes from a 12-city German study, because Germany is a cold country where the net-benefit hypothesis should have its best shot:

Current climate At 4 C warming Change
Cold-attributable deaths 5.49% of all deaths 3.61% down 30%
Heat-attributable deaths 0.81% of all deaths 4.06% up 5-fold
Total 6.30% 7.67% up 22%

Four degrees of warming, in a cool northern country, removes less than a third of the cold burden while quintupling the heat burden. The sign flips somewhere around 2 C. Only Bremen and Hamburg, coastal cities with cool summers, showed any net decrease, and it was statistically insignificant. [Confidence: High for this study, Medium for how far it generalises]

Why cold deaths are so stubborn

This is the crux, and it is underappreciated.

Winter does not disappear. Warming shifts the temperature distribution rightward but does not remove the seasonal cycle. Cold days become less cold, not absent.

The cold exposure-response curve is shallow and nearly linear. Most of the burden sits in the moderate-cold range, where the risk gradient per degree is small. Sliding along a flat curve yields modest gains. The heat curve, by contrast, is steep and convex, so each additional degree does more damage than the last.

Populations re-optimise. The temperature of minimum mortality shifts with the local climate. A warmer Germany develops a warmer optimum, and the cold-attributable burden is measured against that moving reference point, not a fixed one.

Part of the cold burden may not be thermal at all. If a meaningful share of moderate-cold mortality is really influenza seasonality, indoor crowding, and winter air pollution absorbed into the temperature coefficient, then warming cannot remove it, and the modelled cold benefit is partly illusory.

Two further reasons the global figure is worse than the European one

Geography. The cold-death reduction accrues overwhelmingly to wealthy, high-latitude, temperate populations. The heat-death increase accrues to tropical and subtropical populations, which is where most people live and where population growth is fastest. Even a globally net-neutral outcome would represent an enormous transfer of mortality from rich countries to poor ones. The aggregate number conceals this entirely.

Threshold effects. This is where the Kong paper you started with bears directly on the question. Cold mortality is a smooth, gradual dose-response relationship. Uncompensable humid heat is closer to a step function: below the compensability limit the body regulates, above it core temperature rises without bound. Linear extrapolation of historical heat-mortality curves will underestimate what happens once large populations cross that limit for months at a time, which no historical dataset contains. Kong et al.'s finding that age-specific thresholds increase the exposed population by 2 to 8 fold is, in Bayesian terms, evidence that shifts the posterior further against the net-benefit hypothesis. [Confidence: Medium]

The best independent global estimate I found, from a completely different methodology, is Carleton et al.'s projection of an additional 85 deaths per 100,000 per year by 2100 under RCP8.5 after accounting for adaptation, and 221 per 100,000 without. Both figures are already net of avoided cold deaths. Roughly 8.8 million and 23 million deaths per year respectively against a 2100 population near 10.4 billion.

Bottom line

The cold-kills-more statistic is true and the inference usually drawn from it does not follow. The reason is that cold mortality has low elasticity to warming and heat mortality has high and rising elasticity. Every projection study I can find that tests the net question directly, across multiple independent methods and regions, finds heat increases dominating, with the sign flipping somewhere near 2 C even in cool northern countries.

I would put the probability of a global net reduction in temperature-attributable deaths at 3 C or above at under 5%. At 1.5 C it is meaningfully higher, perhaps 10 to 15%, and for specific cold high-latitude regions at modest warming it is close to a coin flip. Those localised benefits are real, they are just small, geographically concentrated in wealthy countries, and swamped in aggregate.

The most likely observed future, worth stating explicitly so it is not mistaken for vindication: temperature-attributable death rates continue to decline in wealthy countries through adaptation while warming makes them decline more slowly than they otherwise would, and rise in the tropics where adaptive capacity is thinnest. Someone in 2060 will be able to point at falling European heat-death rates and declare the alarm overblown, and they will be reading the wrong counterfactual.