Second High Dose of Rapamycin topic for results

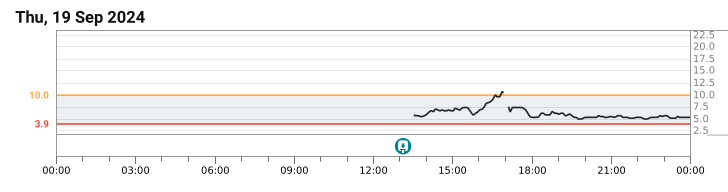
On September 23rd I took 1 packet of biocon and 2 packets of zydus with GFJ and a bit of pomegranate. The Grapefruit was half eaten a while before the rapamycin and half with the rapamycin.

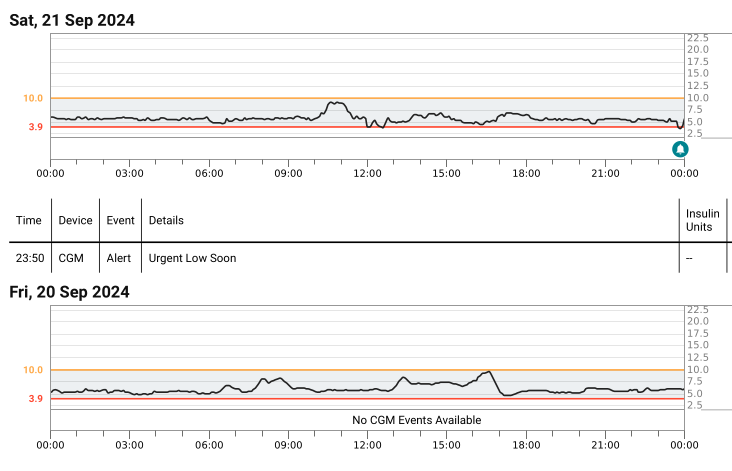
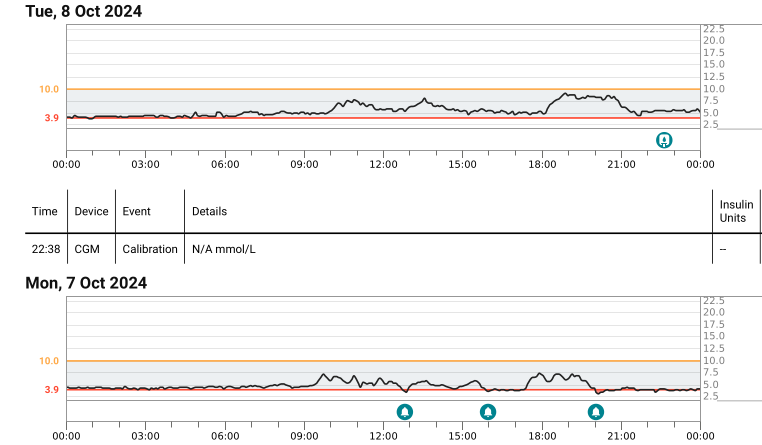
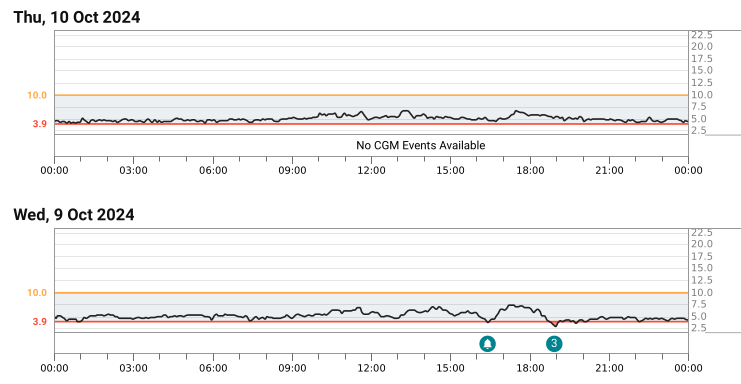
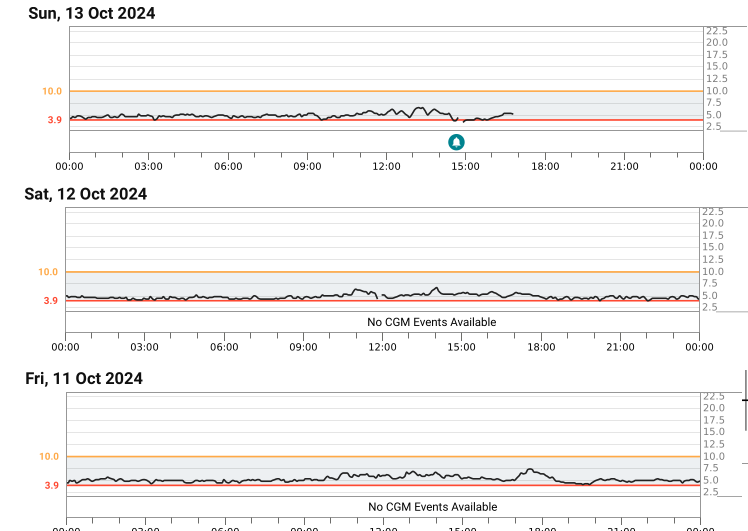
This time I had been wearing a CGM (One+) for a few days before taking the rapamycin. It fell off and I got another, I then used a third on schedule, but it stopped uploading on Sunday and that got fixed part way through Tuesday.

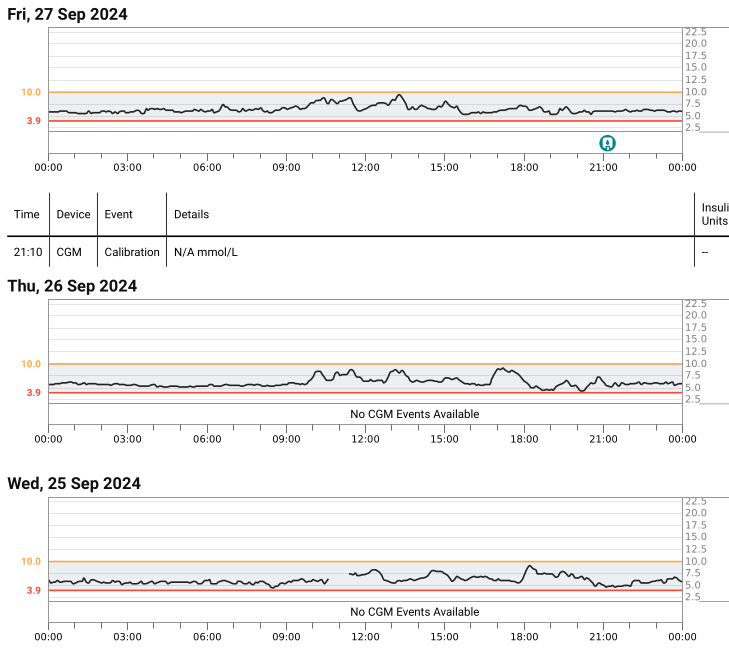
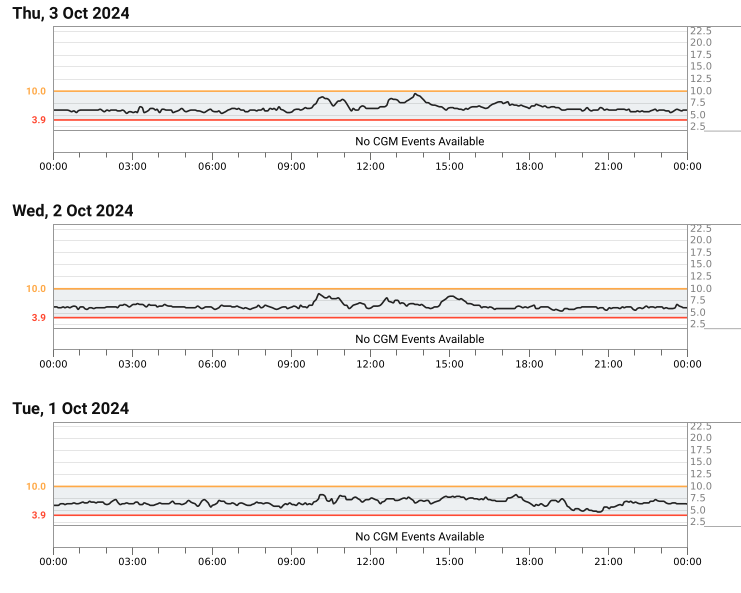
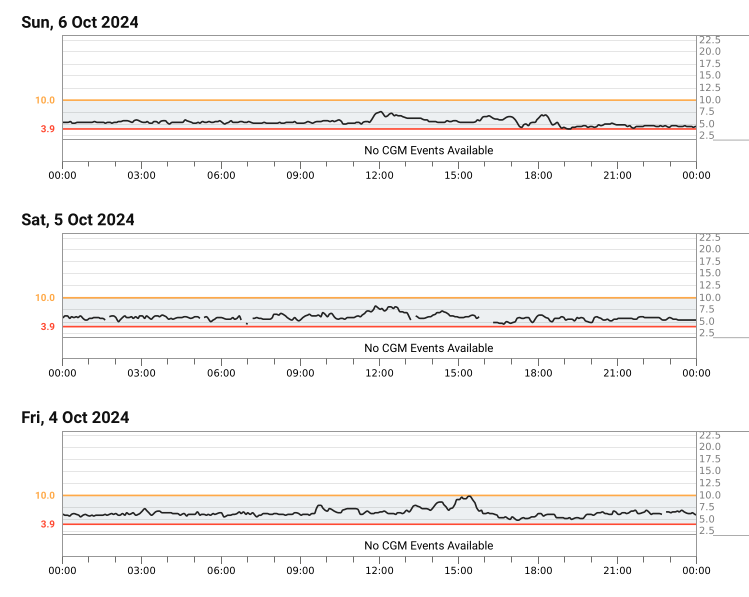
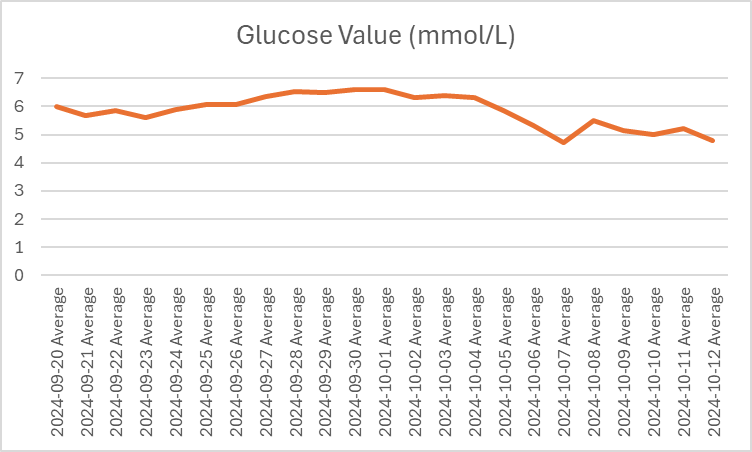
It will take some work to produce useful reports from this, but I have already done an average glucose chart. I have excluded the days with part data as they will not have useful averages. The results are skewed a bit by alcohol consumption. Alcohol takes down the average glucose. The results, however, still show a useful pattern of Rapamycin initially driving up the average glucose figure. Interestingly it appears that it is the baseline that moves up moreso than the peaks.

The body adjusts to produce more insulin, but the rapamycin fades and so at a point when the rapamycin has no immediate effect the blood glucose average goes lower.

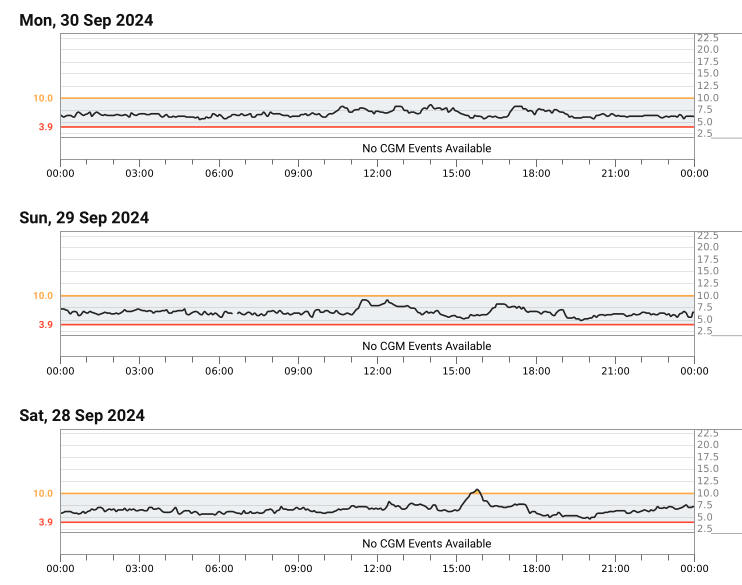
This is vulnerable to errors in sensors. I did not calibrate them as that itself could add an additional error as the fingerstick might not be right. I will tidy up the charts and upload them later, but here is the average daily glucose.

My last full day has average glucose of 4.778745645 which is about HbA1c of 4.6%. That was Saturday 12th October and I didn’t drink that day although it was affected by me drinking on the Friday which has an effect into the early morning.

7 Likes

I have used Excel to do a maximum and minimum for each day. This is not as good as looking at the charts as it suffers from the “two pints of lager and a packet of crisps” problem.

When I had two pints of lager and a packet of salt and vinegar crisps my glucose would spike. This is important because it goes above the key 8 mmol/L threshold, but for a very short time.

Still until I can do the tidying of the individual daily charts this has some merit.

Incidentally I don’t recommend two pints of lager and a packet of crisps as a longevity intervention.

Nor is this a particularly good song. But it was novel.

5 Likes

The forum software is complaining about me posting a third post and I am not sure where this goes now.

Breakfast in all of these is two pieces of bacon, some baked beans and a toasted rustic roll from the co-op. Lunch tends to be chia seeds and apple apart from when I go out for dinner. I normally have a salad for dinner, but often drink with it.

So the jump on this is crisps in the pub.

On the Friday you can see when I went to the pub and has some crisps and beer.

On the Monday I took the rapamycin at 7.20am. You can also see an early small peak from half a grapefruit. I don’t think you can see any effect from Rapamycin that quickly until perhaps around11am on the Tuesday when the baseline glucose ticks up.

I think here you can see the effect of Rapamycin increasing and the night of 26-27 having moved up quite a way. What you can also see (since rapamycin had an effec) is the development of a double jump in glucose after breakfast. I was careful not to do any exercise after breakfast although some days I had to go do to a blood draw which involves walking)

28-30 Sep are sort of on a plateau with the baseline really moved up, but peaks still not above 10 millimolar (which is 180 in mg/dL)

1 Oct is perhaps the last on the high plateau and the effect of rapamycin is fading slowly.

From 4-6 Oct you see a more rapid reduction to perhaps below where things were before rapamycin. The break on 5 Oct is a sensor running out and another being implanted.

Looking at the night of 8 October you can see glucose bumbling along at about 4mmol/L during the night.

It continues in the same vein with some data lost through a software problem.

What I think these show is
a) It takes a bit of time for Rapamycin to circulate and start inhibiting mTOR. That’s perhaps 30 hours.
b) Then you get increasing hepatic insulin resistance which drives up the minimum glucose and continues to increase even though the serum concentration of rapamcyin is fading.
c) On 4th October 12 days after taking Rapamycin the effect starts fading rapidly, probably partially from increased insulin.
d) It then settles down with actually a lower average glucose that I started out with. I expect the production of insulin to reduce and the average glucose to pick up now until I take rapamycin again, but I have stopped using the CGM. I have bought some more sessions. I am inclined to take them to ensure I am not changing sensor during the rapidly changing glucose levels as I wish to confirm when this happens. There are potentially differences between different sensors and I would like to resolve this uncertainty.
e) When rapamycin is active and even if I am not doing any exercise after breakfast (such as walking some distance) there is a double peak in glucose.

Whats new from this to me is that actually it takes quite a while to maximise the mTOR inhibition. That is not that surprising. However, it is interesting to see it in a chart. I think the baseline glucose can be taken to track hepatic insulin resistance driven by mTOR inhibition. So the baseline glucose is a proxy for mTOR inhibition.

It is also interesting that mTOR inhibition appears to perhaps move the chart up a bit, but perhaps not move the peaks up as much as the troughs.

11 Likes

The forum software is complaining about me posting a third post

I can help with that

@John_Hemming Thank you for posting this data.

I’m interested in whether you noticed any other side effects?

I have taken 8mg with GFJ before. I noticed an uncomfortable feeling when trying to get to sleep for a couple of days, like a dizziness that was somewhat ominous. It was enough to put me off larger doses. Other than that, I felt okay, and I did experience a mild euphoria a few hours after like I’ve seen others mention.

This is 22mg plus GFJ a sort of equivalent of 77mg when the GFJ is taken into account. I have a blood draw planned for today and Monday. Monday is a different lab, but when I have both today’s result and Monday’s result and last Monday I will post all the relevant blood results. The lab I am using today (Randox) has a very wide basic panel. If people are in the UK and wish to use Randox I may be able to get them a discount (I make no money out of this, but it will give me brownie points with Randox to bring them custom).

I will publish the list of tests and if people want the results for those tests as well as the ones I do publish I will do those.

I also intend to do more of an analysis of the above.

In terms of unexpected side effects. The expected ones happened, but perhaps in an unexpected way (more to be said with the blood tests).

I did have a couple of intestinal twinges which may have been related to rapamycin, but may not.

I am thinking about what to do in the future about this. I definitely will make more use of the CGM. I am not persuaded that this dose with multiplier is safe for everyone. Because of my other supplementation I have a particularly strong immune system which is why I normally have a relatively low WBC. The lab phoned me to warn me that my WBC was particularly low at under 2 billion per litre.

This could be a problem for someone without the other immune support.

I did have a spot on one of my legs, but that happens from time to time anyway. The interesting thing, however, is that the nadir in WBC is quite a while after taking the rapamycin. I need to put the results together to work out when it was (It is now in the past).

6 Likes

I now have all the blood tests I want to receive before doing an analysis. I have a court case today, but I hope to spend some time after that doing the analysis. Are there any particular blood biomarkers people would wish to see in the analysis?

1 Like

@John_Hemming id be curious about markers of inflammation: hsCRP, ferritin, fibrinogen to see if the body reacts to rapa as an inflammatory or anti-inflammatory (should be anti inflammatory with a reduction in immune system effect but might be hard to separate gut effects). Also, rapa impact on sex hormones (does a big dose of rapa show up as an energy deficit effect?). Did you lose weight after a big rapa dose?

This is very confusing to me. The blood values drop much faster than 30 hours but perhaps the effects last longer. I can confirm that the effect on my immune system is an immediate weakening (anything already present gets worse in 24 hours). New infections (pimples) don’t arrive for 3-5 days. I almost always get one pimple on my neck. I also get impressive muscle soreness in the 24 hours post dosing, which would be 48 hours post workout. Times should be read as +- 12 hours.

This is the first post with the blood data in it. I will aim to collate linked information and post that information. Rapamycin was taken on 23rd September. All of the tests were with the same lab apart from the last one which is from a different lab. Dates are in the UK format (day/month)

Biomarker 17-Sep 24-Sep 01-Oct 04-Oct 07-Oct 10-Oct 14-Oct 17-Oct 21-Oct
Red BC 4.62 4.84 5.05 4.61 4.53 4.72 4.58 4.53 4.48
White BC 2.79 2.31 2.1 1.93 1.89 1.84 1.95 2.24 2.7
Neutrophils 1.68 1.09 1.09 1.02 0.97 0.89 0.81 1.08 1.6
Lymphoc 0.81 0.94 0.76 0.69 0.67 0.7 0.80 0.82 0.7
29.03% 40.69% 36.19% 35.75% 35.45% 38.04% 41.03% 36.61% 25.93%
Monocytes 0.28 0.26 0.22 0.19 0.23 0.22 0.31 0.31 0.2
Eosinophils 0 0 0 0 0 0 0 0 0
Basophils 0.02 0.02 0.03 0.03 0.02 0.03 0.03 0.03 0
Platelets 156 173 143 122 146 156 161 162 150

What I find interesting about this is that it appears that rapamycin affects the creation of all of the cells with material numbers. I am normally leukopenic and with a high level of mTOR inhibition my lab was phoning me up to tell me I was even more leukopenic.

With Rapamycin taken on 23rd September, the lowest level of WCC was probably around 10 October, the lowest level of platelets was more like 4 October and the measuring of red cell creation is probably not precise enough to tell although it does look like rapamycin had an effect. It looks like most of the effect was on Neutrophils.

Edit 11/11/24

It has been pointed out to me that the half life of neutrophils is a lot shorter than lymphcytes and other WBCs. There a conflicting answers online as to exactly how short, but that would explain the more rapid change in neutrophil numbers.

2 Likes

@John_Hemming Thanks. Very interesting. A long effect indeed. How do you control for hydration for your blood tests?

1 Like

Thats a good point. I don’t have perfect control on this and that adds a bit more uncertainty. My objective is to have the blood draw at the same time each day (it varies by a few minutes) with me having eaten and drunk roughly the same amount of food/drink (tea etc). I accept, however, that this is vulnerable to variations as to the amount of water in circulation at the time. I don’t know what effect this could have, but one would assume it is the same to each of the biomarkers.

1 Like

This is to look at inflammation

Biomarker 17-Sep 24-Sep 01-Oct 04-Oct 07-Oct 10-Oct 14-Oct 17-Oct 21-Oct
CRP <0.3 <0.3 <0.3 <0.3 <0.3 <0.3 <0.3 <0.3 0.753 mg/L
Ferritin 24.22 52.63 39.92 38.59 36.08 35.83 33.15 28.84 34.3 mcg/L
C4 0.138 0.124 0.129 0.118 0.131 0.127 0.121 0.121 - g/l
IgA 1.979 2.461 2.132 1.976 2.408 2.203 2.526 2.085 - g/l
Urate 305.4 347.9 279.2 287.1 313.1 359.7 242.3 302.2 349 mcmol/L

I don’t really read anything into this from the inflammation point of view. It looks like I had some form of infection over the weekend, but I don’t know what that was.

1 Like

Here is glucose and lipids. Remember these are non-fasting results.

Biomarker 17-Sep 24-Sep 01-Oct 04-Oct 07-Oct 10-Oct 14-Oct 17-Oct 21-Oct
HbA1c 34 34.41 34.08 31.8 34.76 34.07 29.63 29.41 30 mmol/L
Insulin 262.6 91.8 178.2 292.8 241.3 225.3 212.4 146.8 pmol/L
Cholest. 5.9 6.01 6.58 5.96 5.38 5.85 5.48 5.43 5.66 mmol/L
LDL 3.14 3.54 4.1 3.41 3.09 3.09 3.09 2.84 3 mmol/L
HDL 1.65 1.82 1.88 1.66 1.63 1.87 1.83 1.63 1.81 mmol/L
LP(a) 7.2 7.4 9.1 8.9 <5.2 <5.2 6.6 <5.2 - nmol/L
ApoB 96 96 96 84 93 100 92 97 - mg/dl
Trig 2.37 1.73 2.09 2.07 2.25 2.38 1.47 1.39 1.86 mmol/L

HbA1c is a bit of an odd thing as the glycation of Haemoglobin is initially reversible and then becomes much less reversible. Hence it does not really give a strict average of glucose. The charts up topic are much better for seeing what is happening with glucose.

I think it is particularly significant that it goes up initially, but really with a movement of the baseline, the body then turns up insulin such that you get an overswing and the body removes glucose more quickly. I think in the final insulin figure you can see movement towards correcting this.

Interestingly the cholesterol things seem to happen really coincidental with mTOR inhibition. LP(a) goes up for a bit then back down. LDL-C seems to follow this although ApoB seems to not really follow any pattern it may be testing variation.

Looking at my historic Lp(a) records the top two values over the past year (I did not always use the lab that measures this) were the two in this post. Hence it seems that there is a causal link here.

I have extracted the list of tests from the reports

Haemoglobin, Haematocrit, Mean Cell Haemoglobin (MCH), “Mean Cell Haemoglobin Concentration (MCHC)”, “Red Blood Cell Mean Cell Volume (MCV)”, Red Blood Cell Count, Basophil Count, Eosinophil Count, Lymphocyte Count, Monocyte Count, Neutrophil Count, White Blood Cell Count, Full Blood Count, Platelet Count, Iron, Ferritin, “Total Iron Binding Capacity (TIBC)”, Transferrin, Transferrin Saturation, Total Cholesterol, LDL Cholesterol, HDL Cholesterol, Total Cholesterol / HDL Cholesterol Ratio, Triglycerides, Apolipoprotein A-I, Apolipoprotein B, Apolipoprotein B / A-I Ratio, Apolipoprotein CIII, Small LDL Cholesterol, Lipoprotein (a), “High Sensitivity C-Reactive Protein (hsCRP)”, Creatine Kinase, Fatty Acid Binding Protein-3 (FABP-3), Glucose, HbA1c, Insulin, C-peptide, Glucose, HDL Cholesterol, Triglycerides, HbA1c, Insulin, C-peptide, Leptin, Resistin, “High Sensitivity C-Reactive Protein (hsCRP)”, Creatinine, “Estimated Glomerular Filtration Rate (eGFR)”, Cystatin C, Calcium (adjusted), Chloride, Magnesium, Phosphate, Potassium, Sodium, Urea, Uric Acid, Alanine Aminotransferase (ALT), Alkaline Phosphatase (ALP), “Aspartate Aminotransferase (AST)”, “Gamma-Glutamyltransferase (GGT)”, Total Bilirubin, Albumin, Ferritin, Pancreatic Amylase, Lipase, H. pylori, “Anti-Tissue Transglutaminase Antibodies (Coeliac Disease)”, Total Antioxidant Status (TAS), Albumin, Calcium (adjusted), Magnesium, Iron, Folic acid, Vitamin B12, Vitamin D, Creatine Kinase, Uric Acid, Rheumatoid Factor (RF), Alkaline Phosphatase (ALP), Calcium (adjusted), Phosphate, Vitamin D,Parathyroid Hormone (PTH), Allergy Evaluation, Immunoglobulin E (IgE), C-Reactive Protein (CRP), Rheumatoid Factor (RF), Complement Component 3 (C3), Complement Component 4 (C4), Immunoglobulin A (IgA), Immunoglobulin G (IgG), Immunoglobulin M (IgM), Antistreptolysin O (ASO), “Thyroid Stimulating Hormone, (TSH)”,Follicle Stimulating Hormone, Luteinising Hormone, Prolactin, “Thyroid Stimulating Hormone (TSH)”, Free Thyroxine (FT4), Free Tri-iodothyronine (FT3), “Anti-Thyroglobulin Antibody (Anti-Tg)”,“Anti-Thyroid Peroxidase Antibody (Anti-TPO)”, “Total Prostate Specific Antigen (TPSA)”, Follicle Stimulating Hormone, Oestradiol,Luteinising Hormone, Prolactin,Testosterone,Sex Hormone Binding Globulin, Free Testosterone

In retrospect I think each high dose probably slightly improved kidney function although this is hard to tell given everything else that is happening, but a new recent minimum of creatinine was achieved. Also I think further follicular development occurred. Hence I have decided to take a similar dose (22mg plus GF), but without doing as many blood tests or running a CGM all the time. I will aim to run a CGM for the period when the average rapidly reduces.

Have you tested cystatin-c for kidney function? Creatinine is far too unspecific of a marker of kidney function in people with healthy kidney function so any mild changes in it could be from a number of factors other than changes in kidney health.

Cystatin-C has some other issues which I am trying to bottom out. I did get it down to 0.67, but it is over 1 at the moment.

What I am not clear on is the timescales during which these things turn over, but I have enough records to read into the values sufficient information.

I’m not aware of any partiuclar issues with Cystatin-C but everything has downsides. Have you found any specific issues with it so far?

I have not come to any conclusions. It is not currently my priority for testing.

1 Like