Early Life Stress Pushes Biological Age Up 38 Percent Before Any Sign of Illness

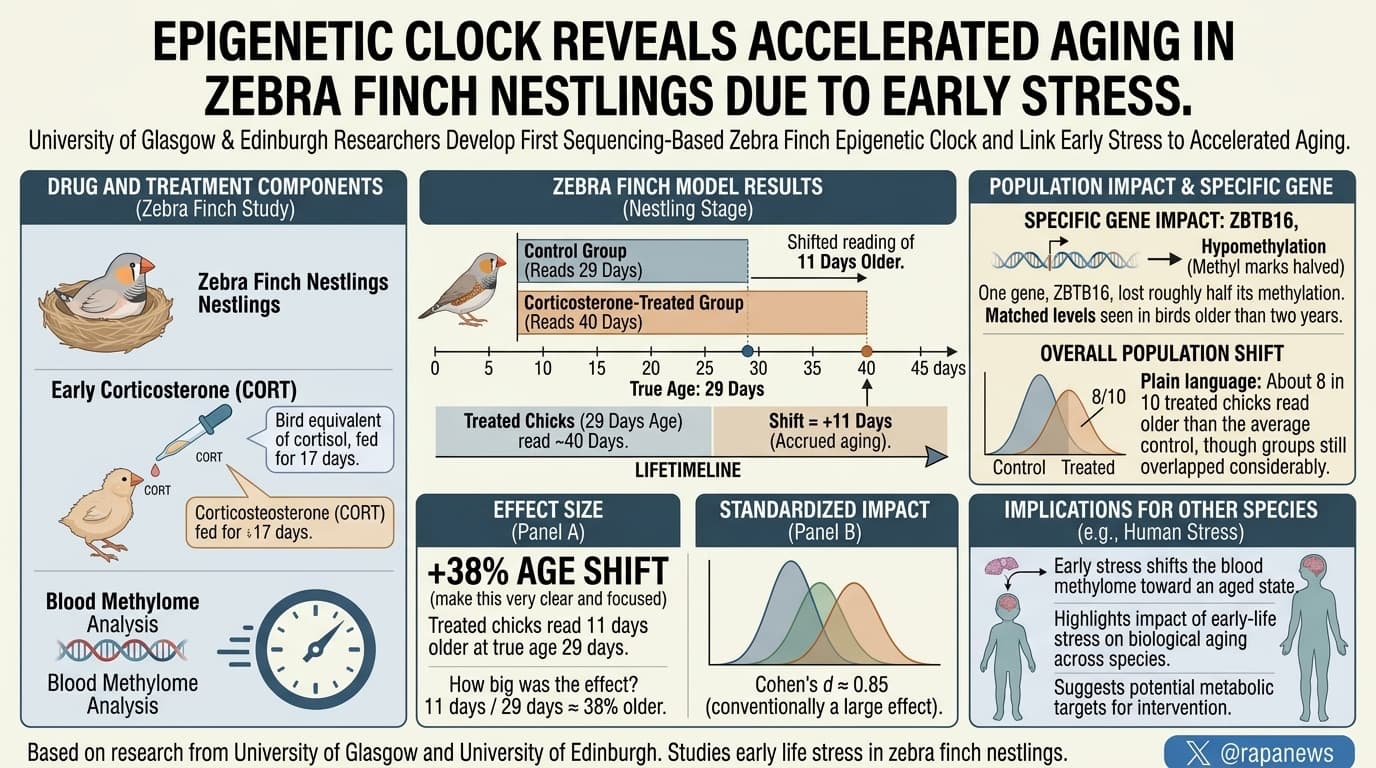
Researchers in Glasgow and Edinburgh built the first sequencing-based epigenetic clock for the zebra finch and applied it to nestlings fed corticosterone, the bird equivalent of cortisol (the stress hormone), for 17 days. Treated chicks read about 11 days older than controls at a true age of 29 days. One gene, ZBTB16, lost roughly half its methylation and matched levels seen in birds older than two years. The authors argue that early stress shifts the blood methylome toward an aged state through metabolic pathways tied to longevity.

Hard early lives tend to be shorter lives. That pattern shows up in humans, baboons, deer and birds, but nobody has pinned down the mechanism. Human studies cannot separate childhood stress from poverty, diet and genetics. Experiments on newborn rodents are awkward because the pups cannot be handled without disturbing the mother.

Zebra finches get around this. Chicks develop in the nest after hatching, so researchers can dose them directly. Earlier work from the same Glasgow group reported that chicks given extra corticosterone became more stress-reactive adults and died about 30 percent sooner. The new preprint asks what that hormone does to the DNA within days of exposure.

The team first needed a way to measure biological age. They sequenced DNA methylation, the chemical tags that change predictably with age, in red blood cells from birds aged one day to more than nine years. From over 2,000 candidate models they chose a clock that predicted age to within 80 days on average in birds it had not seen, and to within 8 days in young chicks.

Then came the experiment. Forty-eight chicks received corticosterone in peanut oil twice daily from day 12 to day 28. Forty-eight controls got oil alone. At about 29 days old, the treated birds read 11 days older on the clock.

The more striking result involved ZBTB16, a gene switched on by stress hormones in mammals, birds and fish. Its methylation fell by 30 percentage points in treated chicks, landing at levels normally seen only in birds past two years old. Unlike another stress gene, FKBP5, it showed no sign of recovering over the four days after dosing stopped. The authors suggest ZBTB16 acts as a molecular memory of stress that keeps metabolism in survival mode and, over years, wears the body down.

Three cautions apply. First, nobody followed these particular birds to see how long they lived, so the link between the methylation shift and early death is borrowed from older studies. Second, the claim that stressed chicks resemble six-month-old birds comes from 111 DNA sites chosen partly because they sat in regions that already responded to the hormone, which tilts the comparison. Across all 5,129 age-related sites, treated chicks moved in the aging direction only about half the time. Third, the genes involved are classic direct targets of stress hormones, and blood was drawn one to four days after the last dose. What looks like accelerated aging may partly be the ordinary short-term footprint of a steroid.

Actionable Insights

This paper tests a harm, not a treatment. The useful lessons are indirect.

How big was the effect? Treated chicks read 11 days older at 29 days of age, about 38 percent of their actual age. In standardized terms that is a Cohen’s d of roughly 0.85, conventionally a large effect. In plain language, about 8 in 10 treated chicks read older than the average control, though the two groups still overlapped considerably. Treatment and the other measured factors explained only about 15 percent of the variation between birds. Which nest a chick came from mattered more.

Practical points:

  • The findings support taking chronic stress in children seriously, but they do not quantify human risk.

Context and Source

Related Reading:

Childhood Adversity’s Bill Comes Due by 19, and Some Adversities Cost More Than Others

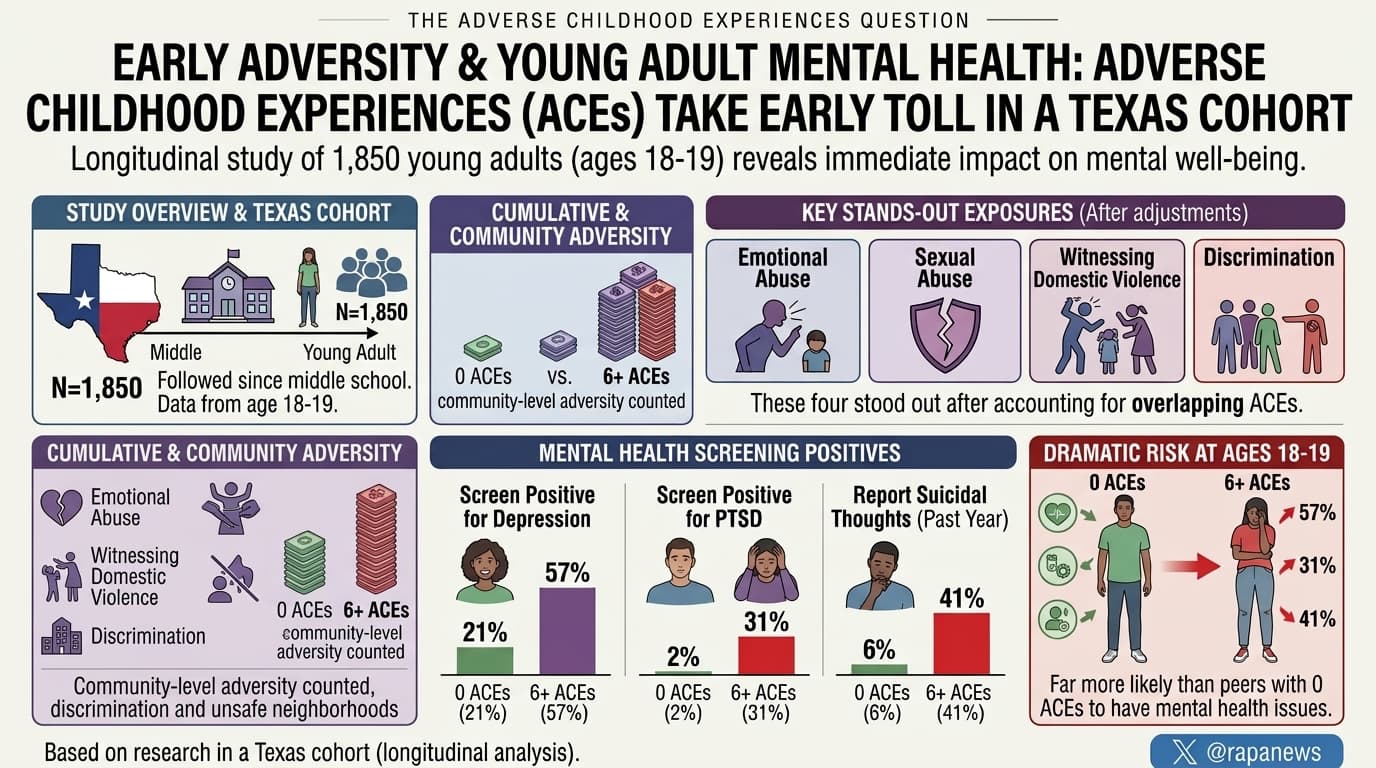
A Texas cohort of 1,850 young adults, followed since middle school, shows that the mental health and behavioral toll of adverse childhood experiences (ACEs) is already large at ages 18 to 19. Compared with peers reporting no ACEs, those reporting six or more were far more likely to screen positive for depression (57% vs 21%), screen positive for PTSD (31% vs 2%), and report suicidal thoughts in the past year (41% vs 6%). The study also counted community-level adversity such as discrimination and unsafe neighborhoods. Four exposures stood out after accounting for overlap: emotional abuse, sexual abuse, witnessing domestic violence, and discrimination.

Most of what we know about adverse childhood experiences comes from asking middle-aged adults to recall events from decades earlier. A team at UTHealth Houston took a shorter route. They followed young people recruited from southeast Texas middle schools in 2018 and surveyed them again at about ages 18 and 19. The damage was already measurable.

The gradient is steep. About one in five participants with no ACEs screened positive for depression. Among those with six or more, it was more than one in two. Positive PTSD screens rose from 2% to 31%. Past-year suicidal thoughts rose from 6% to 41%, and lifetime suicide attempts from 4.5% to 37%. Marijuana use more than tripled, from 11% to 39%. Use of harder drugs went from almost nonexistent (one person in 337) to 11%. The share reporting an A or B average in high school fell from 93.5% to 72.5%, and college enrollment from 55% to 33%.

Adversity was also the norm in this sample. Only 18.5% reported none, and a third reported four or more. The researchers used the Philadelphia ACE survey, which adds community-level items to the usual list of abuse and household dysfunction. Those added items were the most commonly endorsed: 45% reported adverse neighborhood experiences and 38% reported discrimination.

The paper’s main new contribution comes from putting all 14 adversity types into one statistical model, to see which still matter once the others are accounted for. Most faded. Physical abuse, household substance use and incarceration of a family member, all strongly linked to bad outcomes on their own, lost significance. The ones that survived were:

  • Emotional abuse, which roughly doubled the odds of depression.
  • Sexual abuse, which more than doubled the odds of PTSD.
  • Witnessing domestic violence, which doubled the odds of perpetrating dating violence.
  • Discrimination, the only item linked to all four outcomes tested.

Neglect showed no independent link to anything, a result that probably says more about the questionnaire than about neglect.

The caveats are substantial. Participants reported their childhood adversity a year after the outcomes were measured, and people who are depressed tend to recall more adversity. The outcomes are screening questionnaires, not diagnoses. A third of the original cohort was not in the analysis. The design cannot show that adversity caused the outcomes, and family-level factors such as inherited risk for mood disorders were not measured.

For a longevity audience, the relevance is indirect. The study measured no blood markers, no biological age and no physical disease. But earlier research links high ACE counts to heart disease, cancer and earlier death in midlife. This paper suggests the behavioral and psychiatric precursors of that risk (depression, substance use, violence, curtailed education) are in place before age 20. If the associations are even partly causal, the window for changing that trajectory opens early.

Actionable Insights

This is a risk-mapping study, not an intervention trial. Nothing here was tested as a treatment, so the practical lessons are about awareness and screening.

  1. An ACE count is a useful risk flag. For every 100 young adults with six or more ACEs, about 36 more screened positive for depression than among 100 with none (57 vs 21). That is a risk about 2.7 times higher.
  2. The gap for suicidal thinking is similar in size: 41 per 100 vs 6 per 100, about 7 times higher. A history of heavy adversity is a reason to screen early for depression and PTSD, both of which are treatable.
  3. Low counts still matter. With one to three ACEs, depression screens rose from 21% to 36%, a gap of 15 per 100.
  4. Emotional abuse deserves the same weight as physical abuse. It was the strongest independent correlate of depression, with roughly double the odds.
  5. For parents and clinicians, the exposures most worth preventing or asking about are emotional abuse, sexual abuse, violence between adults at home, and discrimination.
  6. Do not read the neglect result as reassurance. It is likely a measurement artifact.

Context and Source

  • Open Access Paper: Childhood Adversity and Health in Emerging Adulthood
  • Institution: University of Texas Health Science Center at Houston (UTHealth Houston), School of Behavioral Health Sciences
  • Country: United States
  • Journal: JAMA Network Open, 2026;9(9):e2635834, published September 24, 2026
    Impact evaluation: The impact score of this journal is 11.7 (2025 Journal Impact Factor, from the June 2026 Journal Citation Reports release), evaluated against a typical high-end range of 0 to 60+ for top general medical journals, therefore this is a High impact journal.

Biomarker Data (Effect Size Extraction)

The paper reports odds ratios (ORs). An OR compares the odds of an outcome between two groups, and when an outcome is common it looks larger than the plain ratio of risks. For depression, the adjusted OR is 4.53, but the risk is 2.7 times higher, not 4.5 times. The table below therefore shows three things: the absolute gap in percentage points (the most intuitive measure), the crude risk ratio, and the paper’s adjusted OR. The last column converts the OR to an approximate Cohen’s d, where 0.2 is conventionally small, 0.5 medium and 0.8 large. I calculated the gaps, risk ratios and d values from the paper’s Tables 2 and 3; they are not reported by the authors.

Six or more ACEs vs zero ACEs:

Outcome 0 ACEs 6+ ACEs Absolute gap Risk ratio Adjusted OR (95% CI) Approx. d
Depression screen 21.0% 56.9% 35.9 points 2.7 4.53 (3.06 to 6.70) 0.83
PTSD screen 2.1% 30.9% 28.8 points 14.7 16.58 (7.31 to 37.61) 1.55
Suicidal ideation, past year 6.0% 41.4% 35.4 points 6.9 9.71 (5.56 to 16.99) 1.25
Suicide attempt, lifetime 4.5% 37.2% 32.7 points 8.3 9.04 (4.95 to 16.51) 1.21
Sexual assault, lifetime 2.4% 27.6% 25.2 points 11.5 13.18 (5.98 to 29.02) 1.42
Physical dating violence, experienced 2.7% 14.9% 12.2 points 5.5 4.45 (2.05 to 9.68) 0.82
Physical fight 2.4% 19.2% 16.8 points 8.0 7.47 (3.39 to 16.47) 1.11
Marijuana use 11.1% 39.2% 28.1 points 3.5 4.00 (2.56 to 6.24) 0.76
Binge drinking 6.0% 17.1% 11.1 points 2.9 2.79 (1.55 to 5.02) 0.57
Illicit substance use 0.3% 10.8% 10.5 points 36 27.83 (3.70 to 209.31) not meaningful
A or B average in high school 93.5% 72.5% minus 21.0 points 0.78 0.29 (0.17 to 0.49) 0.68
Enrolled in 4-year college 55.2% 33.2% minus 22.0 points 0.60 0.62 (0.42 to 0.93) 0.26
Graduated high school 94.4% 86.6% minus 7.8 points 0.92 0.59 (0.32 to 1.11) not significant

Points on reading these numbers:

  • Mental health effects are large by any convention. d values of 0.8 to 1.5 are rare in observational epidemiology. [Confidence: High that the associations are large; Low that the full magnitude is causal]
  • The gradient starts low. With 1 to 3 ACEs, depression rises by 15 points (OR 2.13, d about 0.42) and suicidal ideation by 13 points (OR 3.73).
  • The illicit drug OR of 27.83 rests on a single user in the reference group. Its confidence interval spans 3.7 to 209, so the true size is essentially unknown.
  • College enrollment shows a 22-point crude gap, but the adjusted effect is small (d about 0.26). Sociodemographics and school clustering explain much of the raw difference.
  • If the depression association were fully causal, about 45% of positive depression screens in this cohort would be attributable to ACEs (overall rate 37.9% vs 21.0% with none). Treat this as an upper bound. [Confidence: Low]

Domain-specific effects, with all 14 domains in one model:

ACE domain Outcome Adjusted OR (95% CI) Approx. d
Emotional abuse Depression 2.17 (1.65 to 2.86) 0.43
Mental illness in household Depression 1.55 (1.18 to 2.02) 0.24
Sexual abuse PTSD 2.37 (1.56 to 3.60) 0.48
Discrimination PTSD 1.75 (1.23 to 2.49) 0.31
Witnessing domestic violence Dating violence perpetration 1.99 (1.22 to 3.24) 0.38
Foster care Dating violence perpetration 2.32 (1.17 to 4.60) 0.46
Physical neglect Depression 0.62 (0.42 to 0.91) minus 0.26