If you dont track calories and if you dont feel hunger on a regular basis, than you are not in a calorie deficit. You might be one day but compensate the other and so on.
Humans are really good at underestimating their calorie intake by at least 20% (at best).
I was working on a website which does automatic calculation between different units and then feeds data into various algorithms. I have had to move on from this to other things for a while, but I will come back to it. However, if anyone wants to experiment with it this is the link:
What I want to do is to provide a database of research and indications as to what the different biomarkers mean, but that is quite a big task and I am quite busy with other things at the moment.
However, it should help with unit conversion.
Looking at this I need to change its TITLE, but that will have to wait for now.
I have decided to put a bit more effort in on this website. I want to link each biomarker to really good sources of information and enable reliable site users to add links as well. Its complicated because quite a bit of research data is multidimensional as well as varying in ranges and categories.
John, you can make a new post a “Wiki” in which case anyone can edit and add links. See this example here - anyone can click on the “Edit” button at the bottom of the post and add information at any time. Does this work for you? Rapamycin (& Other Longevity Drug) Pricing Quotes Wiki
Its more complicated if the idea is that someone provides some values as to their biomarkers and then they are charted together with research information so that people know where their biomarker lies in terms of health/age equivalent.
Eg is my HRV low or high for someone of my age/sex/bmi etc and is that better for health or worse.
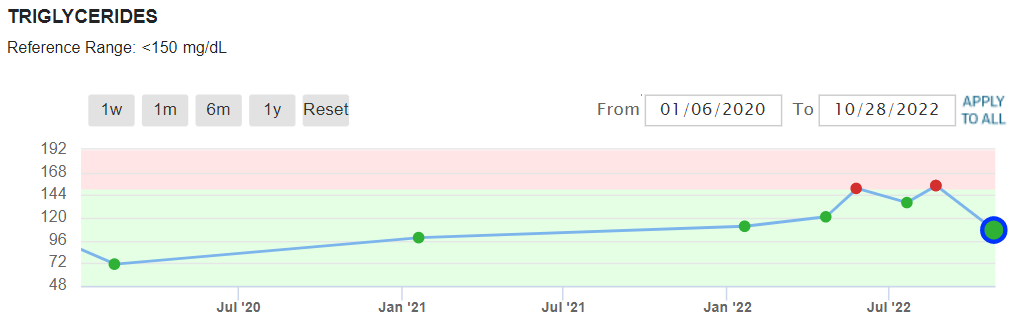
Yes, I started taking rapamycin. The 80 mg/dL was the last test taken before I started on rapamycin. Since starting rapamycin my Levine score continually got worse until this last test. Hopefully, it will continue to improve. I actually remember reading a paper where it mentioned long-term dosing in mice where triglycerides got worse and then returned to normal. That wasn’t what the paper was about so I am not sure I can find it again.
Three other things improved that are not on the Levine spreadsheet, HDL higher, triglycerides lower ( back into the “normal” range), and eGFR increased.
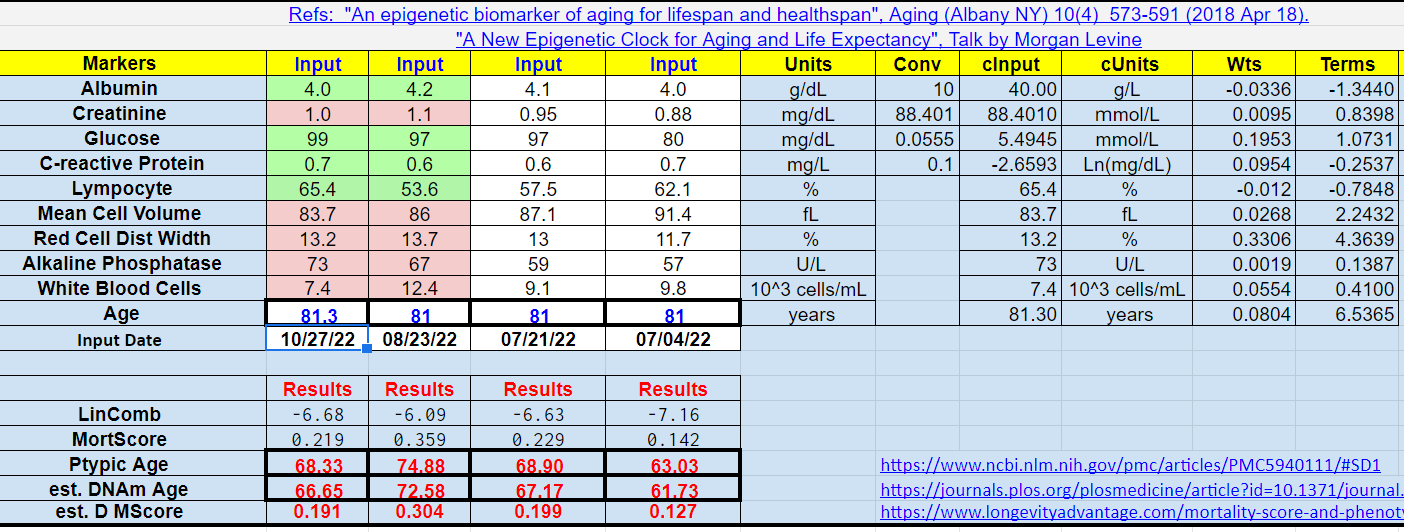
Semi tangent about the Levine clock… one of the variables is literal chronological age. Is the clock essentially hard-coding a certain amount of aging based on chronological age regardless of the measurements?
The calculator multiples a weight of 0.0804 to the chronological age and that number is used for further calculation.
You can see the weight for each biomarker in the row “Wts” and the product of biomarker and weight in the row “Terms.” So the chonological age is treated just like the other biomarkers with its own weight (0.0804). The “Terms” are then added together plus a constant “b0” to derive “LinComb.” “LinComb” is then used to calculate “MortScore” (the probability of death in the next 10 years). “MortScore” is then converted to “Ptypic Age.”
Basil, you may not be absorbing any rapa and those numbers are within statistical testing ranges blood and or testing equipment, so to me show no effect.
Find my post in the rapa aborbtion thread on how to boost absorbtion. Also, I too will be reading the recnet post about 10 leaders dosing protocols. 3mg may be low. TBD… Best of luck,
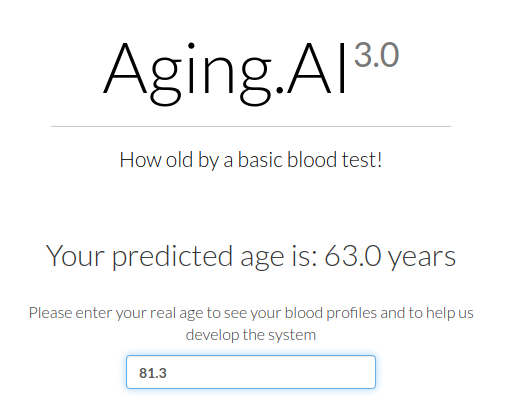
Levine is strongly dependent on chronological age. Sadly a lot of epi age tests also ask chronological age. I prefer biomarker based algorithms. Aging.ai is interesting in that it doesn’t ask chronologicsl age.
The MCV issue is interesting. High MCV correlates with mortality. That could be because it is a symptom of problems with the bone marrow rather than it is in itself problematic. However, a problem with this algorithm is that necessarily it is simplistic. For example albumin has a u shaped correlation with mortality. Too high albumin implies higher mortality.
I quite like Aging.AI (that currently gives me -19), but I prefer Levine because I understand more about how it works (it gives me -14).
To me the key thing about Biomarkers is that they generally mean something. Levine, for example, gives me some positives for having a really low WBC. However, I am not myself entirely happy about my WBC (which is under 3) although I had a covid vaccination booster this week just after my blood draw and will be interested to see what effect that might have on my next blood test. I had it on Wednesday, the ache in my arm has disappeared now. I have not felt any macro effects, but I think it kicked up my RHR by about 3-4 beats a minute for a couple of nights although I had ethanol yesterday (Rioja and Cider) which would hide any HR effects from the vaccination. I think the vaccination HR effect disappeared by Fiday night.
I do prefer the fact that Aging.ai does not ask the age, but I am not personally sure that its conclusions are reliable.
I have tried a few of the epigenetic age tests. Some require chronological age when you book them others to give you results. That raises concerns with me as to the reliability of them. I understand the theory behind this and I agree that epigenetics is important, but in the end my objective is to improve my biomarkers because that implies the organs that generate them are becoming more healthy. Also Epigenetic tests can be quite inconsistent. At ARDD recently Morgan Levine did a presentation that looks at this.
Your WBC is I think quite high, but the percentage of lymphocytes is high.
Looking for example at the page above you could be fighting some form of chronic infection as your
Lymphocyte count is over the threshold for Lymphocytosis. CRP, however, is not that high. although I would check if you are getting values per deciLitre or Litre.
Looking back at August your Lymphocyte figure was 6.65 (10^3)/mL which is diagnosed as Lymphocytosis. Although it has come down a bit to 4.83 that is still over the threshold of 4.
I would want to know what the cause of this was as it does appear to be chronic (at least in 2022).
I agree with @John_Hemming that while the calculators are interesting, I don’t take the outputs of the calculators too seriously as most reasonably healthy people are likely younger than their chronological ages according to the calculators. Is that really true, or just an artifact of the calculators? I don’t know.
However, @John_Hemming is right that it’s more important to look at the inputs to the calculators, i.e. the biomarkers, to see what’s happening to them and what they’re telling us. To me, that’s much more informative than a calculated age.