New and updated coefficients for Levine's phenoage computed on the UK Biobank

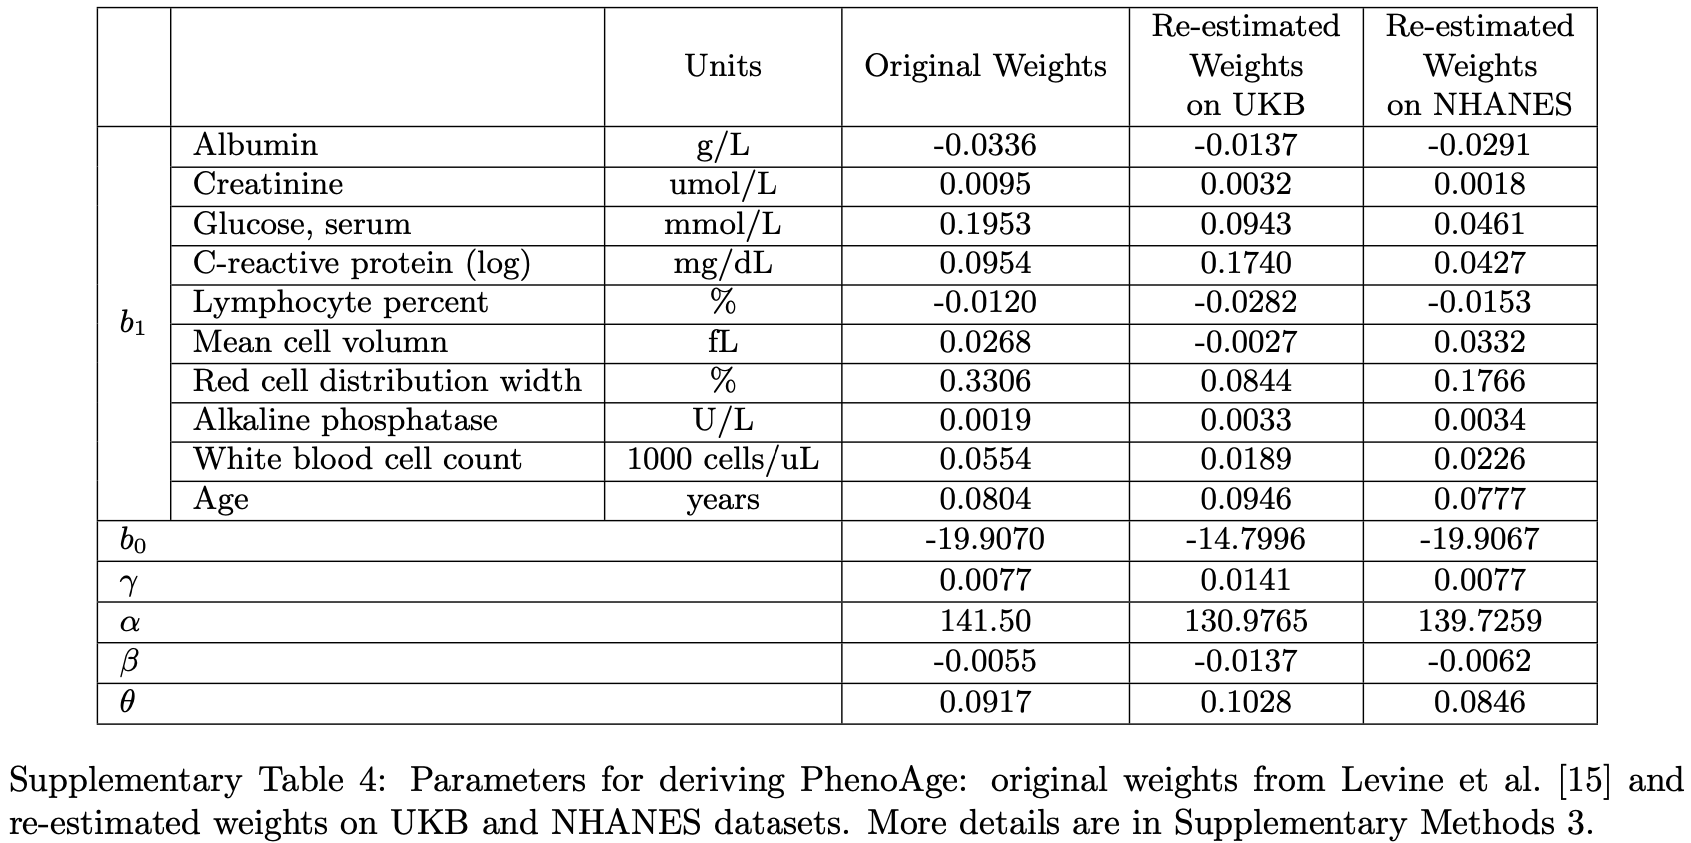
Here are some new and updated coefficients for Levine’s phenoage computed on the UK Biobank (500k samples)

From the supplementary material of the paper listed here Has anyone gotten a cystatin C blood test for renal function? It's one of the top predictors of chronological age:

Sadly it’s much less optimistic than the original phenoage and I get -3.36y instead of -6.83y.
Interestingly enough though, my improvement over 2 years is -3.2y while the original gives -3.46y so it seems that the improvements are consistent for both sets of coefficients which is good news.

BTW they also recomputed the coefficients with the NHANES data but it seems the γ coefficient is a copy/paste from Levine and it’s not working.

6 Likes

If someone has some time and excel expertise - could you please updated the spreadsheet below and share it with us?

3ba41-dnamphenoage_gen-1.xls (31.5 KB)

1 Like

Is UKB or NHANES dataset more comprehensive/representative? Which has higher percent Asian? What has higher age range? Why do some of the re-estimated weights [go in the opposite directions between UKB and NHANES], and if they do, what does it even mean?

RDW coefficients went way down… (though they still have the highest in NHANES). RDW is something some Asians test really well at even at older ages, but it doesn’t make them less aged… CRP weighing went higher in UKB (becoming MORE important than RDW just for UKB) and lower on NHANES…

How do we know that RDW and CRP aren’t colliders, or that confounding interactions between the two have not been factored out? (given that they likely have high covariance)

They’re right to weigh creatinine and albumin way less.

MCV flipped a sign according to UKB - I always had high MCV values even as a kid… Also CR can cause high MCV

From the Levine DNAm phenoage, there is an updated version called HRSInChPhenoAge that is trained on more data. I don’t know why it isn’t more widely used yet.

How can we get AI to error-correct all of Mike Lustgarten’s videos to reflect the new weightings?

3 Likes

Noting the sign swap on MCV I am more inclined to focus on the individual values.

1 Like

Just eyeballing the coefficients, it looks like the new algorithm will weigh actual age more (adjust actual age less). Who has an updated spreadsheet?

I can do a spreadsheet for all the versions if
you wish.

3 Likes

@John_Hemming yes please !

1 Like

I am not at all sure about this, but I have slotted in various constants.

It would be good if we could have a worked example so I could check this against a worked example.

levine 3 formula.xlsx (13.0 KB)

3 Likes

Basic explanation for reference:
" NHANES, a research program gathering annual cross-sectional data from a nationally representative sample of approximately 5000 participants of all ages from the US population.UKB is a longitudinal large-scale and regularly augmented biomedical database, which collects and health data from half a million UK participants."
I’m searching for more depth.
“National Health and Nutrition Examination Survey (NHANES) and UK BioBank (UKB) databases. These large databases contain uniformly collected digital activity records provided by wearable monitors as well as health and lifestyle information, and death registry.”
“For example, the average physical activity is approximately 50% higher in UKB participants compared to NHANES participants, and yet the average life expectancies are very similar.”


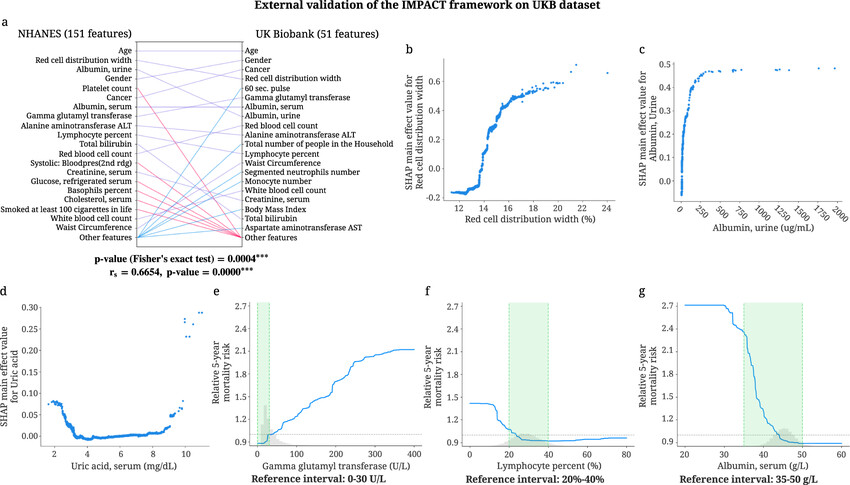
“External validation of IMPACT framework on the UKB dataset a Relative importance of 51 overlapping features in the 5-year mortality prediction models trained on the NHANES (151 features) and UKB (51 features) datasets. For each model, the figure shows the 20 most important features of prediction (ordered by importance). The purple line indicates that the feature is in the top 20 features of both models. Blue and red lines indicate the feature is in the top 20 features of one model but not the other.”

Thanks, John you just took two years off of my lifespan :grin:

5 Likes

a) There could easily be errors in the way I have adjusted the formulae for the two new versions. I have not had any example calculation I can check.

b) It is clear from these that we cannot rely on linear calculations based upon biomarkers only going one way (ie higher is better or lower is better). There is clearly a u shaped curve (or n shaped) which has a range of good values with higher or lower indicating some problems.

3 Likes

Here’s a study exploring the nationality/racial (Asian, Hispanic) variability in ranking mortality predictors:

" Here, we determine the strongest predictors of five-year mortality in four national, prospective studies of older adults. We analyze nationally representative surveys of older adults in four countries with similar levels of life expectancy: England (n = 6113, ages 52+), the US (n = 2023, ages 50+), Costa Rica (n = 2694, ages 60+), and Taiwan (n = 1032, ages 53+). Each survey includes a broad set of demographic, social, health, and biological variables that have been shown previously to predict mortality. We rank 57 predictors, 25 of which are available in all four countries, net of age and sex."
“C-reactive protein, additional inflammatory markers, homocysteine, serum albumin, three performance assessments (gait speed, grip strength, and chair stands), and exercise frequency also discriminate well between decedents and survivors when these measures are available. We identify several promising candidates that could improve mortality prediction for both population-based and clinical populations.”
“Laymen, social scientists, and health researchers have long shared a fascination with predicting a person’s longevity or future age at death. In a modern day version of fortune telling, the internet is replete with websites and “apps,” with such evocative names as “Death Clock,” “Death Timer,” and “Deadline,” designed to predict age at death or time remaining before death on the basis of a battery of simple questions.”
“In this paper, we use the extensive information collected in four recent biosocial surveys—in England, the US, Costa Rica and Taiwan—each of which is based on a large, national sample. We identify the best predictors of survival and assess robustness of these findings with multiple measures of discrimination. We address two specific questions. First, what factors matter most in determining whether an older adult will die in the next five years? Second, are the principal predictors the same across countries with similar levels of life expectancy but distinct social environments, levels of affluence, and access to health care?”
“One biomarker, C-reactive protein (CRP), is among the top 10 predictors in all four countries. Among the eight other biomarkers, only two appear among the top 10: glycosylated hemoglobin in Costa Rica and diastolic blood pressure in Taiwan. Self-reports of diagnosed heart disease, stroke, diabetes, and cancer appear on the list for some countries, but only in Taiwan does one of these (diabetes) appear among the five strongest predictors.”
“Peak expiratory flow (PEF), timed chair stands, and gait speed yield ΔAUC > = 0.01 among the countries in which they are available. Grip strength is a strong contributor in Costa Rica and Taiwan.”
“Several biomarkers perform very well among all countries for which they are available: serum albumin; homocysteine; and several inflammatory markers (fibrinogen, s-ICAM-1 and sE-selectin).”
“In England, the most notable differences are that the measures of cognitive function and grip strength are stronger predictors, while CRP is a weaker predictor in the full sample than in the restricted sample. Among the Taiwanese, two of the biggest changes involve education (which becomes a stronger predictor) and history of diabetes (which becomes a weaker predictor) when models are re-estimated for all interviewed respondents.”
“Nevertheless, exercise frequency appears on the top 10 lists for three countries, sometimes above measures of disease prevalence and biomarkers. This finding raises an important caveat, namely that our analysis cannot be used to infer causal linkages between the predictors and survival. For example, exercise may discriminate well partly because of reverse causality (poor health leads to reduced exercise).A major strength of this analysis is that we bridge the division between clinicians and researchers interested in mortality prediction and employ a more diverse set of predictors than previous studies.”

https://www.ncbi.nlm.nih.gov/pmc/articles/PMC4951106/
I really really want to know if increased CRP in one of the samples reduces contribution from RDW because they don’t appear to be controlled for each other (and if there is any interaction term). There are many different linear regressions whose contribution to total error is not that different from each other - the one particular linear regression used may not be super-stable and it shows in how wildly different they are in the different datasets

1 Like

My RDW was 13.2% on one day in Feb 2023, and then 11.6% several days later. There is A LOT of measurement variability in these numbers. Glucose varies like crazy just based on when you take it. % lymphocytes can also vary like crazy. The value of age only got regressed higher - that’s b/c almost all the coefficients for PhenoAge can vary like crazy and are not fully representative in a particular person (there are way better measurements that we can only dream to get in the omics era)

2 Likes

Glucose and HbA1c also metabolise in samples (HbA1c going up and glucose down).

All of these things have their challenges. One of the best things I get from my weekly blood tests is knowledge as to variability and other bits of noise. (like test artefacts)

1 Like

Has anyone created a JavaScript applet for this? Should be very easy esp with Claude or GPT5

3 Likes

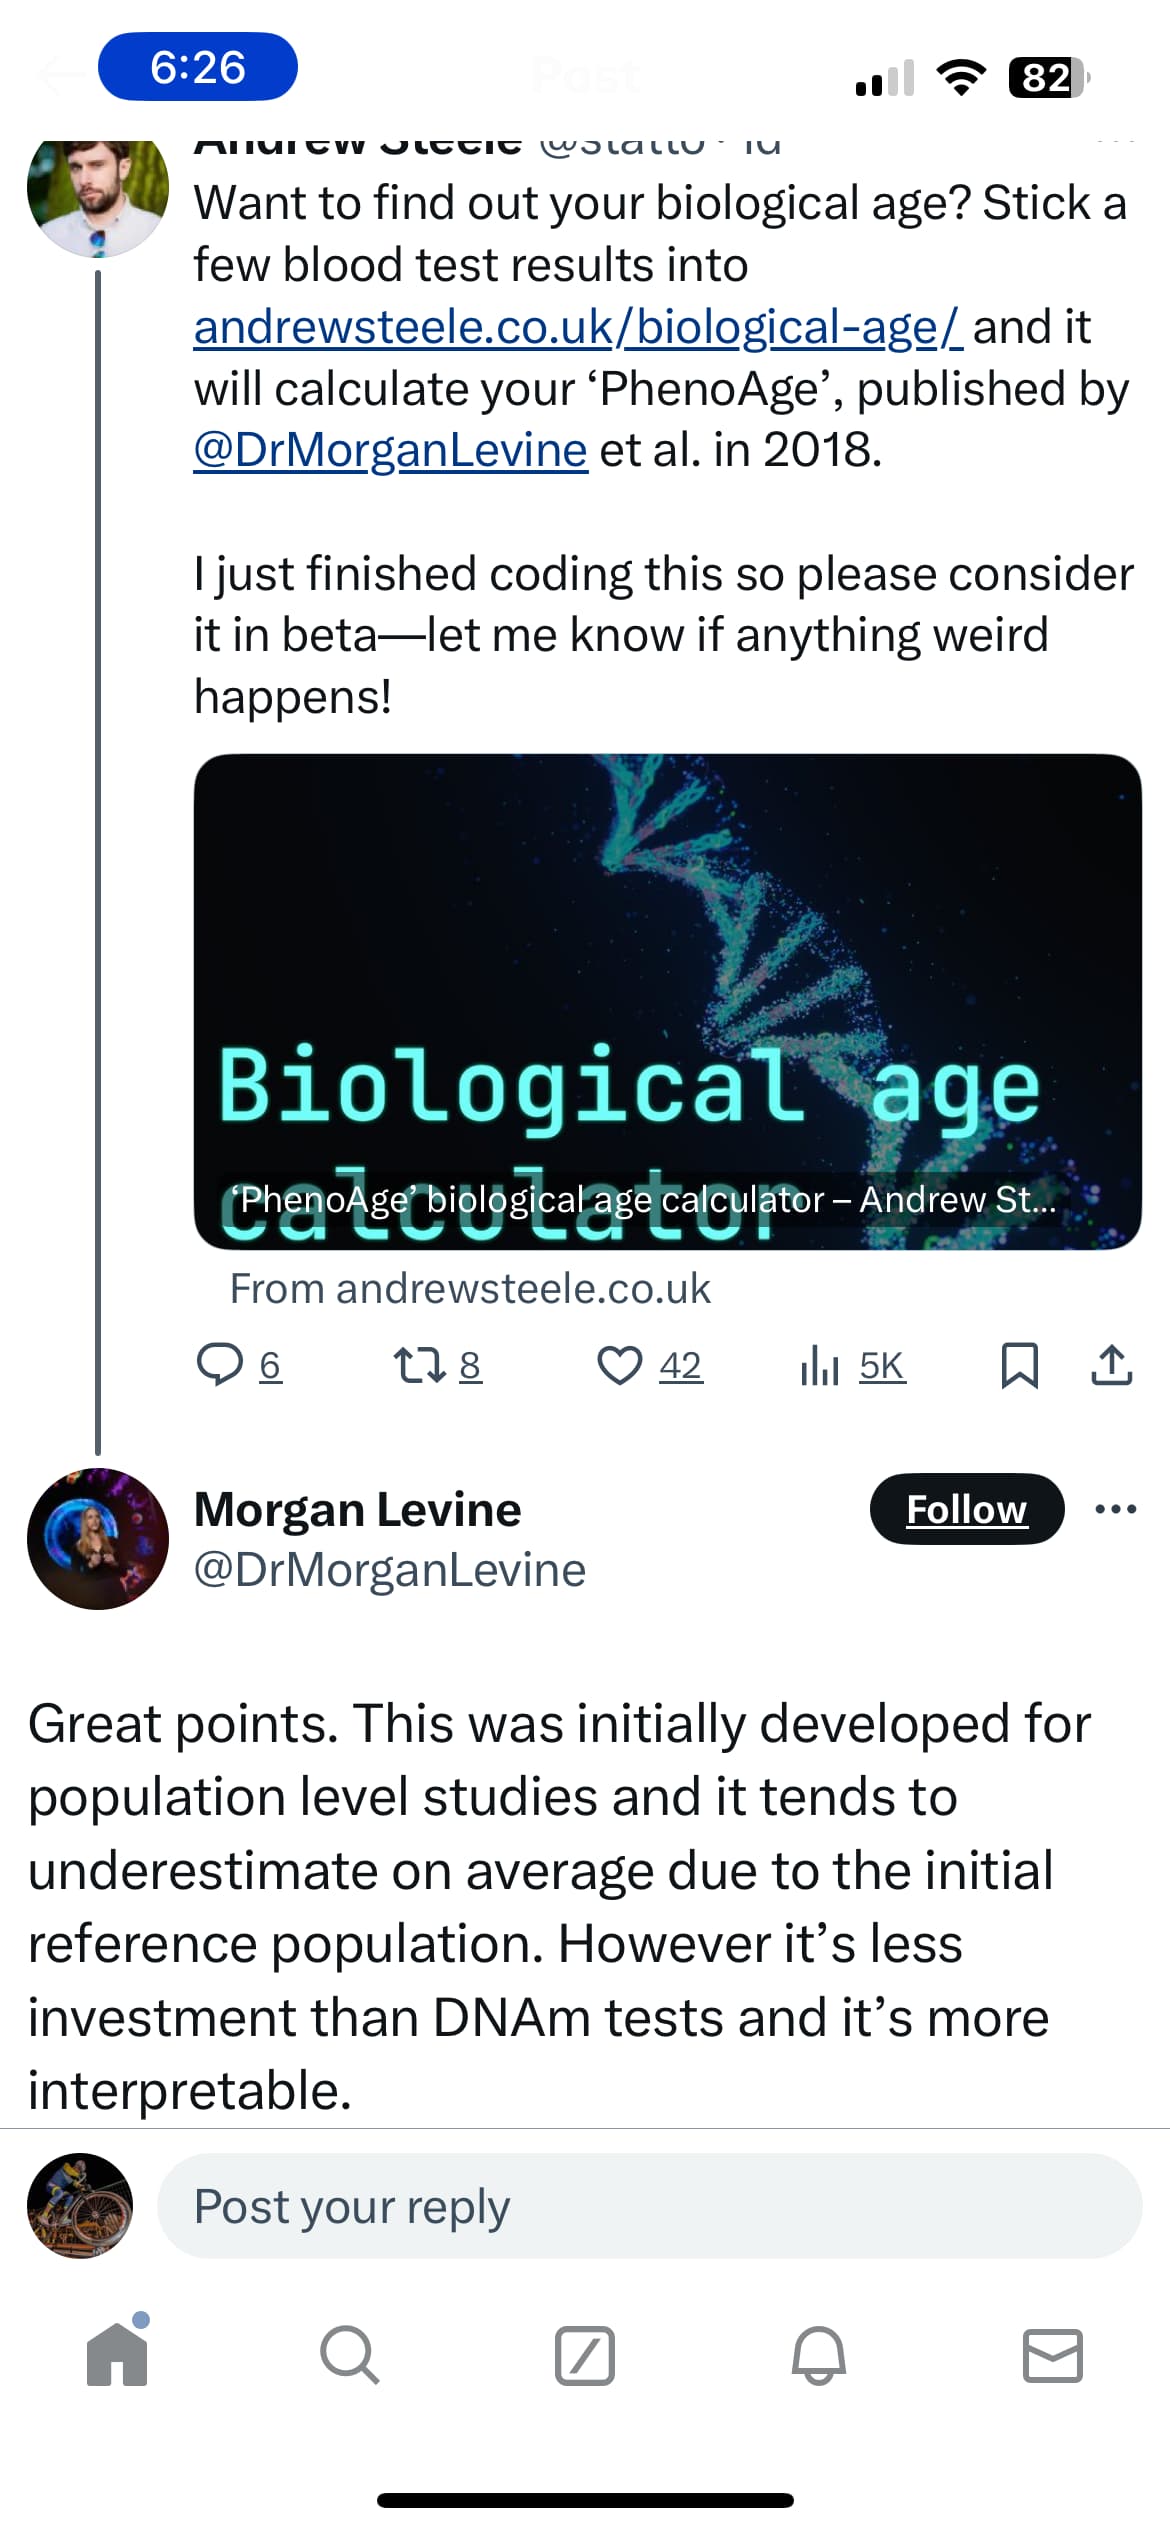
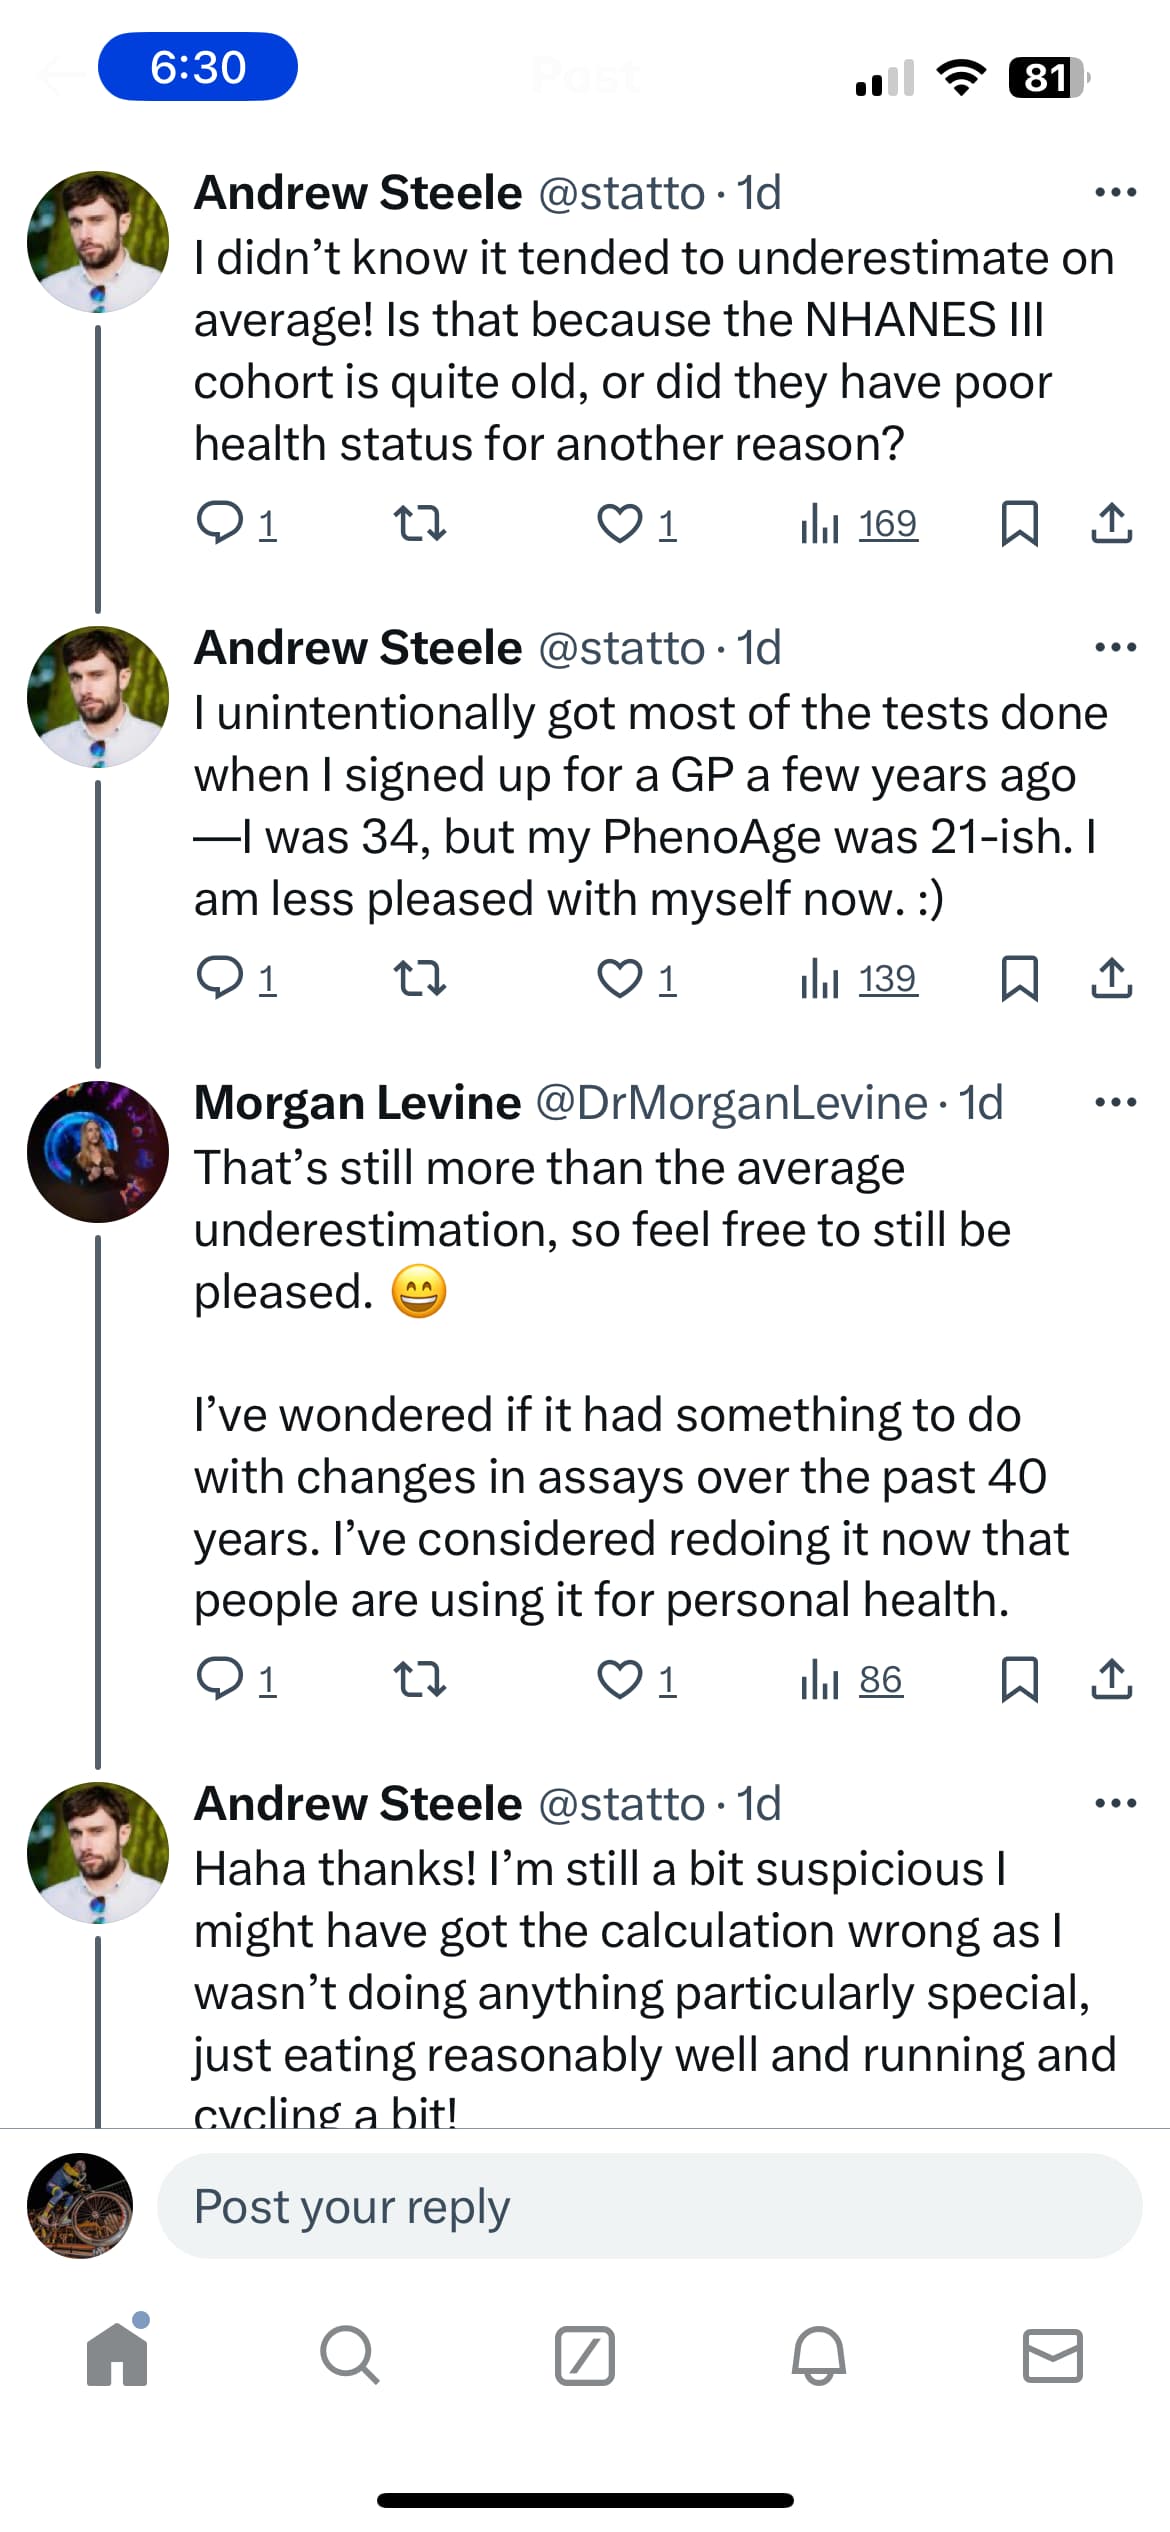
Morgan Levine’s comments on original model

2 Likes
4 Likes

Great to see this updated (and more realistic).
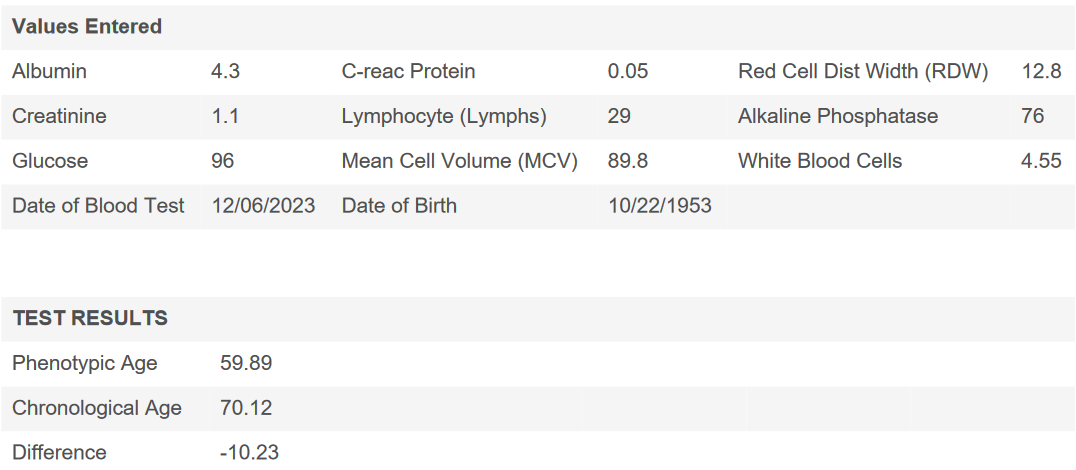
My original score:

And my updated results (from a new blood test and with the new calculator):

New Levine PhenoAge

3 Likes

@John_Hemming FYI, in your spreadsheet, the weights for glucose and lymphocyte % for UK Biobank are off by a decimal point.

For glucose, you have 0.943; it should be 0.0943.

For lymphocyte %, you have -0.282; it should be -0.0282.

2 Likes