before and after rapamycin?
I personally did after, and it lined up with my regular egfr using creatinine
Its just a better way to calculate egfr that doesnt fluctuate from creatine levels
1 Like
Yeah - so my eGFR (without Cystatin C test) came back at 73. Then I had the Cystatin C test and eGFR comes back at 115.
Could the initial reading have been low because of high creatinine levels?
Asked my Kaiser PCP for this test, denied:
‘Cystatin-C is not a routine screening blood test.
Your kidney function was checked with the creatinine blood test.’
I have low creatinine. But 0.77 mg/dL => 0.68 umol/L which is not super-low.
FWIW
Test Cystatin C With Glomerular Filtration Rate, Estimated (eGFR)
LabCorp Test Number: 121265
CPT: 82610
LabCorp billing to insurance in the NY area on 03/17/2023 $202.65
Through 3rd party service
LabCorp test 121265 through
Life Extension cost $99.00
Through Marek Diagnostics $79.00
Look at another posting their was a discount code posted
At discounted labs $57.49
1 Like
Cystatin C is currently $40 through Ulta Labs. They use Quest Diagnostics. That’s the lowest price I could find for self testing.
3 Likes
I would try asking your doctor to order it; it usually is covered. I had to explain to my Dr. what it was.
Yeah I did it through Ulta for $40. Definitely the best deal out there
Here is the Ultra Lab link.
Thank you Vlasko
1 Like
Creatinine is subject to increasing through metabolism. So be careful about delays between giving a blood sample and the test being done.
1 Like
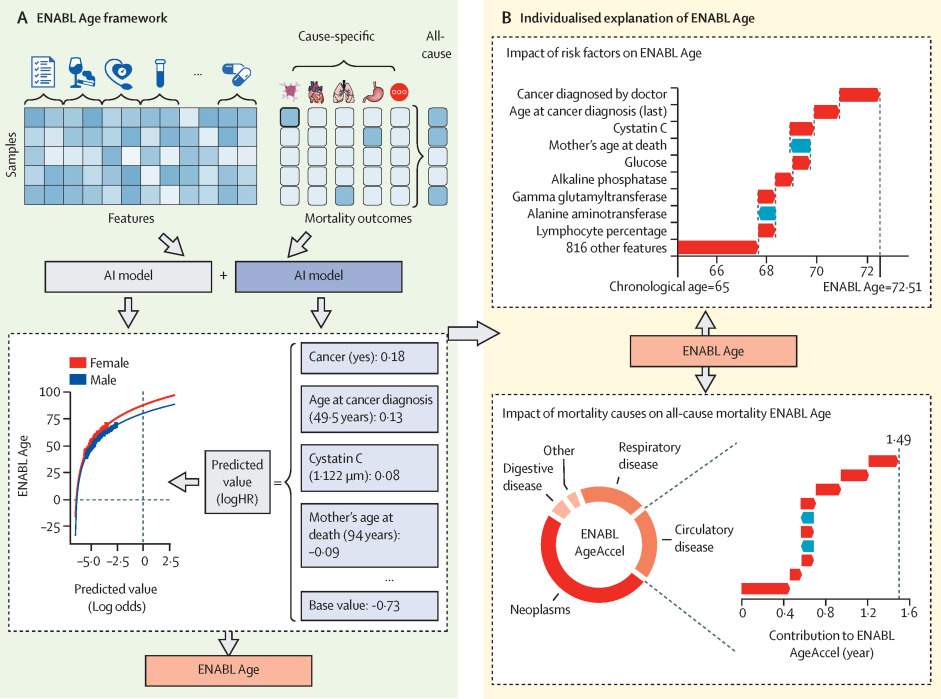
The ENC model suggests that a one standard deviation increase (i) in age (8.1 years) increases mortality hazard by 84% [95% CI: 80% - 88%], (ii) in cystatin C (0.14mg/L) by 31% [29% - 33%], when adjusted for sex and all selected biomarkers (Supplementary Table 4). Our result mirrors the finding of a meta-analysis by Luo et al. (24), which identified a 32% [12% - 55%] increase in all-cause mortality hazard with a one standard deviation increase in cystatin C, based on 39,000 participants across nine different studies. The addition of cystatin C to the Comprehensive Metabolic Panel and the Employer/Cardiac Panel confirmed the incremental predictive uplifts in models where this biomarker is present, increasing the C-index by 0.015 and 0.005 for each of the Panels respectively (Fig 2, panels 3 vs 4 and 9 vs 10). Red blood cell (erythrocyte) distribution width appears to have the strongest effect size after cystatin C, with a standard deviation increase implying a 17% [15% – 19%] increase in mortality hazard.
Due to the documented positive relationship between serum cystatin C and creatinine (25, 26), as well as the positive correlation (r = 0.51) identified in our descriptive analysis (Supplementary Figure 1), we investigated how the effect sizes of these two biomarkers were altered with the removal of the other. When creatinine was removed, the standardised effect size for cystatin C was still the largest of all blood biomarkers. The hazard ratio decreased to a 22% [20% – 24%] increase in mortality hazard for one standard deviation increase in cystatin C level. Conversely, when cystatin C was removed, the effect size for creatinine was still negative but was no longer statistically significant, with a one standard deviation increase implying a 1% [-1% to 3%] reduction in mortality hazard.
1 Like
1 Like
I finally decided to get it. the blood draw fee is just $9
Also, does canagliflozin decrease it more than rapamycin?
==
it’s a huge part of https://www.thelancet.com/journals/lanhl/article/PIIS2666-7568(23)00189-7/fulltext
===
===
we uniquely focused on why a certain prediction was made by developing novel AI principles, and techniques (e.g., SHAP) to improve the interpretability of ML models, applicable to a broad spectrum of problems beyond biomedicine.
Modern complex, black-box ML models such as deep neural networks have become standard tools for biomedical research. Their opaque nature and consequent lack of interpretability have been a bottleneck impeding the widespread adoption of AI in biomedicine and beyond. These models do not answer the key questions, such as molecular basis for complex phenotypes, design strategies for therapeutics, or the reasoning process of clinical decisions. This challenge gave rise to explainable AI (XAI), a.k.a., interpretable ML.
AIMS lab’s research focuses on a broad spectrum of problems, advancing: (A) AI/ML - developing XAI principles and techniques
2 Likes
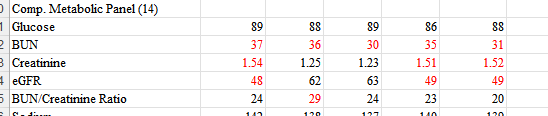
Impact of hydration on creatinine clearance:
The 1.25 and 1.23 values are when I made an effort to drink water beforehand. The others, no such effort. All tests taken while fasting. Seems that, for best results, one should make an effort to be hydrated before testing, even if fasting.
1 Like
Both creatinine and cystatin c are going to vary on factors other than GFR
Which other factors???
Creatinine: hydration , muscle mass, exercise, delay on test
Cystatin c will vary on hydration i dont know of other factors but there are likely to be some.