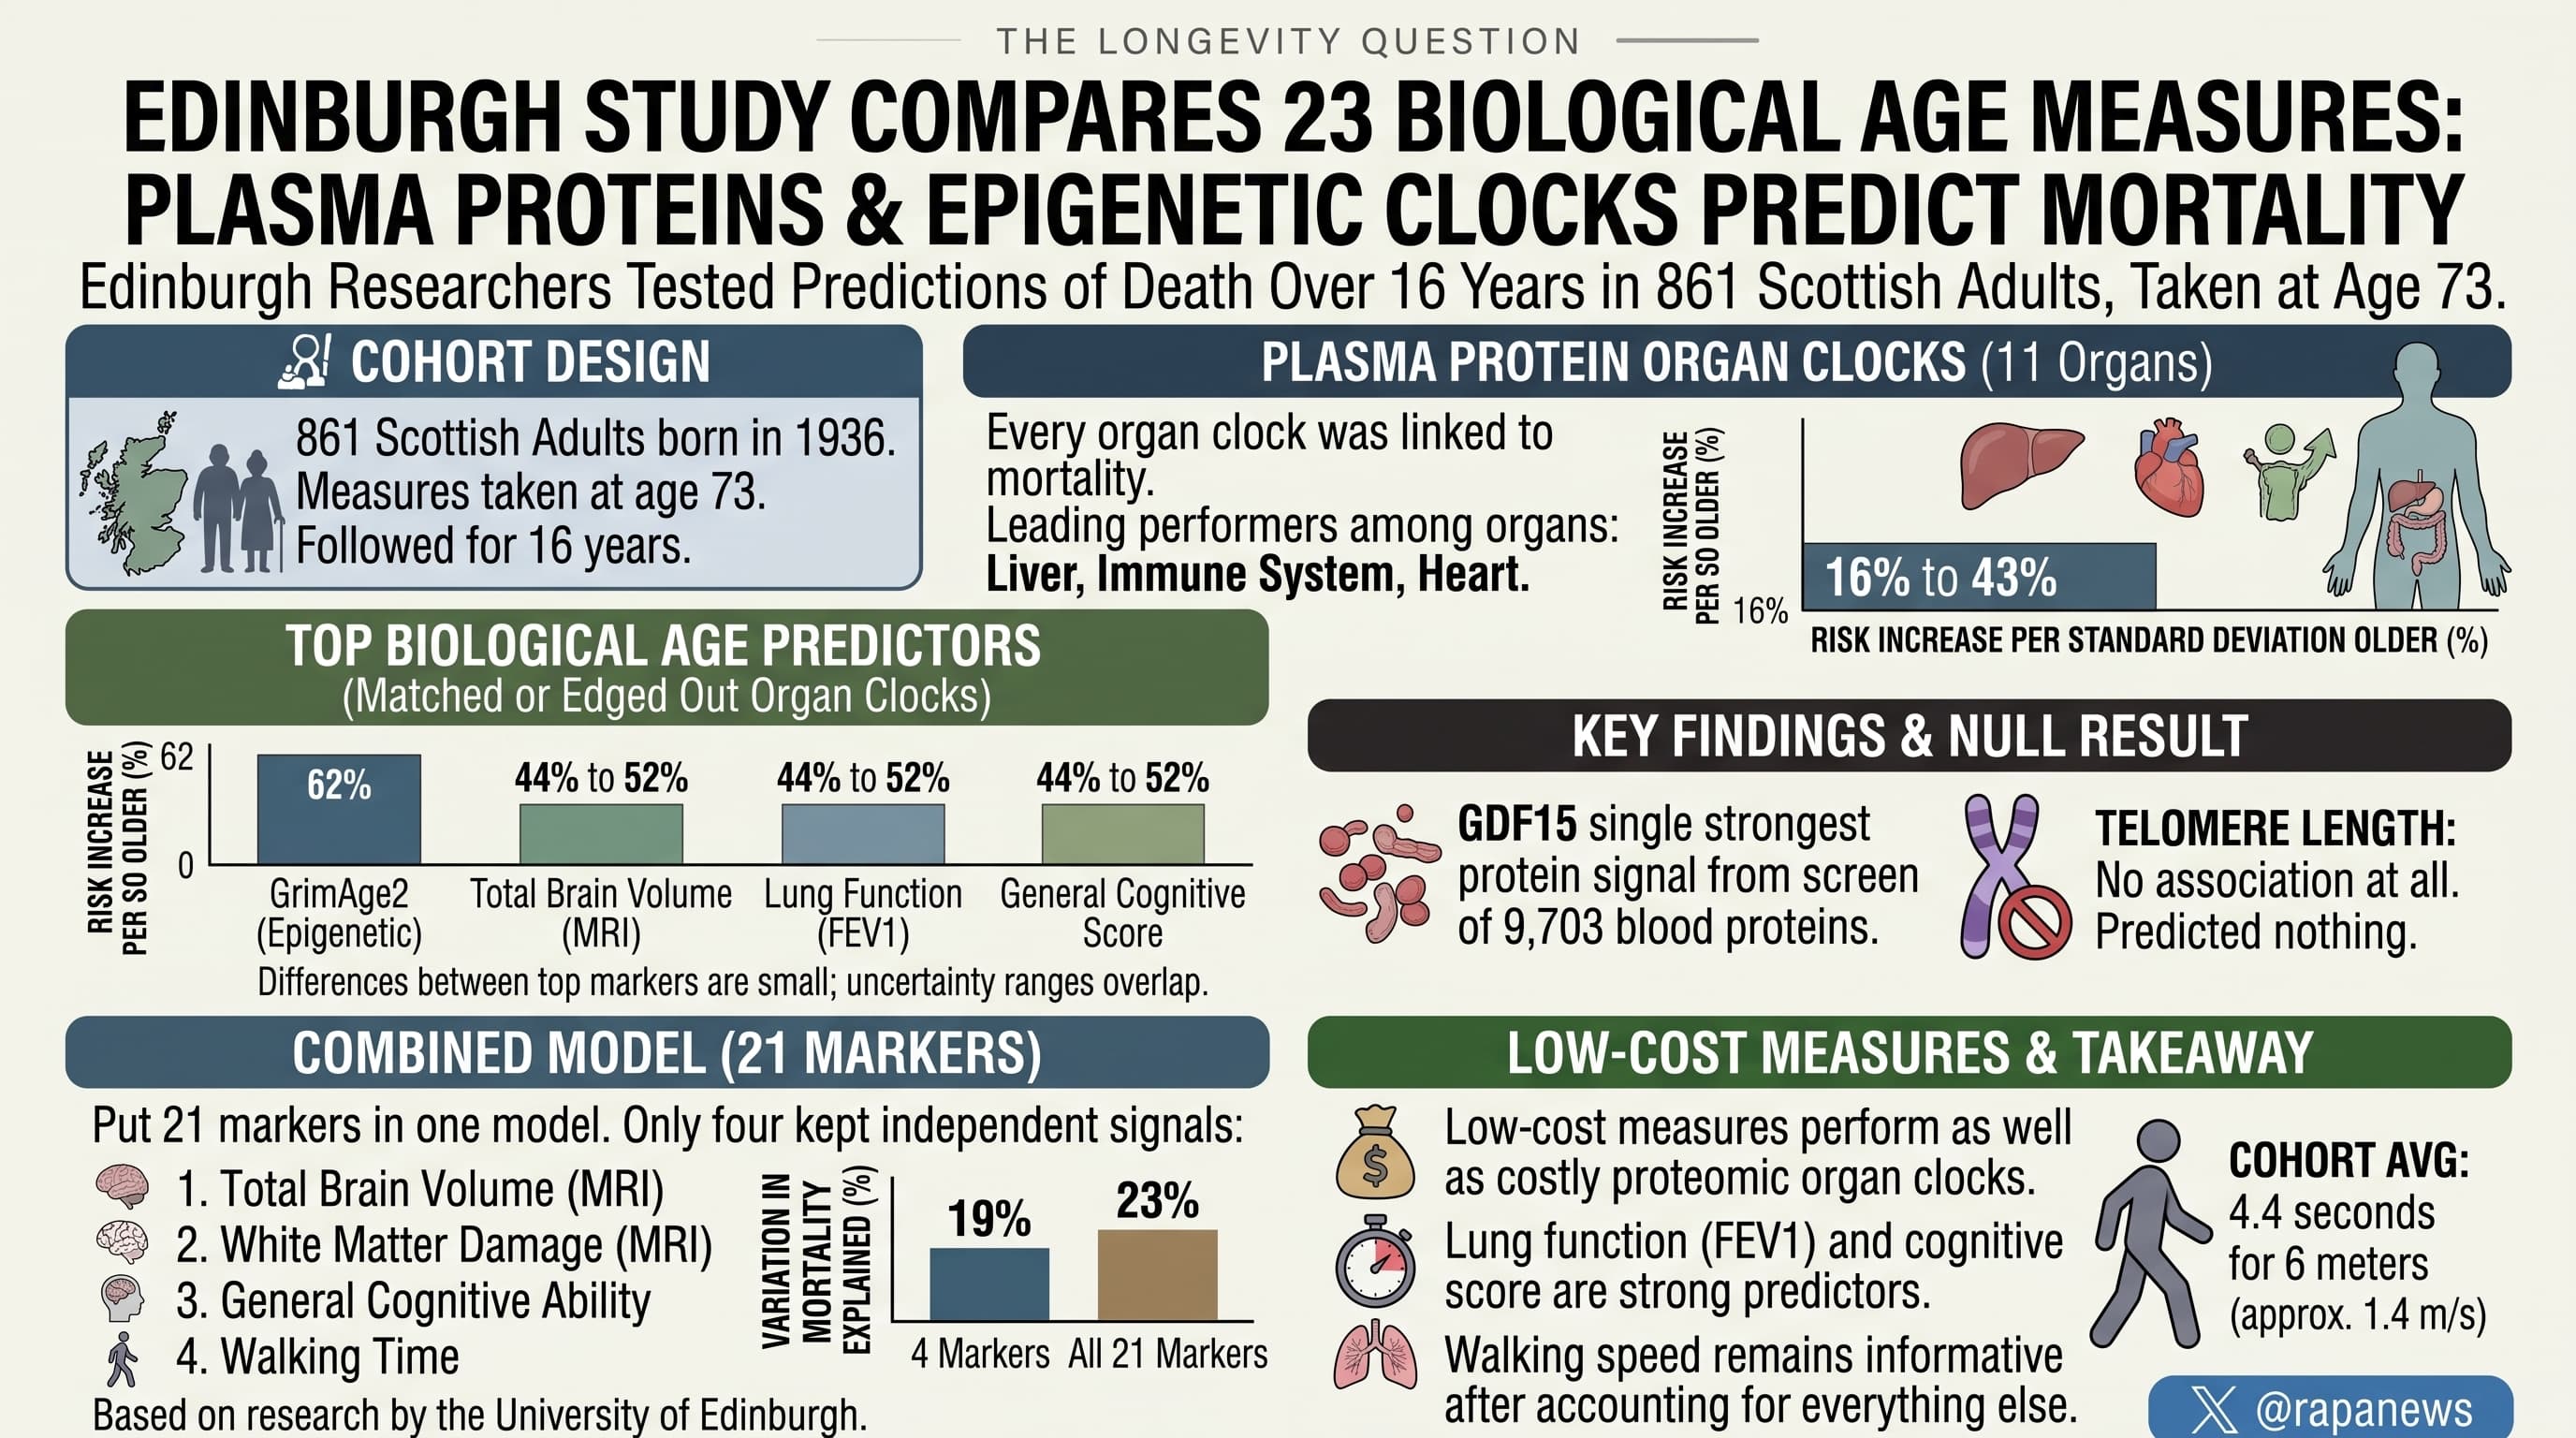
Edinburgh researchers tested how well 23 different “biological age” measures, all taken at age 73, predicted who died over the next 16 years in 861 Scottish adults born in 1936. Plasma protein clocks that estimate the age of 11 organs did predict mortality, with liver, immune and heart clocks performing best. They were matched or edged out by the GrimAge2 epigenetic clock, brain volume on MRI, lung function and a cognitive test score. Telomere length predicted nothing. A screen of 9,703 blood proteins flagged GDF15 as the single strongest protein signal.
Blood tests that claim to tell you the age of your liver, heart or brain are now sold directly to consumers. They rest on a 2023 Stanford method that reads thousands of plasma proteins and assigns each organ an age. What nobody had done is line those organ clocks up against older, cheaper measures of aging in the same people and see which best predicts death.
The Lothian Birth Cohort 1936 is well suited to that test. Its members were all born in the same year, so chronological age is effectively removed as a confounder. At about age 73 they gave blood, had brain scans, blew into a spirometer, squeezed a dynamometer, walked six metres against a stopwatch and sat 13 cognitive tests. Sixteen years later, 444 of the 861 had died.
Every organ clock was linked to mortality. A person whose organ looked one standard deviation “older” than their peers’ had a 16 to 43 percent higher risk of dying at any point in follow-up. Liver, immune system and heart led the list.
They were not the best performers. GrimAge2, an epigenetic clock built from DNA methylation and trained directly on death records, carried a 62 percent higher risk per standard deviation. Smaller total brain volume, weaker lung function and lower cognitive scores each came in at 44 to 52 percent. Telomere length, long marketed as a biological age test, showed no association at all.
When the team put 21 markers into one model, only four kept an independent signal: total brain volume, white matter damage on MRI, general cognitive ability and walking time. Those four explained about 19 percent of the variation in mortality risk. Adding the other 17 raised that to 23 percent.
The second half of the paper screened 9,703 individual proteins. GDF15, an stress-response protein, topped the list at 56 percent higher risk per standard deviation, followed by WFDC2 and TIMP1. Proteins linked to higher risk clustered around immune and inflammatory signalling. Proteins linked to lower risk clustered around chromatin and DNA maintenance, a pattern the authors read as genomic stability
Several cautions apply. The organ clocks were trained to predict age in a different cohort on an older version of the assay, while GrimAge2 was trained to predict death, so the contest is not level. The gaps between top markers were not formally tested and their confidence intervals overlap. The joint model used only 460 people. The cohort is healthy, white and Scottish, and everything was measured once.
What the study does show is that simple functional measures hold their own against an 11,000-protein assay. A spirometer and a stopwatch remain competitive with the newest molecular tools for predicting survival in the eighth decade of life.
Actionable Insights
What this study offers is guidance on which measurements carry information at around age 73.
Low-cost measures did as well as costly ones. Lung function (FEV1) and a cognitive score each predicted death about as strongly as the best proteomic organ clock. Walking speed stayed informative after accounting for everything else. The cohort average was 4.4 seconds to cover six metres, about 1.4 metres per second.
To put the numbers in plain terms: half the cohort died in 16 years. By my rough calculation, a person one standard deviation “older” on GrimAge2 had about a 69 percent chance of dying in that time, against about 36 percent for someone one standard deviation “younger”. For the liver clock the equivalent figures are about 65 and 40 percent. For telomere length there was no difference.
Practical takeaways:
- Telomere length testing had no predictive value here.
- Organ age tests carry real signal, but no more than spirometry or an epigenetic clock.
- GDF15 was the strongest single blood protein. It is a research marker with no agreed action threshold.
- Smoking history, lung function and brain health are the modifiable areas this data points toward.
Context and Source
- Open Access Paper: Multimodal Ageing Biomarkers and Plasma Proteomic Signatures Associated With All-Cause Mortality
- Institution: The University of Edinburgh (Lothian Birth Cohorts; Institute of Genetics and Cancer), with co-authors at the University of Exeter, the US National Institute on Aging and the University of Texas at Austin
- Country: United Kingdom (Scotland)
- Journal: Aging Cell (Wiley, for the Anatomical Society), Accepted 23 September 2026.
- Impact evaluation: The impact score of this journal is 7.7 (Journal Impact Factor, 2025 JCR data year), evaluated against a typical high-end range of 0 to 60+ for top general science, therefore this is a Medium impact journal. It is a leading title within the aging-biology specialty.
Related Reading:
- The "Stress Siren": GDF-15 Flashing Red Before the Brain Shrinks
- Blood Biomarker GDF15: The Protein That Sees Dementia Coming Fourteen Years Early
- GDF15: The Blood Marker That Warns of Dementia 20 Years Early, and Why It May Not Be Alzheimer's
- Teal Proteomics 2024 launch - Organ Specific Biological Clock (Now Vero Bioscience)
- Vero Bioscience, Inc. new proteomics organ clocks