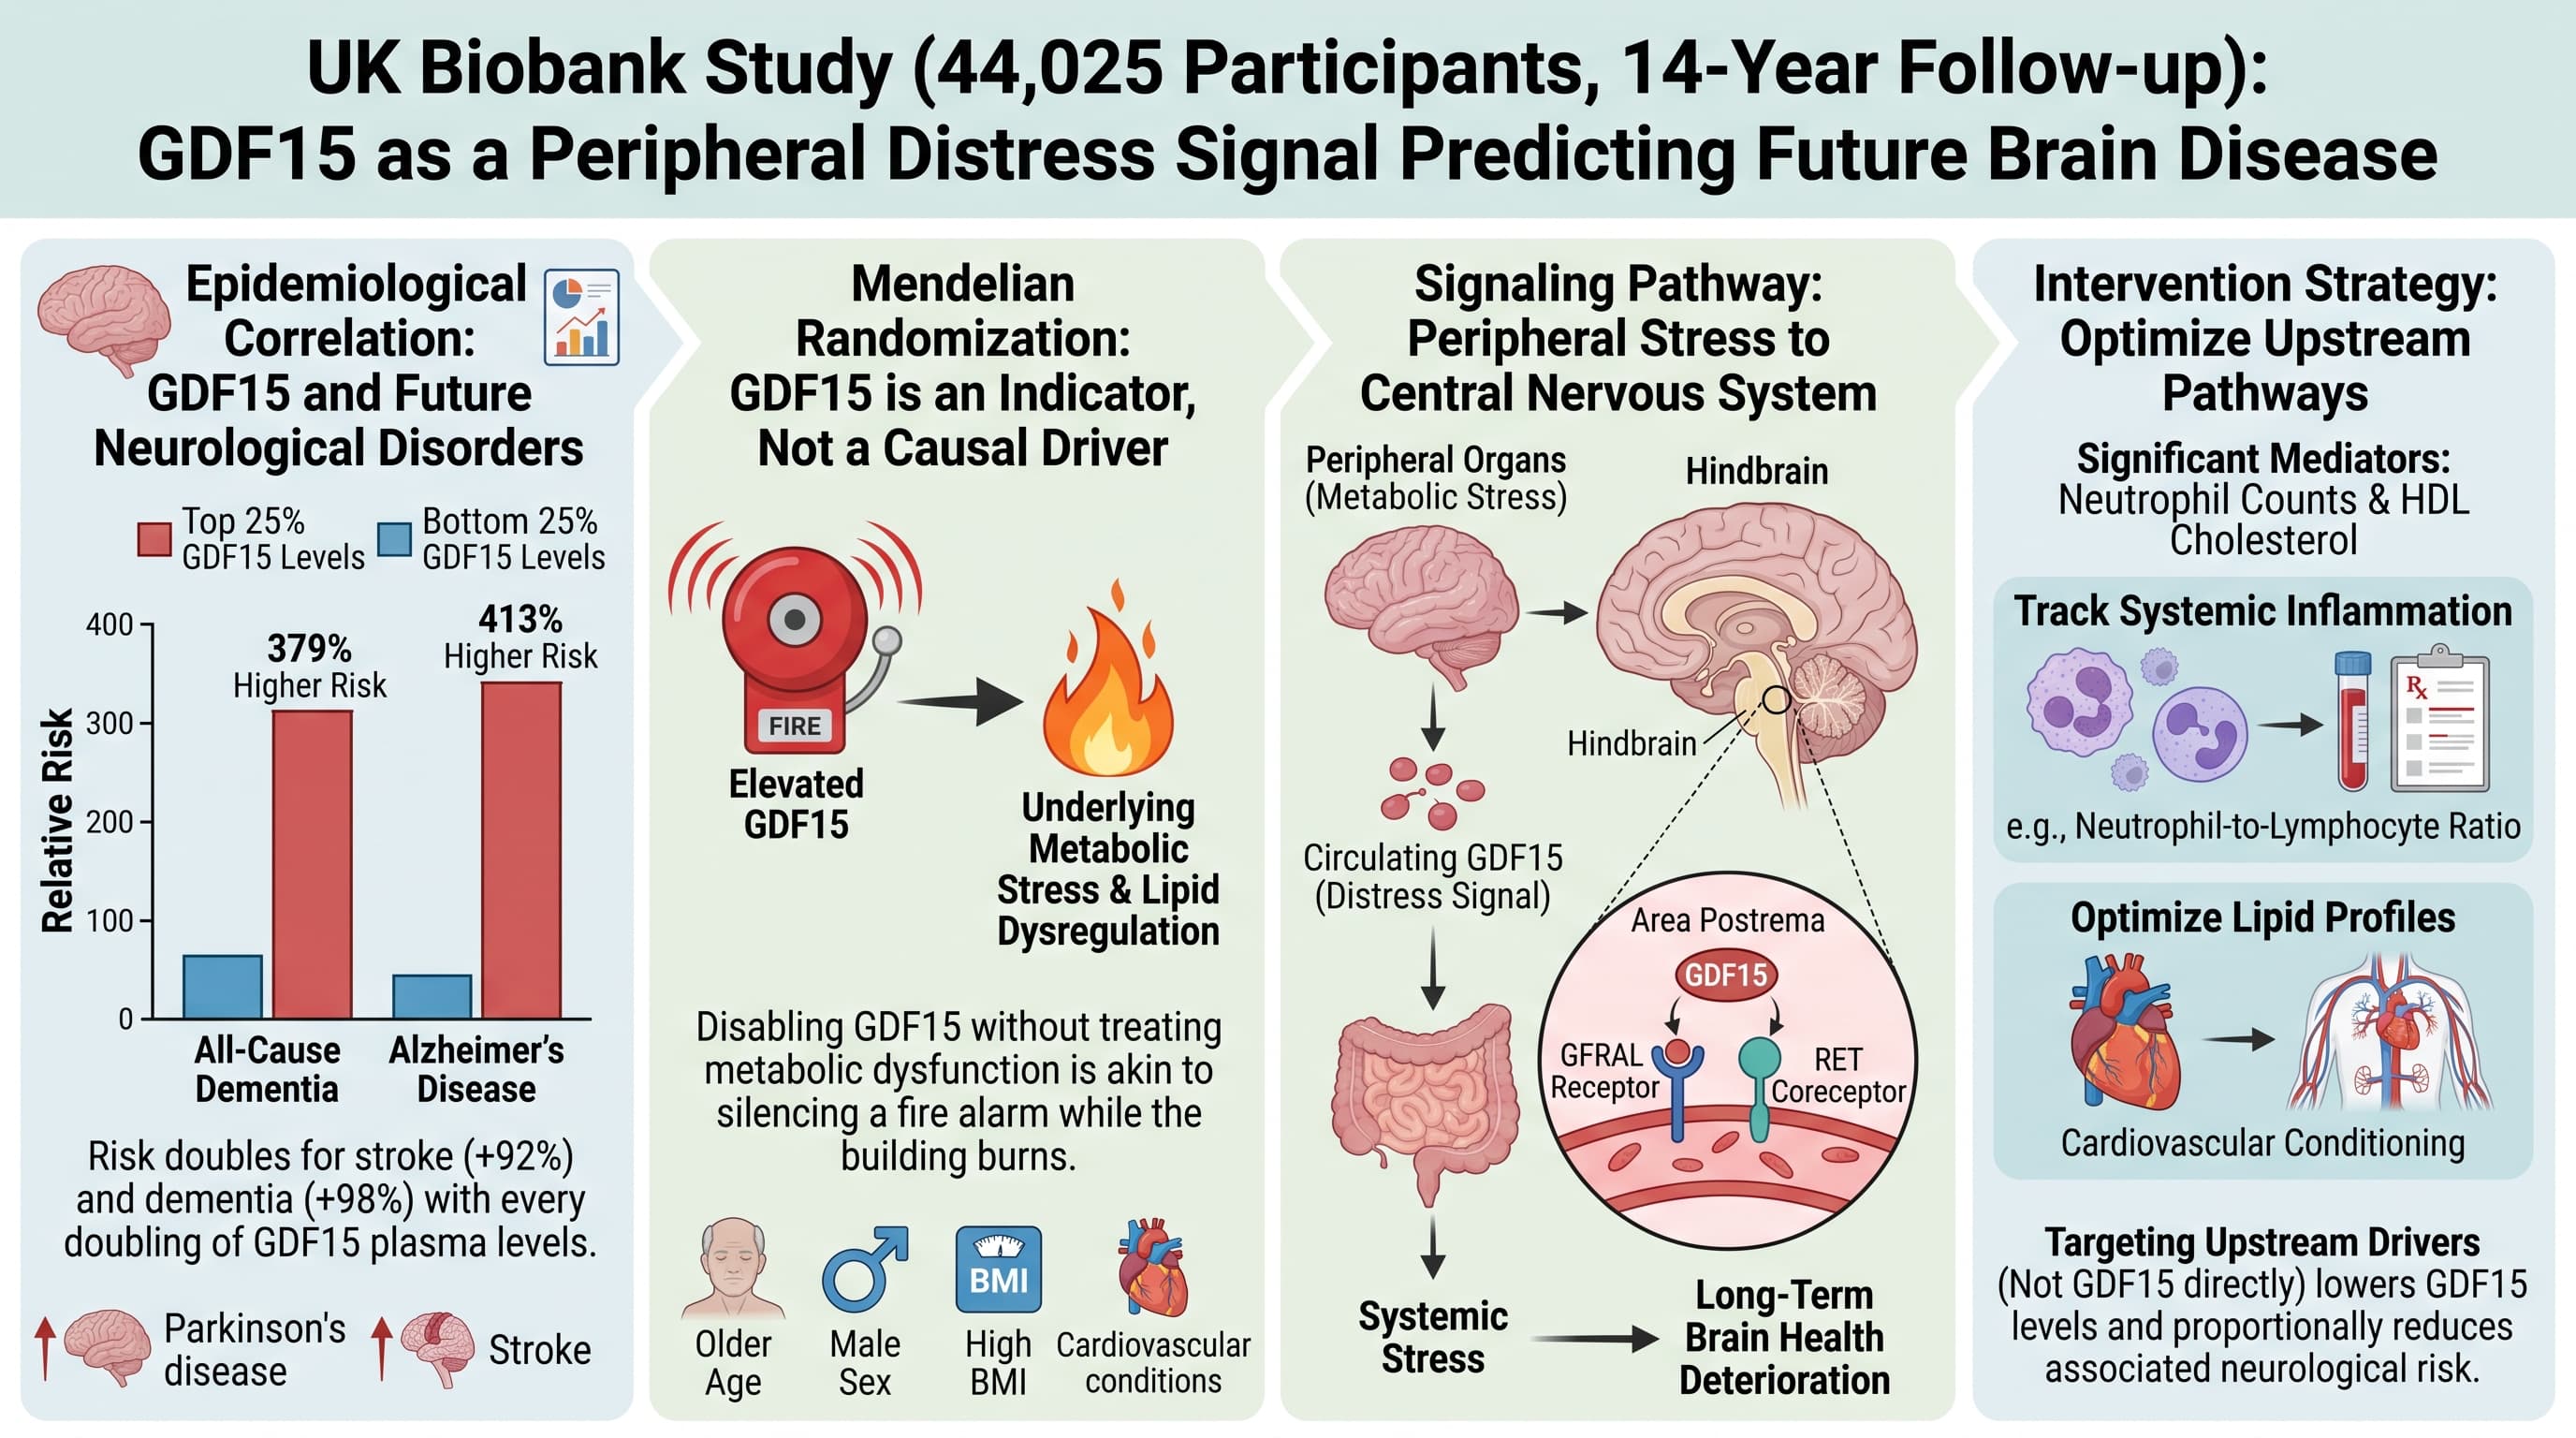
Blood Biomarker GDF15: The Protein That Sees Dementia Coming Fourteen Years Early

Researchers at Jilin University tracked 44,025 UK Biobank participants for roughly 14 years and found that a single stress-response protein measured in plasma at the start, GDF15, predicted who would later develop nine separate brain disorders. People in the top quarter of GDF15 had about five times the rate of Alzheimer’s disease and about three times the rate of stroke compared with the bottom quarter, after adjustment for age, sex, lifestyle and cardiometabolic history. Inflammatory and lipid markers explained only a small slice of the association, mostly through neutrophil count and HDL cholesterol.

Growth differentiation factor 15 is what cells release when things are going badly. Damaged mitochondria trigger it. Metabolic stress triggers it. Inflammation, hypoxia and tissue injury all trigger it. It is one of the most reliable blood markers of biological strain that anyone has found, and it climbs steadily with age in almost everyone.

A team led by Changgui Kou and Wei Bai asked a simple question of the UK Biobank: if you measure this protein once, in middle age, how much does it tell you about what happens to a person’s brain over the next decade and a half?

The answer is a lot. Among 44,025 people who had no diagnosed brain disorder when their blood was drawn, 6,939 went on to develop one. Sorting participants by their baseline GDF15 produced a steep gradient. Those in the top quarter developed all-cause dementia at roughly five times the rate of the bottom quarter and Alzheimer’s disease at roughly five times the rate, with stroke at three times and epilepsy at twice. Even conditions with no obvious link to metabolic stress, such as sleep disorders and depression, showed a clear signal. Every one of the nine outcomes tested moved in the same direction, and the pattern held across seven different sensitivity analyses.

That consistency is the strength of the paper. It is also, in a sense, its problem. A marker that predicts dementia, stroke, Parkinson’s, epilepsy, depression, anxiety and insomnia all at once is probably not telling you something specific about any of them. It is telling you something general about the person.

The authors then did the thing that separates a careful paper from a promotional one. They used Mendelian randomisation, which exploits the random assortment of genes at conception to approximate a natural experiment, to ask whether GDF15 causes any of this. For eight of the nine outcomes, the answer came back null. Genetically higher GDF15 did not predict dementia, stroke, Parkinson’s, depression or sleep problems. For anxiety it ran backwards, with genetically higher GDF15 associated with lower risk, a result the authors themselves treat as suspect.

So GDF15 is a witness, not a culprit. It sits downstream of whatever is actually damaging the brain, faithfully reporting the accumulated burden.

That is still useful. Most of what clinical medicine currently offers for brain aging risk arrives too late, after cognitive symptoms are already visible. A protein that separates high from low risk fourteen years in advance, from a single tube of blood, has obvious value for enrolling the right people into prevention trials and for deciding who deserves aggressive vascular risk management.

What it does not offer is a target. Lowering GDF15 pharmacologically, which several companies are attempting for cachexia and obesity, would on this evidence do nothing for the brain. It would be like smashing the fuel gauge to fix an empty tank.

The more useful question the paper leaves open is what drives GDF15 up in the first place. Declining kidney function and chronic mitochondrial stress are the leading candidates. Neither was measured.

Actionable Insights

There is no supplement or drug here to take. GDF15 is a symptom of underlying strain, and the genetic analysis argues that pushing it down would not help your brain. What the paper offers is a calibration of how much risk a marker of general physiological stress carries.

Over 14 years, comparing the top quarter of GDF15 with the bottom quarter after adjusting for age, sex, smoking, BMI and cardiometabolic history, the absolute differences work out to roughly 3.3 extra dementia cases per 100 people, 5.5 extra strokes per 100, and 10.6 extra cases of any brain disorder per 100. You would need about 30 people to move from the high group to the low group to prevent one dementia case, if the relationship were causal. It is not, so treat that as a ceiling on what any GDF15-lowering intervention could deliver.

Two practical points survive. The strongest signals were vascular and neurodegenerative rather than psychiatric, which reinforces that blood pressure, lipids and glucose remain the highest-yield modifiable targets. And the two leading mediators, neutrophil count and HDL cholesterol, already sit on a standard blood panel.

Context and Source

  • Paywalled Paper: Peripheral GDF15 as an early biomarker for brain disorders: A large prospective cohort study
  • Institution: Department of Epidemiology and Biostatistics, School of Public Health, Jilin University, Changchun, Jilin Province
  • Country: China
  • Journal: Progress in Neuro-Psychopharmacology and Biological Psychiatry
  • Impact evaluation: The impact score of this journal is 4.2 (Journal Impact Factor, most recent reported; the 2022 figure was 5.6 and has declined since), evaluated against a typical high-end range of 0 to 60+ for top general science journals, therefore this is a Medium impact journal.

Related Reading:

Effect Size Extraction

A note on the exposure scale, which the paper does not make obvious

Every continuous hazard ratio in this paper is stated “per 1-unit increase in log2-transformed GDF15.” One unit on a log2 scale means a doubling of the protein. That sounds like a small step, but it is not, relative to how much people actually differ from one another.

The quartile cutoffs were -0.33 and +0.33, so the interquartile range spans 0.66 units. Assuming an approximately normal distribution, that implies a standard deviation of about 0.49 units. A doubling of GDF15 therefore represents roughly a 2-standard-deviation move through the population, not a 1-standard-deviation move. Anyone comparing these hazard ratios against per-SD estimates from other biomarker papers will overestimate GDF15 by roughly a factor of two on the log scale. The rescaling below is my own derivation, not the authors’.

Relative risk, per doubling and per standard deviation

Cohen’s d is converted from the hazard ratio using the logistic approximation, d = ln(HR) x 0.5513. By convention 0.2 is small, 0.5 is moderate and 0.8 is large.

Outcome HR per doubling (95% CI) HR per 1 SD Cohen’s d per SD
All-cause dementia 1.98 (1.80 to 2.17) 1.40 0.18
Stroke 1.92 (1.81 to 2.05) 1.38 0.18
Alzheimer’s disease 1.84 (1.60 to 2.10) 1.35 0.16
Epilepsy 1.71 (1.46 to 2.01) 1.30 0.15
Any brain disorder 1.54 (1.48 to 1.60) 1.24 0.12
Sleep disorders 1.40 (1.26 to 1.55) 1.18 0.09
Depression 1.38 (1.29 to 1.49) 1.17 0.09
Parkinson’s disease 1.37 (1.18 to 1.59) 1.17 0.09
Anxiety 1.26 (1.16 to 1.37) 1.12 0.06

On a per-standard-deviation basis every single association is small by Cohen’s convention. The impressive-looking numbers come from contrasting the extremes of the distribution, which is a legitimate framing but a different one.

Extreme-quartile contrasts, fully adjusted (Model 3)

Outcome HR middle vs low HR high vs low (95% CI) Cohen’s d, high vs low
Alzheimer’s disease 2.99 5.13 (3.24 to 8.15) 0.90
All-cause dementia 2.52 4.79 (3.45 to 6.64) 0.86
Stroke 1.60 3.06 (2.56 to 3.66) 0.62
Epilepsy 1.45 2.13 (1.43 to 3.15) 0.42
Any brain disorder 1.19 1.88 (1.73 to 2.04) 0.35
Parkinson’s disease 1.40 1.87 (1.36 to 2.57) 0.35
Depression 1.05 1.67 (1.44 to 1.92) 0.28
Sleep disorders 1.04 1.55 (1.27 to 1.90) 0.24
Anxiety 0.93 1.28 (1.11 to 1.47) 0.14

For dementia and Alzheimer’s the top-versus-bottom effect is large by Cohen’s convention. For everything else it is moderate at best.

Absolute risk over 14 years

Two versions are given, because they answer different questions and diverge sharply.

Crude incidence straight from Table 1, which is heavily confounded by age:

Outcome Low quartile High quartile Absolute difference Crude risk ratio
Any brain disorder 10.07% 24.50% 14.43 pp 2.43
Stroke 1.58% 9.61% 8.03 pp 6.08
All-cause dementia 0.38% 4.97% 4.59 pp 13.08
Alzheimer’s disease 0.19% 2.55% 2.36 pp 13.42
Depression 3.91% 6.36% 2.45 pp 1.63
Sleep disorders 1.79% 3.68% 1.89 pp 2.06
Parkinson’s disease 0.51% 2.34% 1.83 pp 4.59
Anxiety 4.37% 5.64% 1.27 pp 1.29
Epilepsy 0.40% 1.20% 0.80 pp 3.00

Covariate-standardised absolute risk, derived by redistributing the cohort-wide incidence across the three groups using the Model 3 hazard ratios. These are the numbers that answer “what would this mean for a person of typical age in this cohort”:

Outcome Low Middle High Absolute difference Number needed to shift
Any brain disorder 11.98% 14.26% 22.53% 10.55 pp 9
Stroke 2.66% 4.25% 8.13% 5.47 pp 18
All-cause dementia 0.88% 2.22% 4.21% 3.33 pp 30
Depression 3.80% 3.99% 6.34% 2.55 pp 39
Alzheimer’s disease 0.43% 1.27% 2.19% 1.76 pp 57
Anxiety 4.46% 4.15% 5.71% 1.25 pp 80
Sleep disorders 2.06% 2.14% 3.19% 1.13 pp 88
Parkinson’s disease 1.00% 1.40% 1.87% 0.87 pp 115
Epilepsy 0.50% 0.72% 1.06% 0.56 pp 178

The “number needed to shift” column is a hypothetical that assumes causality. The MR results say it is not causal, so read these as ceilings, not targets.

Proxies for GDF15?

Because it’s a very uncommon blood measure (very hard to find and get tested for still today, but hopefully that will change soon), I looked into other inflammatory markers as possible proxies.

Correlation Between GDF-15, hsCRP, and IL-6

High-sensitivity C-reactive protein (hsCRP) and Interleukin-6 (IL-6) exhibit a statistically significant but moderate positive correlation with Growth Differentiation Factor 15 (GDF-15). Depending on the clinical context, such as chronic kidney disease, sepsis, viral infections, or general aging, correlation coefficients between these markers typically range from 0.30 to 0.65.

While these markers often trend upward concurrently during states of systemic illness, they cannot be used as direct proxies for GDF-15.

Divergent Biological Mechanisms

The primary reason hsCRP and IL-6 fail as proxies is that they are triggered by fundamentally different physiological processes.

  • Classical Inflammation: IL-6 is a pro-inflammatory cytokine that stimulates the liver to synthesize CRP. These markers act as acute-phase reactants. They are highly sensitive to acute bacterial or viral infections, physical trauma, autoimmune flare-ups, and active localized tissue damage.

  • Cellular and Mitochondrial Stress: GDF-15 is a member of the transforming growth factor beta superfamily. Rather than tracking acute immune responses, its secretion is heavily upregulated by mitochondrial dysfunction, cellular senescence, oxidative stress, and metabolic distress. It acts primarily as an adaptive cellular survival signal.

Why Proxies Fail in Practice

Relying on hsCRP or IL-6 to estimate GDF-15 levels will yield significant diagnostic blind spots.

  • False Negatives for Biological Aging: An individual can maintain optimized, near-zero hsCRP and IL-6 levels, indicating an absence of acute inflammation, yet simultaneously exhibit highly elevated GDF-15 driven by underlying mitochondrial decay, advancing cellular senescence, or occult cardiovascular stress.

  • False Positives from Acute Events: A minor infection, a minor physical injury, or even a bout of heavy eccentric resistance training can trigger a massive, transient spike in IL-6 and hsCRP. GDF-15 does not fluctuate wildly with minor acute immune events. It is a more stable metric of cumulative, long-term physiological burden.

  • Differing Predictive Utility: In prognostic literature evaluating longevity and disease risk, GDF-15 routinely outperforms hsCRP and IL-6 in predicting long-term risks for neurodegeneration, cardiovascular events, and all-cause mortality. This is because GDF-15 captures the underlying metabolic decay that precedes disease, rather than just the immune system reaction to it.

Since direct GDF-15 assays remain largely confined to research settings or specialized testing, you cannot mathematically derive its value from standard inflammatory panels.

GDF15 Blood Level and Rankings

UK Biobank Study Gradations

The cohort study utilized the Olink Proximity Extension Assay platform. This platform measures relative protein expression rather than absolute concentration. The unit of measurement is Normalized Protein eXpression, which is an arbitrary base 2 logarithmic scale. The researchers stratified the participants based on the statistical distribution within the dataset.

  • Low Group: Below the 25th percentile, corresponding to a value of -0.33.

  • Middle Group: Between the 25th and 75th percentiles.

  • High Group: Above the 75th percentile, corresponding to a value of 0.33.

International Laboratory Measures

Clinical blood tests in the United States and Europe measure absolute mass concentrations. The standard units are picograms per milliliter or nanograms per liter. These units are mathematically identical. Clinical environments utilize automated immunoassay platforms like the Roche Elecsys assay. Specialized reference laboratories often use Enzyme Linked Immunosorbent Assays.

Clinical Reference Ranges

Standard clinical thresholds were established during cardiovascular risk trials.

  • Low Risk: Below 1200 picograms per milliliter. This is the accepted upper reference limit for older populations without active disease.
  • Intermediate Risk: 1200 to 1800 picograms per milliliter. Levels in this tier indicate increased risk for cardiovascular disease, metabolic syndrome, and cancer.
  • High Risk: Above 1800 picograms per milliliter. This cut off identifies patients at elevated risk for major adverse cardiovascular events and mortality.

Consumer Clinic Targets

Functional medicine and longevity clinics utilize stricter optimization targets to evaluate biological aging rates.

  • Optimal: Below 600 picograms per milliliter.
  • Excellent: Below 400 picograms per milliliter.

Consumer Availability

GDF15 is not part of standard annual physical panels. It cannot be ordered directly through standard consumer portals at commercial laboratories as an independent wellness test. Physicians must order it as a specialized send out test processed by reference facilities, or it can be acquired through longevity focused clinics that utilize advanced diagnostic networks.

Are there any well-validated approaches to lowering (or keeping low) GDF15 levels in humans or mammals?

From Claude Opus 5:

Short answer: no. There is no well-validated approach to lowering GDF15 in humans, and the mammalian evidence argues the goal itself is probably backwards.

The directional problem comes first

Before ranking approaches, the premise needs testing, because the intervention literature is mostly a set of results running the wrong way.

In mice, overexpressing human GDF15 (the hNAG-1 transgenic) extends female mean lifespan by up to 43 percent, with lower body and adipose weight, lower serum IGF-1, insulin and glucose, better insulin sensitivity, and higher energy expenditure. The effect was larger on a high-fat diet. Going the other direction, Gdf15 deletion augments renal damage in both type 1 and type 2 diabetes models and worsens septic cardiac and renal injury, while overexpression protects kidneys from ischemia-reperfusion. [Confidence: High that the animal data point this way; Medium on translation]

The human intervention data agree. Caloric restriction and fasting raise GDF15. Metformin raises it, and in mice GDF15 is required for metformin’s weight effect. Empagliflozin raised GDF15 by 9 percent over 12 weeks in a placebo-controlled trial of 187 heart failure patients (ratio 1.09, 95% CI 1.03 to 1.15, p = 0.004), and the rise correlated with improvement in left ventricular volumes. Sleeve gastrectomy raises GDF15 in patients without metabolic syndrome. A 3-week low-carbohydrate or exercise intervention in 44 young adults raised fasting GDF15 from 302 to 340 pg/mL, and the participants whose GDF15 went up were the ones whose waist, fasting insulin, HOMA-IR and triglycerides improved.

So several of the better-validated healthspan interventions push this marker in the direction you were proposing to avoid. Combined with the null Mendelian randomisation in the paper, the most defensible reading is that GDF15 is an adaptive stress signal, and suppressing it is closer to disabling a response than removing a cause. [Confidence: Medium-High]

What actually lowers it, ranked by evidence

1. Smoking cessation. This is the only modifiable lever with a clean causal chain. In 3,936 adults profiled on two proteomic platforms, GDF15 climbed steeply with cigarette count in current smokers, and former smokers were not distinguished from never smokers. Mendelian randomisation supported smoking intensity causing higher GDF15 in both East Asian and European samples. [Confidence: High]

2. Preserving kidney function. GDF15 is renally cleared, and falling eGFR is one of the largest determinants of a high reading in older adults. Nothing here is a biohack; it means the ordinary management of blood pressure, glucose and nephrotoxic exposures. Note the circularity: GDF15 is also renoprotective in injury models, so a rising level in early CKD is partly compensation. [Confidence: Medium-High]

3. Treating a specific underlying driver. GDF15 is grossly elevated in ineffective erythropoiesis (beta-thalassemia, congenital dyserythropoietic anemia), heart failure, active malignancy and primary mitochondrial disease. Levels fall when the disease is treated. This is diagnostic value, not a longevity protocol. [Confidence: High]

4. Chronic aerobic training, contested. One 12-week RCT in prediabetes (n = 30 completers, 60 minutes at 50 to 70 percent max HR, three times weekly) reported GDF-15 falling from 669 to 383 ng/L, a 43 percent reduction, p < 0.001. That is a large effect, but it is a small single trial and it sits against the 3-week study above showing increases, and against consistent evidence that acute exercise raises GDF15 sharply. Timing of the blood draw relative to the last bout plausibly explains much of the disagreement. [Confidence: Low]

5. Statins, unverified. A trial reporting simvastatin reduced GDF-15 in COPD exists, but I could not retrieve the numbers, and there is no reason yet to treat this as established. [Confidence: Low]

Notably absent from the list: weight loss as such. Liraglutide-induced weight loss did not change total or intact GDF-15 in two separate human studies, and bariatric surgery raises it. Losing fat mass does not reliably lower this marker. [Confidence: Medium-High]

The practical read

Treat GDF15 as a gauge with four modifiable inputs: tobacco, kidney function, untreated inflammatory or hematologic disease, and metabolic stress. Fix those and the number follows. Target the number itself and you are, on current evidence, either wasting effort or interfering with an adaptive signal.

Two interpretation caveats worth carrying. If you are on metformin or an SGLT2 inhibitor, your GDF15 is drug-elevated and does not carry the same meaning as an equivalent untreated value, and no published risk stratification adjusts for this. And a rise after starting exercise or caloric restriction is most likely the intervention working, not a warning.

The genuine research gap is that nobody has tested whether lowering GDF15 in a non-cachectic human changes any hard outcome. Until someone does, the question of whether low GDF15 is a goal remains open, and the animal lifespan data lean against it.

Where might you be able to get a GDF15 Blood Test Done:

Clinics that explicitly offer it

YEARS (Berlin) is the only longevity clinic I found that names GDF15 as a standard included biomarker with public pricing. It sits in the Core panel of 87 biomarkers at €1,900, with Evolve at €7,600 (120+ markers, whole-body MRI, liquid biopsy) and Ultimate at €16,900 (230+ markers, genetics, microbiome). They interpret against Welsh et al. 2019 age and sex-specific ranges rather than a flat cutoff, which is the methodologically correct choice. [Confidence: High]

Lamkin Clinic (Oklahoma) publishes a GDF-15 interpretation page and offers it as a specialty lab service, using functional medicine ranges: optimal below 600 pg/mL, standard below 1,200, high risk above 1,800. No price is published and it requires a consultation. [Confidence: Medium, since the offering is stated but not priced]

WePrevent, a US longevity referral network , does not run the test but estimates $75 to $150 out of pocket, explicitly noting it is treated as elective wellness testing and not insurance covered. That is an estimate from a referral site rather than a quoted lab price, so treat it as a rough anchor. [Confidence: Low on the exact figure]

The actual lab route most clinics use

Almost every US clinic ordering GDF15 is sending it to Mayo.

Provider Details Price
Mayo Clinic Laboratories Test ID GDF15, unit 64637. ELISA, CPT 83520, turnaround 9 to 16 days, reference ≤750 pg/mL for age 3 months and up Not public, client login required
Cleveland Clinic Laboratories Same test, send-out to Mayo, identical specs Not published
Roche Elecsys GDF-15 Automated ECLIA on cobas analyzers, IVD, indicated for ACS and chronic heart failure risk stratification and major bleeding risk in atrial fibrillation. Received FDA Breakthrough Device Designation in 2021 for identifying cancer patients with unintentional weight loss Not published, lab contract pricing

For a cost floor: the R&D Systems Human GDF-15 Quantikine ELISA kit lists at $779.09 for one 96-well plate. Run in duplicate with a standard curve, that is roughly 36 to 40 samples, so about $20 per sample in reagent alone. A $75 to $150 self-pay charge is a plausible markup on that. Anything materially above it is margin.

Where it is not available

I checked the large direct-to-consumer platforms and GDF-15 is absent from all of them: Function Health (160 biomarkers), Blueprint/Immortals ($365 per year, 100+ biomarkers), Marek Diagnostics, and the Justlabs Longevity & Aging Panel ($149). It also did not surface on the standard Quest Health, Labcorp OnDemand, Ulta Lab Tests or Request A Test menus. [Confidence: Medium-High, since absence from a search is weaker evidence than presence]

Four problems before you order it

Platforms are not interchangeable. The UK Biobank paper you sent used Olink NPX, an arbitrary log2 scale. Mayo reports pg/mL by ELISA, Roche reports pg/mL by ECLIA. None of those quartile cutoffs transfer, and even the two pg/mL assays are not guaranteed to agree.

Reference ranges are incoherent across providers. Mayo uses a flat ≤750 pg/mL for everyone over three months old. Lamkin calls under 600 optimal. Welsh et al. put the median at roughly 537 pg/mL for men under 30 and roughly 2,152 pg/mL for men over 80. A flat 750 cutoff would flag most healthy people past 60 as abnormal, which tells you the range was built for mitochondrial myopathy screening, not aging.

The validated intended uses are neither of the things a biohacker wants. Mayo’s is mitochondrial myopathy workup. Roche’s is cardiovascular risk stratification. Ordering it to gauge aging rate is off-label use of a test with no outcome data showing that acting on the result improves anything.

Assay-genotype interference is real. The rs1058587 (H202D) variant disrupts antibody binding in some immunoassays, producing falsely low readings in carriers. Roche designed Elecsys to be insensitive to this. Not all ELISAs are, and vendors rarely state it. [Confidence: Medium-High]