no problem. but my aches started many decades ago when I started on statins. it was 1990. I remember because i was sent to Korea on orders that yr and started them there. a little purple colored one was the first statin of many to follow.
1 Like
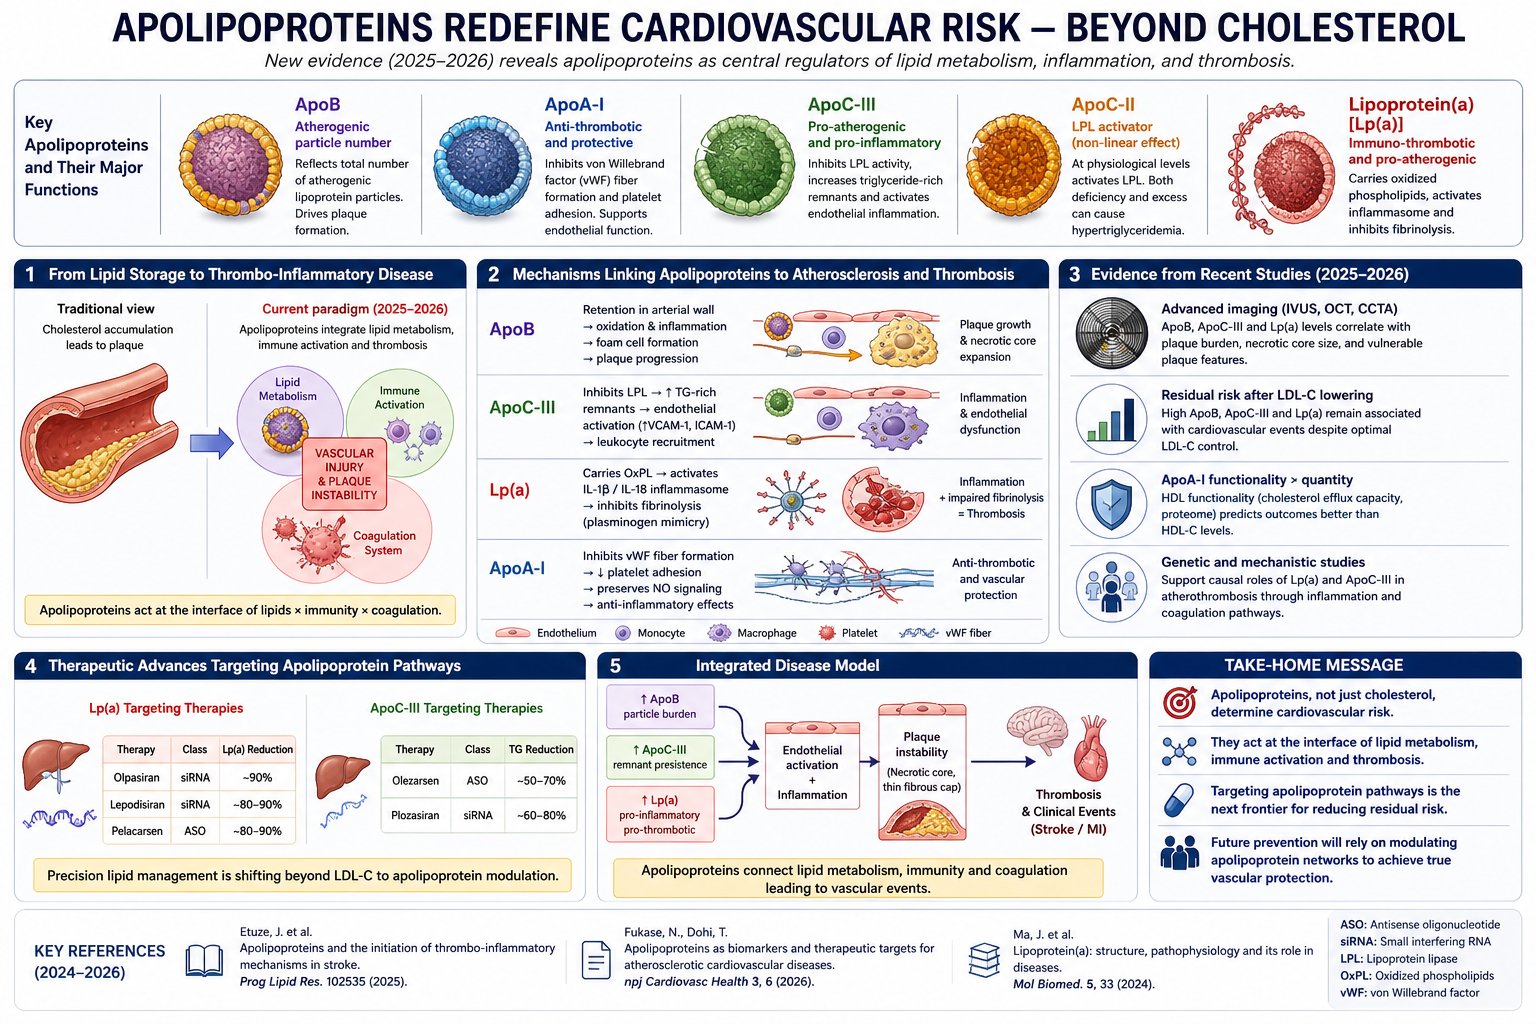
Its an interesting chart. One of my labs gives ApoA-I and I had not looked at it before. I have just looked at it and it varies quite a bit. I think I will try to find how how it varies (in the sense of what exogenous substance causes it to vary). That will have to wait as a project.
I managed to get an LLM to convert my lab tracker to a spreadsheet. I am not sure it worked that well, but this the variation: mg/dL
202.60 167.60 187.30 174.60 178.00 194.50 204.40 201.50 174.00 202.90 164.40 185.70 187.30 190.10 226.40 185.50 198.30 187.30 181.80 200.10 216.30 200.90 190.60 205.20 159.80 177.20 176.40 202.40 172.90 183.10 189.70 168.30 167.80 172.10 165.70 161.60 179.50 200.70 185.60 168.40 173.20 184.10 194.50 176.70 166.20 161.70 169.30 163.60 176.20 176.70 169.20 171.50 171.40 172.50 159.40 150.40 153.30 168.00 158.40 173.90 162.10 166.20 161.20 188.20 190.60
The Genetic Art of Avoidance: Why Your Heart is the Secret to Living Past 100
For decades, the search for “longevity genes” has often felt like hunting for a needle in a haystack. However, new research from the Leiden Longevity Study suggests we may have been looking at the problem backward. Instead of possessing rare “super-genes,” the secret to reaching exceptional ages may lie in the simple absence of genetic “bad luck”—specifically regarding heart health.
By analyzing over 420 long-lived families across three generations, researchers found that the more long-lived ancestors an individual has, the lower their polygenic score (PGS) for coronary artery disease (CAD). This isn’t just a correlation; the study utilized accelerated failure time modeling to demonstrate that a low genetic risk for CAD explains between 14% and 20% of the delay in cardiovascular disease onset seen in these families. Essentially, longevity is fueled by an inherited “shield” against the world’s leading cause of death.
Perhaps most striking was the discovery of a specific cholesterol-metabolism-PGS. While the APOE gene is often cited as the primary driver of cardiovascular longevity, this study identified a separate cluster of 49 to 52 SNPs related to lipid handling that predicted survival even after APOE was removed from the equation. This suggests that the way our bodies manage lipoproteins—beyond just the famous “longevity alleles”—is a fundamental pillar of human lifespan.
For those aiming for the “nonagenarian” finish line, the message is clear: your family’s history of heart health is a quantitative predictor of your own aging trajectory. While we cannot yet edit our polygenic scores, this data reinforces that cardiovascular maintenance is the primary mechanical hurdle between a standard lifespan and a century of health.
Actionable Insights
-
Prioritize Advanced Lipid Profiling: Since cholesterol metabolism pathways were found to be central to 90+ survival independent of APOE , biohackers should move beyond standard LDL-C tests. Focus on ApoB , LDL particle number , and triglyceride levels , as these reflect the underlying lipoprotein signature associated with familial longevity.
-
Quantify Familial Risk: Use the Longevity Relatives Count (LRC) score logic. If more than 30% of your ancestors reached the top 10% of their birth cohort’s survival, you likely carry a lower “genetic burden” for CAD.
-
Targeted Cardiovascular Intervention: Because CAD risk alleles explain 20% of the delay in disease onset, aggressive management of cardiovascular “soft” markers (blood pressure, arterial stiffness) is the most evidence-based path to mimic the “protected” phenotype of long-lived families.
-
Contextualize Genetics with Environment: A PGS is a prediction, not a decree. The 80% of cardiovascular disease onset left unexplained by this study is likely driven by gene-environment interactions —meaning lifestyle choices can still override high-risk genetic scores.
Source:
- Open Access Paper: Low genetic risk for coronary artery disease underlies multigenerational longevity and healthy aging
- Institution: Leiden University Medical Center (LUMC).
- Country: The Netherlands.
- Journal Name: GeroScience.
- Impact Evaluation: The impact score of this journal is 7.5 (2023 JIF), evaluated against a typical high-end range of 0–60+ for top general science, therefore this is a High impact journal within the specific field of Geriatrics and Geroscience.
2 Likes
The Social Scaffolding of Longevity: Why Your Mindset and Education Dictate Your Cardiovascular Age
While chronological age is a fixed count of years, biological age is a variable rate of decay. New research from the Inlife-Aging Project suggests that for middle-aged and older adults, the speed of this decay is significantly influenced by psychosocial architecture. By utilizing the American Heart Association’s “Life’s Essential 8” (LE8) framework—a metric covering diet, activity, sleep, nicotine exposure, BMI, lipids, glucose, and blood pressure—researchers identified that most individuals reside in a “moderate” cardiovascular health (CVH) purgatory.
The “Big Idea” here is the “weathering” hypothesis: chronic psychosocial stressors, such as financial hardship or low educational attainment, act as biological accelerators. These stressors do not just make life difficult; they physically degrade the body’s physiological maintenance capacity through “inflammaging” and the accumulation of senescent cells.
The study found a stark demographic divide. Middle-aged women emerged as the “longevity elite,” exhibiting the most favorable CVH profiles, likely due to higher engagement in protective health behaviors. Conversely, older men scored the lowest, particularly in health factors like blood pressure and glucose regulation. Interestingly, while participants excelled at maintaining physical activity and sleep, their diet quality was a statistical disaster, scoring the lowest among all metrics.
Ultimately, the strongest predictors of a resilient heart were not just physical metrics, but educational attainment and “self-rated health”—how a person perceives their own vitality. This suggests that your internal narrative and your access to health literacy are as much a part of your cardiovascular system as your arteries.
Actionable Insights
-
Prioritize Diet Quality: Diet was the lowest-scoring component (40.8 ± 31.7). For longevity seekers, this is the highest-leverage area for improvement. Focus on high-quality, nutrient-dense intake to move from “moderate” to “high” CVH.
-
Leverage Educational Literacy: Educational attainment (≥ 12 years) strongly correlated with better BMI, glucose, and blood pressure. Actively seeking health education and literacy can act as a buffer against environmental stressors.
-
Monitor Subjective Vitality: Your “self-rated health” is a potent indicator of physiological reserve. If you perceive your health as “Poor-Fair,” it correlates with lower physical activity and worse clinical markers. Addressing the psychological perception of health is as vital as the physical reality.
-
Mitigate Depressive Symptoms: Clinical depressive symptoms were negatively associated with physical activity, nicotine exposure, and sleep health. For those in the 50–79 age bracket, mental health maintenance is a direct cardiovascular intervention.
Context
- Open Access Paper: Associations of psychosocial factors with cardiovascular health in aging: insights from the Inlife-Aging Project
- Institution: MOVE-IT Research Group, Universidad de Cádiz.
- Country: Spain.
- Journal Name: GeroScience.
- Impact Evaluation: The impact score of this journal is 5.6 (2024 CiteScore), evaluated against a typical high-end range of 0–60+ for top general science, therefore this is a High impact journal within the specialized field of geroscience.
2 Likes
How Cardiovascular Health Calibrates the GrimAge Clock
Chronological age is a fixed variable, but biological age is proving to be a highly plastic metric. Research from the INSPIRE-T cohort in France reveals a critical, bidirectional relationship: your cardiovascular health (CVH) doesn’t just prevent heart attacks; it actively slows the molecular ticking of your epigenetic clock. Conversely, an accelerated “GrimAge” clock is now identified as a potent risk factor for future cardiovascular events, independent of how many birthdays you have celebrated.
The study analyzed nearly 1,000 individuals aged 20 to 100, measuring their adherence to the American Heart Association’s “Life’s Essential 8” (LE8)—a score covering diet, activity, sleep, nicotine, BMI, lipids, glucose, and blood pressure. The results were stark: those with optimal cardiovascular health showed significantly younger biological ages. Interestingly, this protective effect was most pronounced in men and younger individuals, suggesting that the “longevity dividends” of a healthy lifestyle are greatest when established early in life.
While five different epigenetic clocks and one inflammatory clock (iAge) were tested, GrimAge emerged as the superior predictor. This clock is unique because it incorporates “surrogate” markers of plasma proteins and smoking history that are directly linked to morbidity and mortality. The data suggests that by optimizing behavioral factors—specifically smoking cessation and BMI—you can effectively “re-program” your epigenetic profile to reflect a younger, more resilient phenotype.
Actionable Insights
To maximize longevity and slow epigenetic aging, the data suggests four primary levers:
-
Aggressive Smoking Cessation: Nicotine exposure was the strongest behavioral driver of accelerated epigenetic aging across both sexes. Moving toward a “non-smoking ideal” provides the most significant reduction in GrimAge.
-
Early-Life Intervention: The association between cardiovascular health and slower aging is significantly stronger in individuals under 40. Prevention must start decades before clinical symptoms appear. [Confidence: High]
-
Sex-Specific Optimization: Men appear to derive a greater “epigenetic discount” from physical activity, optimal sleep, and blood pressure control than women. For women, BMI and smoking were more dominant predictors.
-
Targeted Biomarker Monitoring: Use the GrimAge clock for biological age testing. Other clocks like Hannum or Horvath may not capture the specific cardiovascular burden reflected in your epigenetic signature. [Confidence: High]
Source:
- Open Access Paper: Bidirectional associations between biological aging,cardiovascular health, and cardiovascular risk: findings from the INSPIRE‑T lifespan cohort
- Institution: CERPOP, Université de Toulouse, Inserm.
- Country: France.
- Journal Name: GeroScience .
- Impact Evaluation: The impact score (JIF) of this journal is approximately 5.6–7.5, evaluated against a typical high-end range of 0–60+ for top general science, therefore this is a High impact journal within the specialized field of aging and geroscience.
Related Reading:
2 Likes
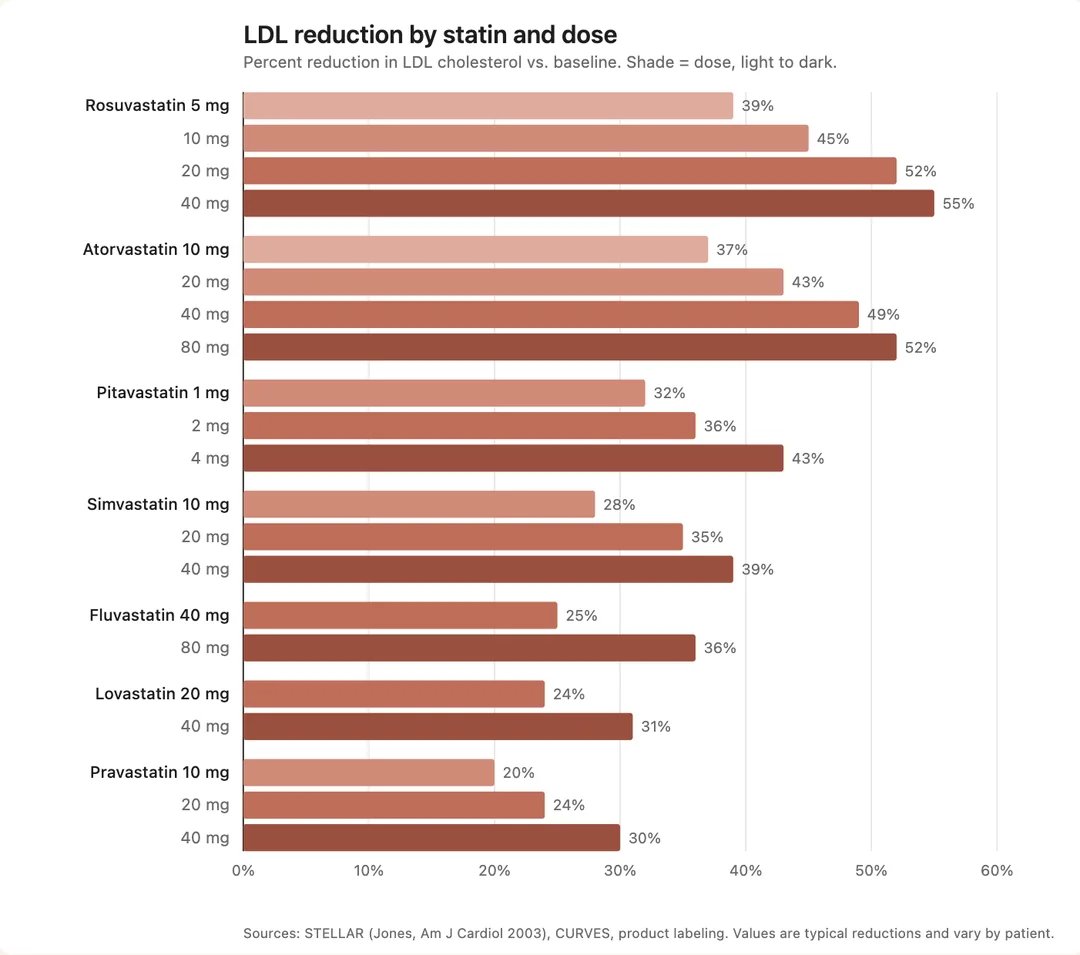
Max dose is 4mg. They don’t make 6mg pills.
1 Like
The highest dose pitavastatin that is marketed is 4mg. When they developed this statin, they decided to position it as a medium intensity statin in the market. There were trials of 8mg doses with apparently good results, but because the MOA was somewhat novel, they decided to go with 4mg as max, out of an abundance of caution. As a result, ever since, all the clinical data from the patients out there have been from 1/2/4 mg doses. Therefore other than the studies with 8mg there simply are no large scale longitudinal data sets for higher doses. So if taking higher doses 6, 8mg you can’t point to long term outcomes. It’s an unknown. Probably it’s fine, and there certainly are people (including on this site) who take 6mg or higher, but nobody can say “here are the outcomes for 6/8mg”. And most physicians will not prescribe doses without data and not marketed by the pharma company. Bottom line, it represents a gamble. Most people are not going to gamble.
3 Likes
If you try this higher dose level, please post pre and post LDL-C numbers so we can identify the benefit (or lack thereof).
3 Likes
20% of people seem naturally protected from high LDL-C for various reasons. 80% of people are not.
2 Likes
I buy my pitavastatin in 2 mg pills for about $0.12 each. Right now I am at 2 mg, and I will be going to 4 mg since my LDL/ApoB is in the 48-58 range (probably closer to the high end). I just want to keep it reliably around 50. Thank you for sharing the 8 mg information. I would think 8 mg should be OK since many of the other statins have higher risks of side effects and have a lot higher comparable doses. After I measure 4 mg, I’ll consider 6 mg.
1 Like
post moved to canagliflozin thread.
Higher doses of Pitavastatin were tested (e.g. 8mg and 16mg) but were found to have significantly higher rates of myalgia. I would be wary of going high dose on it. Instead I think adding low doses of other drugs might be a better risk / reward tradeoff.
6 Likes
In a Cochrane Review of effectiveness of pitavastatin as a lipid therapy they looked at doses up to 16mg. And as for adverse effects, it highlights the continuing problem of insufficient data for this statin - there were not enough data to determine risk of withdrawal due to adverse effects due to pitavastatin.
Pitavastatin for lowering lipids
“ People taking 1 mg to 16 mg of pitavastatin per day lowered their LDL cholesterol by 33.3% to 54.7%. The higher the dose, the lower the levels of three measures of cholesterol. The average increase in HDL cholesterol for all doses was 4%.
For lowering LDL cholesterol, pitavastatin is 6‐times stronger than atorvastatin, 1.7‐times stronger than rosuvastatin, 77‐times stronger than fluvastatin and 3.3‐times weaker than cerivastatin.[Cerivastatin was withdrawn from the market due to unacceptably high adverse effects - CT].
In the RCTS, no person out of 109 in the placebo group and three out of 262 people in the pitavastatin group dropped out due to adverse effects.
Certainty of the evidence
There is a high level of trust around the effects of pitavastatin on total cholesterol, LDL cholesterol and triglycerides.”
However, caution must be exercised when taking pitavastatin and two other drugs simultaneously: valsartan and allopurinol.
Possibility of Multiple Drug-Drug Interactions in Patients Treated with Statins: Analysis of Data from the Japanese Adverse Drug Event Report (JADER) Database and Verification by Animal Experiments
4 Likes
I tried to dig out the studies where I recall seeing the values but I’m having trouble getting the original ones. However I did locate the following:
Libalo (pitavastatin) tablet label
Doses of L1VALO greater than 4 mg once daily were associated with an
increased risk for severe myopathy in premarketing clinical studies.
Also the below one:
Summary of discontinuations in trials up to 64mg for CSR
| Search Group | Study Number | Patient Number | Dose (mg) | SAE? | Discontinued study treatment? | Location of narrative in CSR |
|---|---|---|---|---|---|---|
| Group 1 | 301 | 310-208-014 | 2 | No | Yes (Due to abnormal lab value) | Page 115, Section 12.4.1.3.1; Page 117, Section 12.4.1.3.2 |
| Group 1 | 305 | 305-111-022 | 4 | No | No | Page 150, Section 12.4.1.2; Page 152, Section 12.4.1.3.2 |
| Group 3 | 307 | 301-207-205 | 4 | No | Yes | Page 392, Section 14.3.3 |
| Group 1 | NKS104/A2204 | 0002/00013 | 8 | Yes | Yes | Page 72 (page 73 as pdf file), Section 2.5 |
| Group 1 | NKS104/A2204 | 0070/00013 | 8 | Yes | Yes | Page 73 (page 74 as pdf file), Section 2.5 |
| Group 1 | 209 | 002-025 | 16 | No | Yes | Page 75 (page 78 as pdf file) |
| Group 1 | 209 | 012-008 | 16 | No | Yes | Page 80 (page 83 as pdf file) |
| Group 1 | 209 | 013-007 | 16 | No | Yes | Page 81 (page 84 as pdf file) |
| Group 1 | 209 | 024-005 | 16 | No | Yes | Page 84 (page 87 as pdf file) |
| Group 1 | 209 | 026-019 | 16 | No | Yes | Page 86 (page 89 as pdf file) |
| Group 1 | 209 | 035-001 | 16 | No | Yes | Page 90 (page 93 as pdf file) |
| Group 1 | 209 | 048-020 | 16 | No | No | Not available |
| Group 1 | 209 | 002-009 | 32 | No | No | Not available |
| Group 1 | 209 | 023-004 | 32 | Yes | Yes | Page 97 (page 100 as pdf file) |
| Group 1 | 209 | 023-010 | 32 | No | No | Not available |
| Group 1 | 209 | 026-002 | 32 | Yes | Yes | Page 99 (page 102 as pdf file) |
| Group 1 | 209 | 027-002 | 32 | No | Yes | Page 109 |
| Group 1 | 209 | 033-001 | 32 | No | No | Not available |
| Group 1 | 209 | 037-001 | 32 | Yes | No | Page 101 (page 104 as pdf file) |
| Group 1 | 209 | 049-007 | 32 | No | No | Not available |
| Group 1 | 209 | 002-011 | 64 | No | No | Not available |
| Group 1 | 209 | 026-021 | 64 | No | Yes | Page 115 |
| Group 1 | 209 | 045-008 | 64 | Yes | Yes | Page 105 (page 108 as pdf file) |
Not exactly clean info but it is suggestive.
Certainly there is an increase in reports starting with 8mg, but it’s not super consistent in that some were discontinuations due to lab values alone without actual adverse effects reports, and at all doses there were of course groups with neither adverse effects nor abnormal lab values at every dose (up to 64mg). Nonetheless, certainly the tendency was there with increasing dosages 8mg and above. I think it’s prudent to stay at 4mg, not because you’re guaranteed to experience sides with higher doses, but because again, we don’t have long term reports of clinical experience with higher doses. For that matter no dose is “safe” in clinical practice of large numbers of patients, because some experience myalgia even at 1mg - no medication works for absolutely everybody, certainly statins. I believe there are a couple of people even on this site who reported myalgia from all doses of pita - some people are simply completely intolerant of statins, period.
3 Likes
Yes I agree with your conclusion. There are likely many people that would tolerate more than 4mg without major issues. It’s just a question of what probabilities each person is ok with.
1 Like