Your Organs Do Not Age Together: AI Reads 25,000 Tissue Slides and Finds the Body Ages in Waves

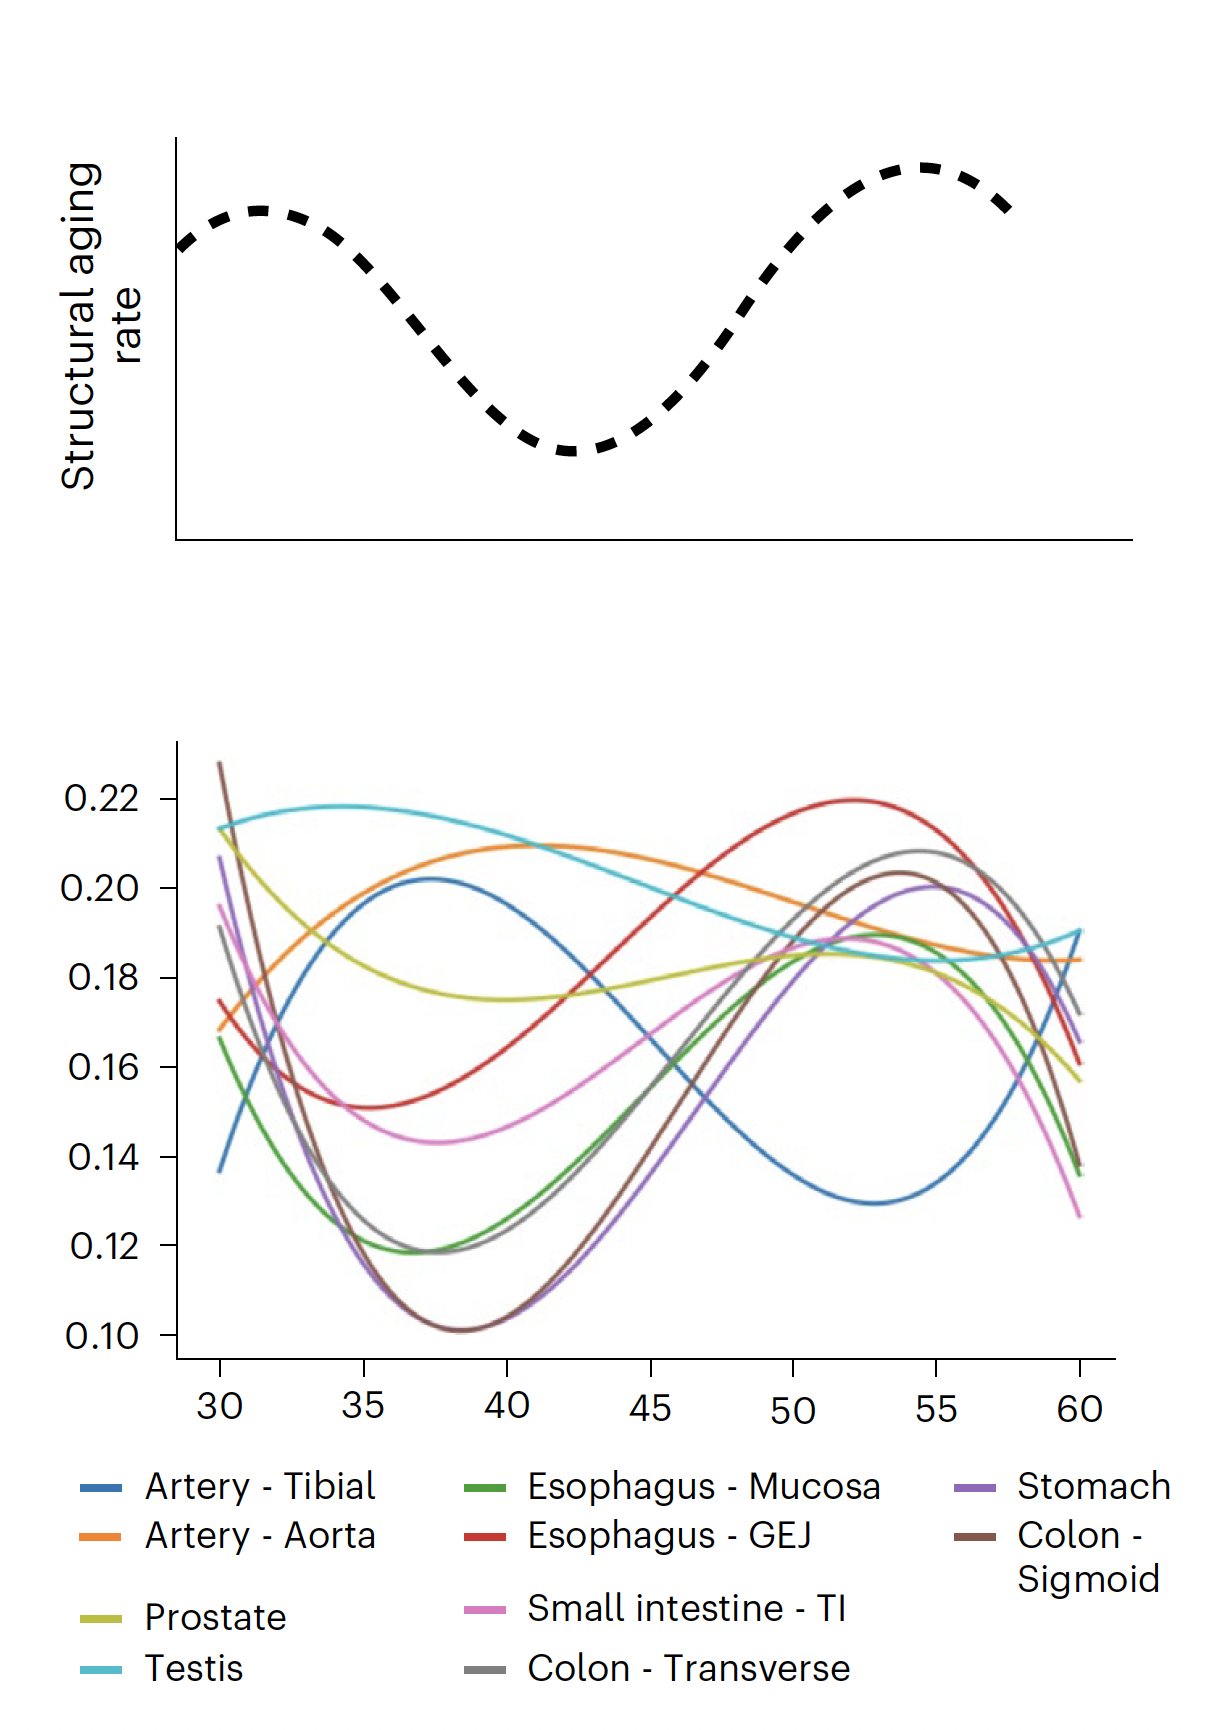
Researchers at Sanford Burnham Prebys built a computational tool called PathStAR that measures how fast the physical architecture of a tissue changes per year of life, reading it directly from ordinary hematoxylin and eosin stained pathology slides. Critically, the tool was never trained to guess a donor’s age, so it cannot simply learn the linear “clock” pattern that age-prediction models are built to find. Applied to 25,306 post-mortem biopsies from 40 tissues in 970 donors aged 21 to 70, it shows that structural aging is not a slow smooth slide. It arrives in discrete bursts, and the timing of those bursts differs by organ. Arteries and the tibial nerve remodel fastest in the 30s. The uterus and vagina stay structurally quiet until the early-to-mid 50s and then change abruptly around menopause. Most tissues examined, including the digestive tract and male reproductive organs, show two separate acceleration windows, one in the 30s and one around the 50s. Across every organ, these acceleration periods share the same molecular signature: inflammation up, energy production down, DNA repair and protein quality control down. People who age fast in one organ tend to age fast in related organs.

For a decade, the aging field has been dominated by clocks: molecular readouts, mostly DNA methylation, that estimate how old you are and how fast you are getting older. Those clocks work well. They also have a hidden design flaw. They are trained to predict chronological age, which is a straight line, so they tend to report aging as a straight line. Reality may be lumpier than that.

A team led by Sanju Sinha took a different route. Instead of chemistry, they measured architecture: the physical organization of cells, blood vessels and connective tissue that actually determines whether an organ works. They fed routine pathology slides from the GTEx tissue bank into a vision model trained on 100,000 whole-slide images, then asked a deliberately naive question. Between any two adjacent decades of life, how much did the tissue’s structure change? No age prediction, no training target, just the size of the shift.

The answer was that the body does not age on one schedule. It ages on several. Blood vessels change most in the 30s, decades before anyone thinks about heart disease. Female reproductive tissue holds steady, then transforms around menopause. Nine of fourteen tissues showed a double-peaked pattern with two separate storms of remodeling.

The validation is elegant. Applied to the ovary, whose functional decline is already known in detail, the method independently recovered both landmarks: the fertility drop of the late 30s and menopause in the 50s. Molecular profiles from the very same biopsies could not do this. A methylation clock built on those samples was accurate to within about 4.3 years, yet it drew aging as a straight downhill line and missed both events entirely.

Two other findings stand out. First, the two acceleration windows are biologically different. The early one is dominated by collapsing hormone signaling. The later one is dominated by damage response, unfolded protein stress and DNA repair burden. Second, aging is coordinated within a person. Someone with a fast-aging colon tends to have a fast-aging esophagus and stomach, and, unexpectedly, a fast-aging prostate.

This is an atlas, not a therapy. Nothing here was treated, and nobody was followed over time. Its value is a map of when to intervene where, and a structural yardstick against which future geroprotectors could be measured.

Actionable Insights

This paper tests no drug, supplement or behavio. What it changes is timing and target priority.

The clearest signal is vascular. Arteries showed their peak rate of structural change in the 30s, with atherosclerotic change rising steepest during the 30s versus the 20s and then plateauing. Cardiovascular prevention is conventionally framed as a 50s concern; this data says the architecture is being decided twenty years earlier. Proactive cardiovascular monitoring and intervention must begin much earlier than conventional clinical guidelines suggest. Early aggressive lipid management and endothelial support are critical to intercept this early-onset deterioration.

On magnitude, be sober. Age explains a modest share of structural variation in most organs: about 7 percent in subcutaneous fat, 15 to 18 percent in arteries, 23 percent in tibial nerve, and 44 to 51 percent in ovary and uterus, which are the outliers. Translated into a familiar effect size, the best tissues separate young from old donors at roughly Cohen’s d of 0.95 to 1.2, which is large, while most tissues sit far below that. Individual variation dominates.

The pathology links are real but moderate. Donors with skeletal muscle atrophy had structural aging scores roughly 0.55 to 0.6 standard deviations above those without, and aortic calcification about 0.3 standard deviations. Those are small-to-medium effects, not deterministic ones.

Practical read: keep vascular and metabolic work early and continuous, treat perimenopause as a genuine structural inflection rather than a symptom window, and treat any molecular clock result as a linear approximation that will miss short bursts.

Context and Source

  • Open Access Paper: Mapping structural aging across human tissues reveals tissue-specific trajectories and coordinated deterioration
  • Institutions: Center for Data Science and Artificial Intelligence, Sanford Burnham Prebys Medical Discovery Institute, La Jolla, California; with the Cancer Data Science Lab, National Cancer Institute, NIH, Bethesda; the Eunice Kennedy Shriver National Institute of Child Health and Human Development; and Cedars-Sinai Medical Center, Los Angeles.
  • Country: United States
  • Journal: Nature Aging (published online 31 August 2026, article type “Analysis”)
  • Impact evaluation: The impact score of this journal is 25.0 (2025 Journal Impact Factor; 5-year JIF 26.0), evaluated against a typical high-end range of 0 to 60+ for top general science, therefore this is a High impact journal.
1 Like

Biomarker Data (Effect Size Extraction)

There are no lifespan numbers, no median or maximum survival extension, and no treatment-versus-control percentages, because there was no treatment. What exists are association strengths. Below they are converted into standardized effect sizes and plain-language magnitudes.

A note on the units used here. Cohen’s d is the gap between two groups measured in standard deviations. Roughly, 0.2 is small (you would not notice it in an individual), 0.5 is medium, 0.8 is large, and above 1.0 the two groups barely overlap. R-squared is the percentage of variation explained: an r-squared of 0.15 means age accounts for 15 percent of why tissues differ from one another, and the other 85 percent is individual variation, disease, technical noise and chance.

How strongly does age predict tissue structure

Variance in structure explained by chronological age, by tissue (r-squared, ordinary least squares on PC1-2):

Tissue r-squared Percent of variation explained Approximate Cohen’s d equivalent
Uterus 0.51 51 2.04
Ovary 0.44 44 1.77
Fallopian tube 0.33 33 1.40
Nerve, tibial 0.23 23 1.09
Vagina 0.22 22 1.06
Colon, transverse 0.21 21 1.03
Artery, aorta and artery, tibial 0.18 18 0.94
Prostate 0.17 17 0.90
Testis 0.17 17 0.90
Artery, coronary 0.15 15 0.84
Skin, sun exposed 0.10 10 0.67
Adipose, subcutaneous 0.07 7 0.55
Liver 0.03 3 0.35
Breast, mammary 0.00 0 0.00

The d column converts r-squared to a two-group separation and should be read as an upper-bound illustration, not a measured statistic. The honest summary: in the reproductive tract, age is the dominant driver of structure. Everywhere else, age is a minority contributor and person-to-person variation is larger than the aging signal. [Confidence: High for the r-squared values as reported, Medium for the d conversions]

The paper’s own discrimination metric agrees. Best-case one-versus-rest AUC for separating 10-year age groups was 0.75, which corresponds to Cohen’s d of about 0.95. An AUC of 0.75 means that if you draw one younger and one older sample at random, the model ranks them correctly 75 percent of the time. Useful, well short of diagnostic.

Structural aging rate: absolute magnitudes

The structural aging rate is a unitless quantity (mean absolute per-feature morphological change per year across 1,024 image features), so percentages are the interpretable form.

  • Coronary artery: rate falls from about 0.24 at age 30 to about 0.13 by age 58. The early-30s rate is therefore roughly 85 percent higher than the late-50s rate. Vascular remodeling front-loads into the 30s. [Confidence: High]
  • Uterus: rate rises from about 0.22 at age 40 to a peak of about 0.51 at age 54, a 130 percent increase, then declines. This is the single largest tissue-level acceleration in the dataset and it aligns with menopause. [Confidence: High]
  • Vagina: rises from about 0.19 to about 0.26, roughly 37 percent, over the same window. Same direction, one third the magnitude.
  • Ovary: bimodal, with peaks at ages 35 to 40 (rate about 0.30) and 55 to 60 (rate about 0.31), separated by a trough of about 0.22 near age 46. Peak-to-trough is roughly 40 percent.
  • Tibial nerve: high early rate declining from about 0.18 at 30 to about 0.13 by 58, roughly a 28 percent fall. Early neural remodeling was unexpected and is flagged by the authors as warranting follow-up.

Individual delta structural aging score versus pathology

These are the most clinically legible effects. The paper reports Wilcoxon rank-sum P values; standardized effect sizes below are derived from the reported P values and group sizes (d approximated via r = z / square root of N). Treat them as estimates.

Association n present vs absent Reported P Estimated r Estimated Cohen’s d
Skeletal muscle atrophy 106 vs 788 2.97 x 10^-16 0.27 0.57
Testis atrophy 38 vs 500 2.32 x 10^-13 0.32 0.66
Aortic calcification 53 vs 735 6.64 x 10^-5 0.14 0.29
Skeletal muscle fibrosis 17 vs 877 1.6 x 10^-4 0.13 0.26

Plain language: donors whose muscle was pathologically atrophic scored about 0.6 standard deviations older structurally than donors whose muscle was not. That is a medium effect. It confirms the score is measuring something real and clinically recognizable, but it is nowhere near strong enough to classify an individual. Note also the direction of inference is circular in part, since both the pathology annotation and the structural score derive from tissue morphology.

Cross-organ coordination (within-individual correlations of delta structural aging)

Organ system Pearson r range Implied shared variance Cohen’s d equivalent
Brain (cerebellum with cortex), male donors 0.55 30 percent 1.32
Uterus with vagina 0.47 to 0.48 about 23 percent 1.09
Gastrointestinal (colon, esophagus, stomach) 0.20 to 0.43 4 to 18 percent 0.41 to 0.95
Brain, female donors 0.40 16 percent 0.87
Nerve tibial with arteries 0.23 to 0.28 5 to 8 percent 0.47 to 0.58
Cardiac, across all tissues 0.20 4 percent 0.41
Digestive with prostate 0.14 to 0.25 2 to 6 percent 0.28 to 0.52
Vascular (tibial, coronary, aorta) 0.14 to 0.16 about 2 percent 0.28 to 0.32

Interpretation: “coordinated aging” is real but weak for most pairs. The digestive-to-prostate axis, which the authors present as their most novel cross-system finding, has r of 0.14 to 0.25, meaning it explains 2 to 6 percent of shared variance. That is a hypothesis, not a mechanism. The strong coordination is intra-system (uterus with vagina, brain regions with each other), which is closer to expected.

Mechanistic Deep Dive

The convergent molecular program during every acceleration period, across every organ system, was: inflammation up, energy production down, proliferation down, quality control down.

  • mTOR: mTORC1 signaling was suppressed during accelerated structural aging in the majority of tissues, with significant negative normalized enrichment scores in aorta, tibial artery, tibial nerve, esophagus, stomach and prostate (P below 0.001 in several). Testis ASA-2 was a notable exception with strong positive mTORC1 enrichment. This complicates the naive geroscience framing that aging equals high mTOR. In bulk post-mortem tissue, the acceleration windows look more like failure of anabolic and proliferative capacity than like mTOR overdrive. Whether that is causal aging or a compensatory collapse downstream of it is not resolvable here. Practically, it argues against assuming that blanket mTOR inhibition is beneficial in every tissue at every age, and is at least consistent with intermittent rather than continuous dosing logic. [Confidence: Low to Medium, this is bulk transcriptomics from post-mortem tissue and cannot separate cell-type composition shifts from per-cell signaling changes]

Critical Limitations

Ruthlessly:

  1. Post-mortem, cross-sectional, single time point per donor. No individual was followed. Every trajectory in this paper is assembled from different people at different ages, so “acceleration in the 30s” is a population-level construct that may not describe any actual person. Cohort effects (a 65-year-old in GTEx lived a different life from a 25-year-old) are entirely unadjusted. [Confidence: High that this is a serious limitation]
  2. No functional outcome, no survival, no clinical follow-up. The claim that structural aging “may track functional decline more directly than molecular markers” is asserted, not demonstrated. The ovary case is the only tissue where structural trajectory was checked against known functional decline, and that check was qualitative pattern matching, not a quantitative correlation with any individual’s fertility or hormone status. [Confidence: High]
  3. Degeneration is not distinguished from adaptive remodeling. The authors concede this outright. The structural aging rate measures any morphological change, so compensatory hypertrophy, benign fibrosis and neutral architectural variation all score identically to pathological deterioration. There is currently no feature extractor that can separate them. This undercuts the interpretation of every trajectory in the paper.
1 Like