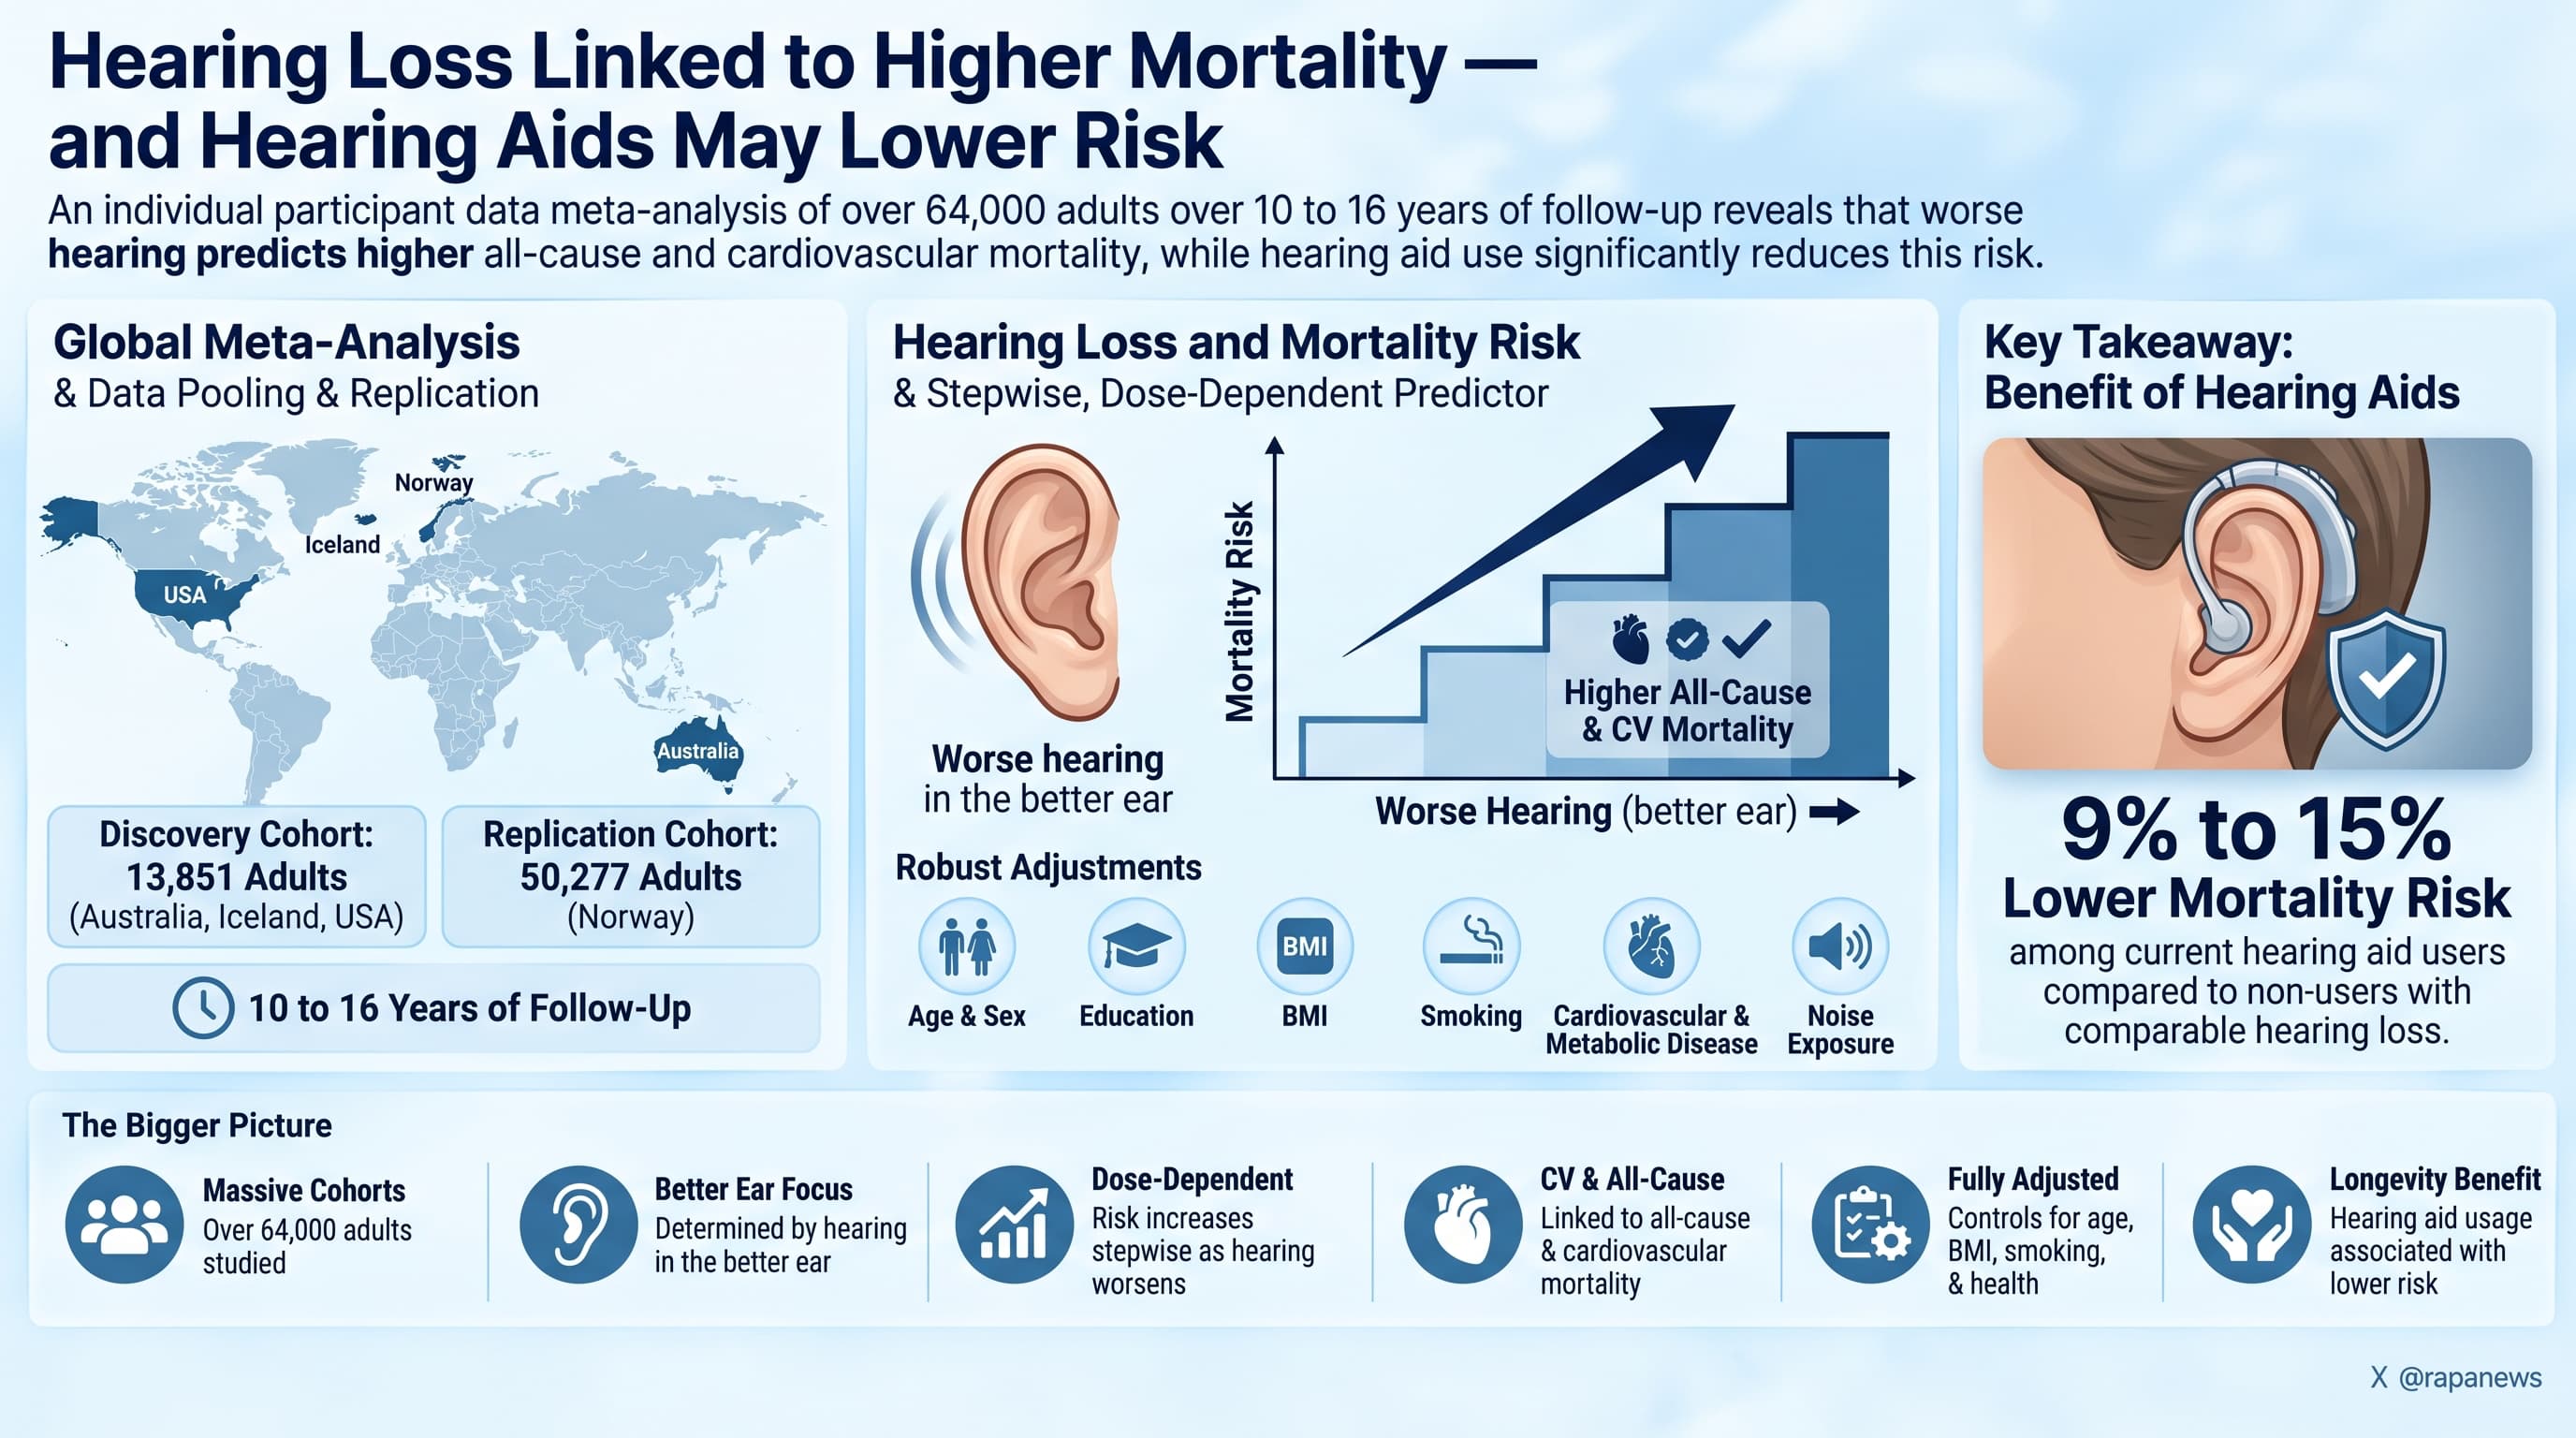
This individual participant data meta-analysis pooled audiometric and mortality records from 13,851 adults in Australia, Iceland and the USA, then replicated the analysis in 50,277 Norwegians. Over 10 to 16 years of follow-up, worse hearing in the better ear predicted higher all-cause and cardiovascular mortality in a stepwise, dose-dependent way, even after adjusting for age, sex, education, BMI, smoking, cardiometabolic disease and noise exposure. Among people with hearing loss, current hearing aid users had 9 to 15 percent lower mortality risk than non-users with comparable hearing.
Most people think of hearing loss as a nuisance: missed punchlines, the television turned up too loud. A new analysis of more than 64,000 adults across four countries suggests it belongs in a more serious category. People with worse hearing at baseline were more likely to die over the following decade and a half, and the risk rose with each step down the hearing scale.
The team was led by epidemiologists at the US National Institute on Deafness and Other Communication Disorders. They pooled raw participant records from three population studies: the Blue Mountains Hearing Study in Australia, the AGES-Reykjavik study in Iceland, and the US National Health and Nutrition Examination Survey. Every participant had a proper audiogram in a sound-treated booth. Self-report would not have been good enough, because people are poor judges of their own hearing. The researchers then tested their results in a fourth, much larger cohort of Norwegians.
In the pooled group, mild hearing loss carried about 19 percent higher risk of death during follow-up than normal hearing. Moderate loss carried roughly 55 percent higher risk, and the most severe category about the same. These estimates account for age, smoking, heart disease, diabetes, blood pressure, stroke and noise exposure. Cardiovascular deaths followed a similar pattern. The Norwegian data pointed the same way, but the effects were about half as large: 9 to 24 percent higher risk depending on severity.
The result likely to get the most attention concerns hearing aids. Among people with hearing loss, hearing aid users had about 9 percent lower risk of death in the pooled analysis and 15 percent lower risk in Norway, compared with non-users who had similar hearing thresholds. In non-users, every additional decibel of loss nudged mortality upward. In users, that gradient flattened to statistical noise.
Why would ears matter for survival? There are two broad explanations, and both could be true. In the first, hearing loss causes harm downstream. Straining to follow conversation pushes people toward social withdrawal, loneliness, depression, inactivity and falls, and it adds cognitive load to an aging brain. Hearing loss already ranks among the largest modifiable risk factors for dementia. In the second, hearing loss is a marker rather than a cause. The inner ear depends on a delicate microvascular supply and on sensory cells with very high energy demands. A failing cochlea may simply reflect vascular and metabolic decline that is happening throughout the body.
The hearing aid result needs the most caution, and the authors say so themselves. People who seek out, pay for and wear hearing aids tend to be wealthier, better connected to health care, cognitively sharper and more health conscious. Each of those traits predicts longer life on its own. The study recorded hearing aid use once, by self-report. It has no data on how often devices were worn or how well they were fitted.
The defensible conclusion is that hearing loss is a robust, graded warning sign for earlier death, and treating it is plausible, inexpensive and low risk. Whether hearing aids add years of life can only be settled by a randomized trial with mortality as an endpoint, and no such trial has been done.
Actionable Insights
- Get a real audiogram, especially if you are over 50, have a history of noise exposure, or find conversation tiring in noisy rooms. Hearing status turns out to be a meaningful health signal, not a cosmetic one.
- In the pooled data, each 10 dB of worse hearing raised mortality risk by about 12 percent. Moderate hearing loss carried about 55 percent higher risk. For scale, that is roughly what being about 5 years older would do, since adult death risk roughly doubles every 8 years.
- If you have hearing loss, using hearing aids was linked to 9 percent lower mortality in the pooled cohorts and 15 percent lower in Norway. Over 10 to 16 years, among people with roughly 50 percent baseline mortality, that works out to about 3 to 5 fewer deaths per 100 users. Equivalently, about 19 to 31 people would need to use aids for one fewer death, and the benefit is comparable to shaving 1 to 2 years off your “risk age.”
- Treat that benefit as an upper bound. Healthier, more engaged people are more likely to wear hearing aids, so part or most of the effect may be selection rather than the device.
- Protect what you have. Noise and ototoxic drugs cause hearing loss that cannot be reversed.
Hearing aids carry essentially no physiological risk. Over-the-counter devices for mild to moderate loss have lowered the cost barrier.
Context and Source
- Open Access Paper: Hearing loss, hearing-aid use, and mortality risk: individual participant data meta-analysis of population-based studies from Australia, Iceland, and the USA and a replication study from Norway
- Lead institution: Department of Epidemiology, Statistics, and Population Sciences, National Institute on Deafness and Other Communication Disorders, NIH, Bethesda, MD. and others.
- Country: USA (lead); multinational data from Australia, Iceland, USA and Norway
- Journal: The Lancet Healthy Longevity (2026)
- Impact evaluation: The impact score of this journal is 14.6, evaluated against a typical high-end range of 0 to 100+ for top general medicine (The Lancet itself sits near 88), therefore this is a High impact journal. Within geriatrics and aging, this is a top-tier venue.