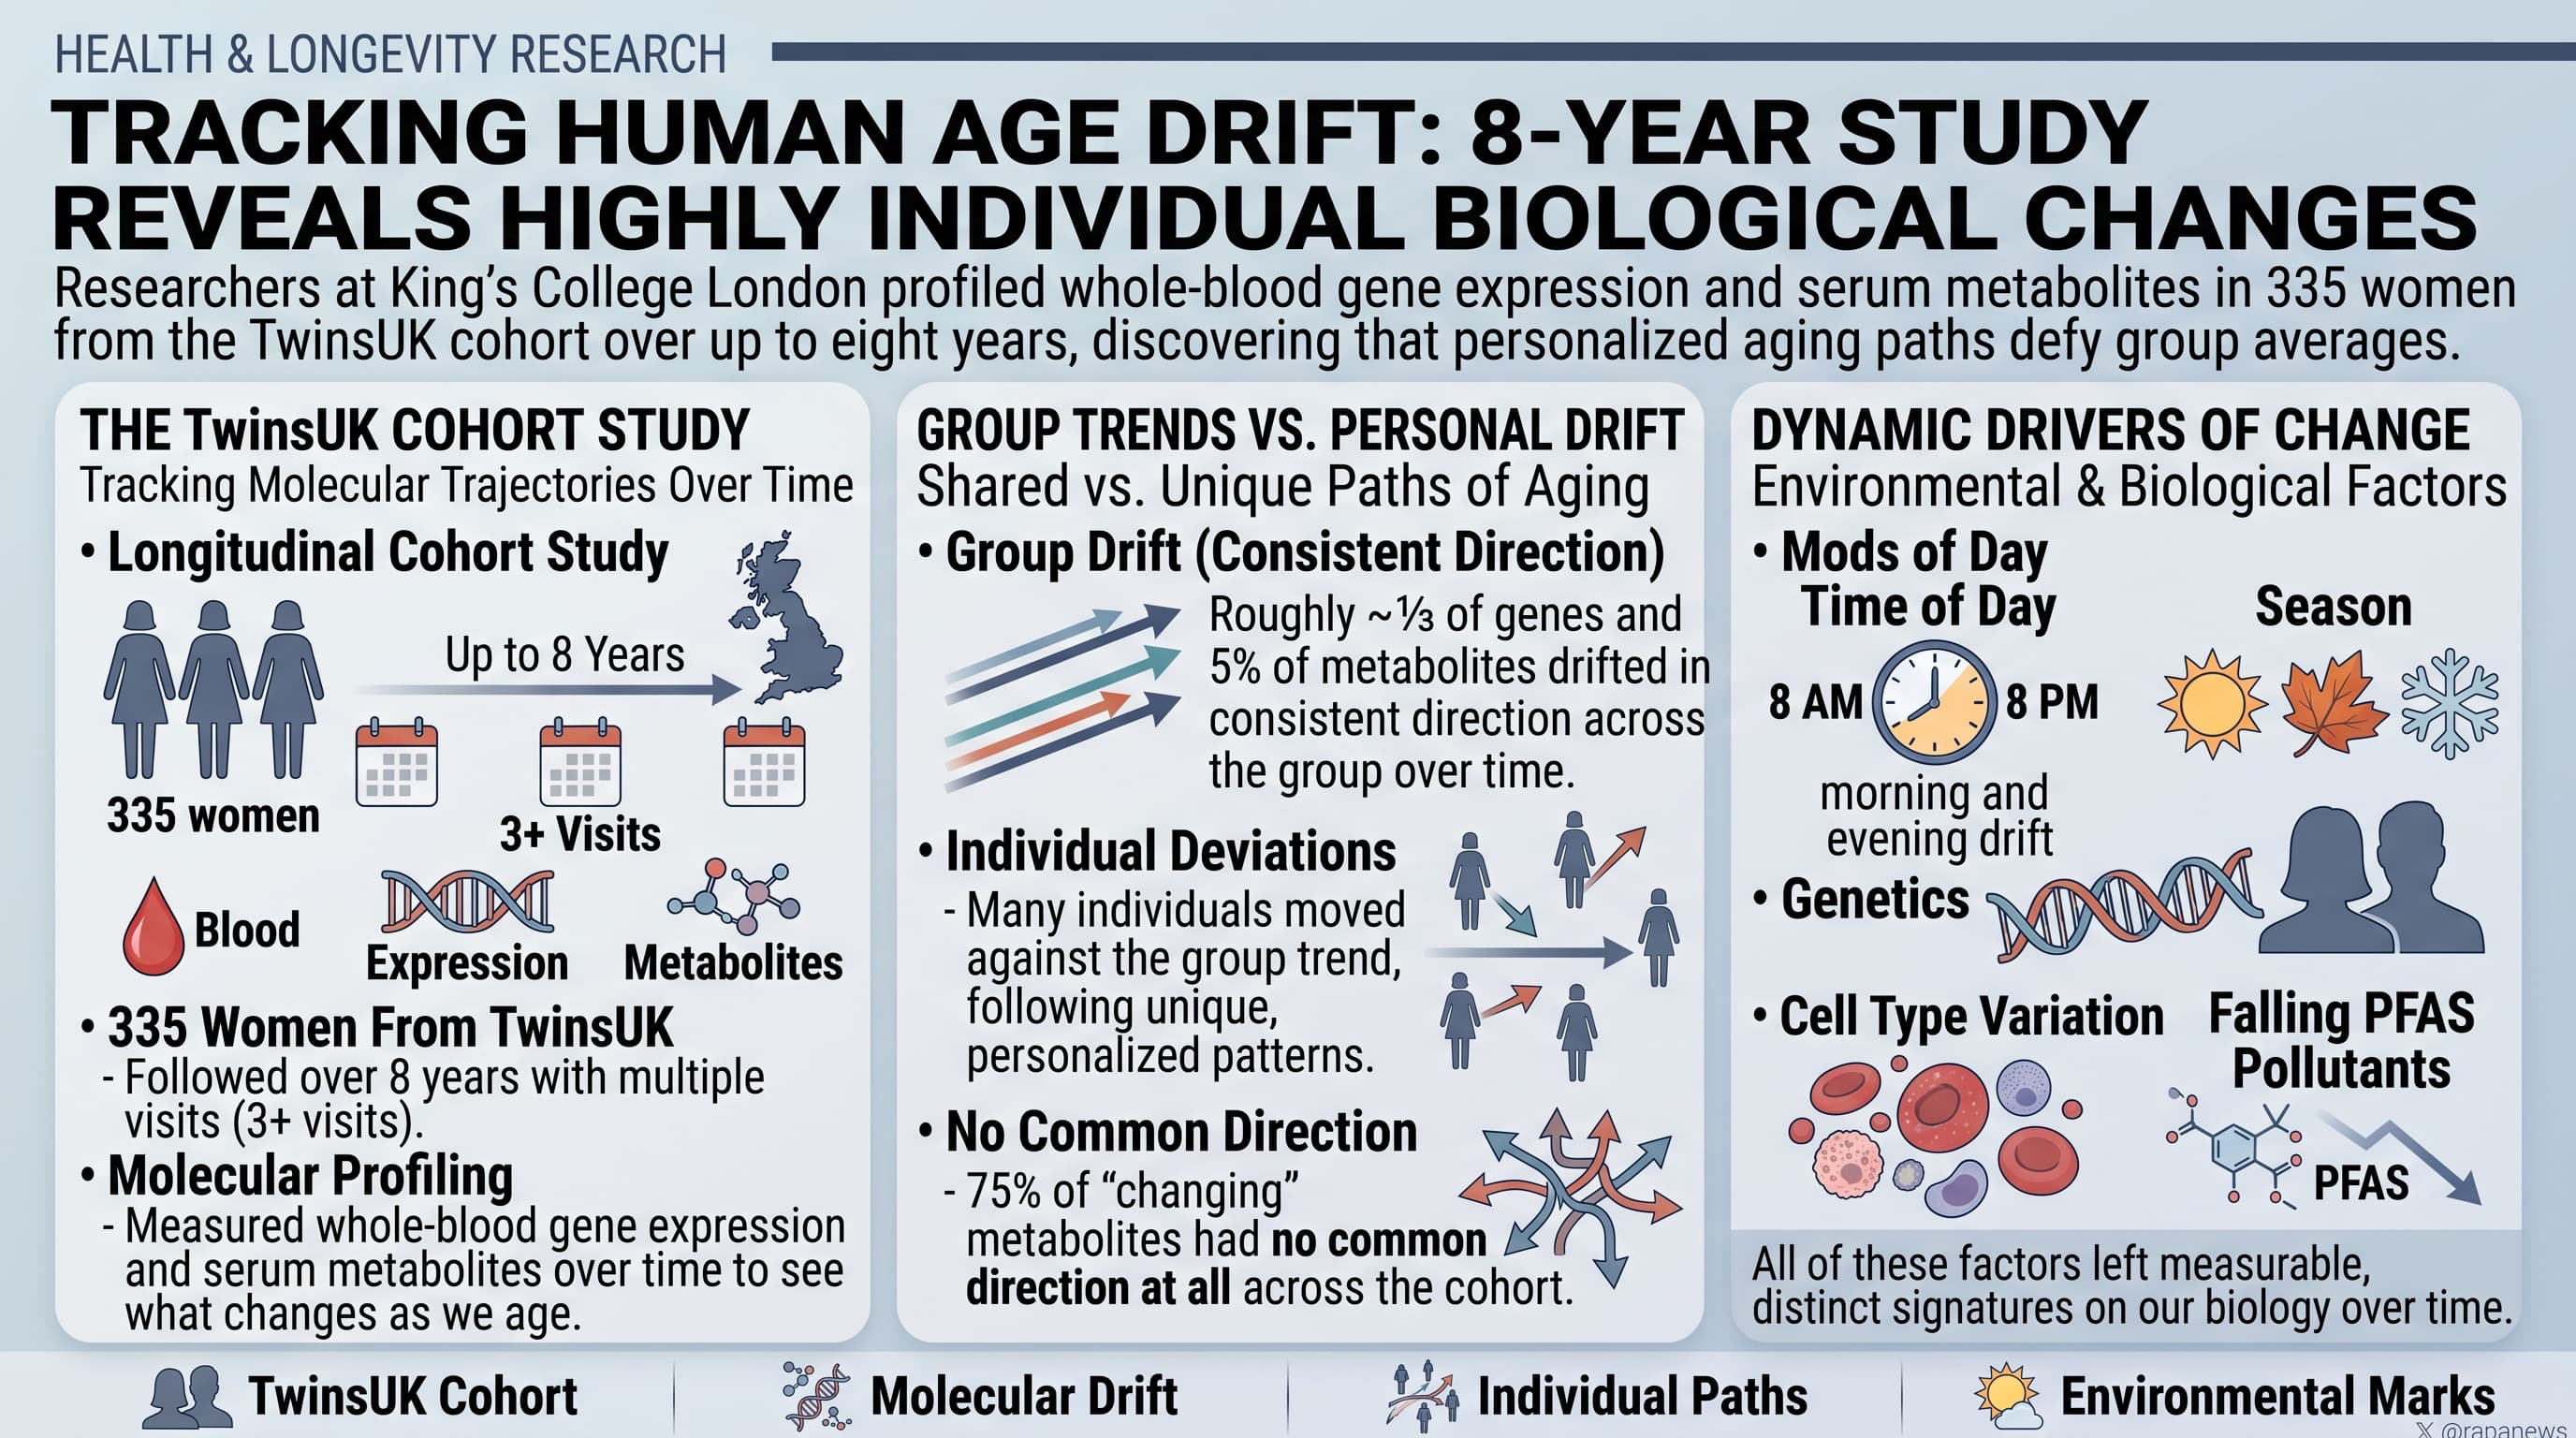
A landmark longitudinal investigation tracking 335 women across an eight-year span has revealed that human biological aging does not follow a uniform, predetermined script. By analyzing whole-blood gene expression alongside serum metabolites over three distinct clinical visits, researchers uncovered that nearly a third of all monitored genes and an array of critical metabolites exhibit marked temporal shifts. Crucially, the trajectories of individual subjects frequently broke away from population averages, moving in diametrically opposed directions. Biological rhythmicity, environmental toxins, and host genetics interact continuously to shape these molecular paths, revealing that systemic decline is highly individualized rather than a synchronized march of chronological time.
Most of what we know about how human blood chemistry changes with age comes from comparing young people with old people at a single moment. That approach cannot separate real aging from the simple fact that people differ from one another. A study in Science takes the harder route: follow the same people and measure them again and again.
The MultiMuTHER project drew blood from 335 female twins aged 32 to 80 at three or more clinic visits between 2009 and 2017, a median of six years from first to last. Each sample was run for RNA sequencing of whole blood and for 915 usable serum metabolites.
The headline numbers are large. Expression of 5,036 genes, 31% of those measured, shifted consistently over time, split almost evenly between rising and falling. Among metabolites, only 45 (5%) showed a shared direction. Androgenic steroids such as DHEA-S fell, while ceramides and sphingomyelins, lipids tied to cardiometabolic risk, rose.
The more interesting result is how poorly the average describes the individual. Even for the genes with the strongest group trends, some women moved the opposite way and others barely moved. A further 136 metabolites, including serotonin and several acylcarnitines, changed substantially within people but in both directions, so the group average came out flat. The inflammatory chemokine gene CXCL9, a key component of a published inflammatory aging clock, behaved the same way.
Immune cells did not age in step either. Using computational estimates of cell-type-specific expression, the team found that CD4 and CD8 T cells mostly lost expression over time, while natural killer cells mostly gained it. The authors read this as remodeling of the immune system, with adaptive immunity waning and innate immunity turning up, although the cell-level data are inferred and not directly measured.
Context mattered a great deal. About 26% of genes and 39% of metabolites varied with the hour of the blood draw, even within office hours. A quarter of both varied with season, with interferon and immune genes peaking in winter. Genes that declined over time were about twice as long as those that rose, supporting earlier reports that aging blunts the transcription of long genes.
The study also caught an environmental policy at work. Serum levels of the “forever chemicals” PFOA and PFOS dropped steadily, in line with regulatory restrictions on their use. At the first visit PFOS tracked with the expression of 234 genes, including a thyroid hormone receptor gene. By the last visit no associations were detectable.
What the paper does not do is tell anyone which trajectory is good or bad. There are no disease or mortality outcomes, no men, and no non-European participants. Its value is as a reference map and as a warning: a single blood omics snapshot, compared against a population average, says less about a person’s aging than commercial test reports imply.
Actionable Insights
This study tested no treatment, so nothing here shows that changing a marker improves health. The practical lessons concern measurement.
First, one-off blood omics tests are noisy. A woman’s gene expression profile correlated only 0.31 with her own profile at another visit, on a scale where 1.0 is identical. That is about 10% shared variation. Metabolite profiles did better at 0.44 for adjacent visits, falling to 0.32 across the full span.
Second, standardize your blood draws. With 26% of genes and 39% of metabolites shifting by time of day, and about a quarter by season, a morning draw in January and an afternoon draw in July are not comparable. Same hour, same fasting state, and ideally the same season.
Third, track yourself, not the average. For 136 of the 181 changing metabolites (75%), people moved in both directions.
Fourth, body weight and blood sugar dominate. The strongest shared molecular pattern shifted about 0.09 standard deviations per BMI point, and women with type 2 diabetes sat roughly one standard deviation from healthy controls, a large gap.
Finally, PFAS blood levels fell after regulation, and their molecular associations disappeared. That is consistent with exposure reduction being worthwhile but does not prove a health benefit.
Context and Source
- Paywalled Paper: Longitudinal dynamics of gene expression and metabolomics in an aging population cohort, September 2026.
- Lead institution: Department of Twin Research and Genetic Epidemiology, King’s College London, with the University of Geneva, University of Oxford, and MRC Biostatistics Unit, Cambridge
- Country: United Kingdom (lead), with Switzerland and Italy
- Journal: Science, volume 393, issue 6815, 3 September 2026
- Impact evaluation: The impact score of this journal is 47.3, evaluated against a typical high-end range of 0 to 60+ for top general science, therefore this is an Elite impact journal.