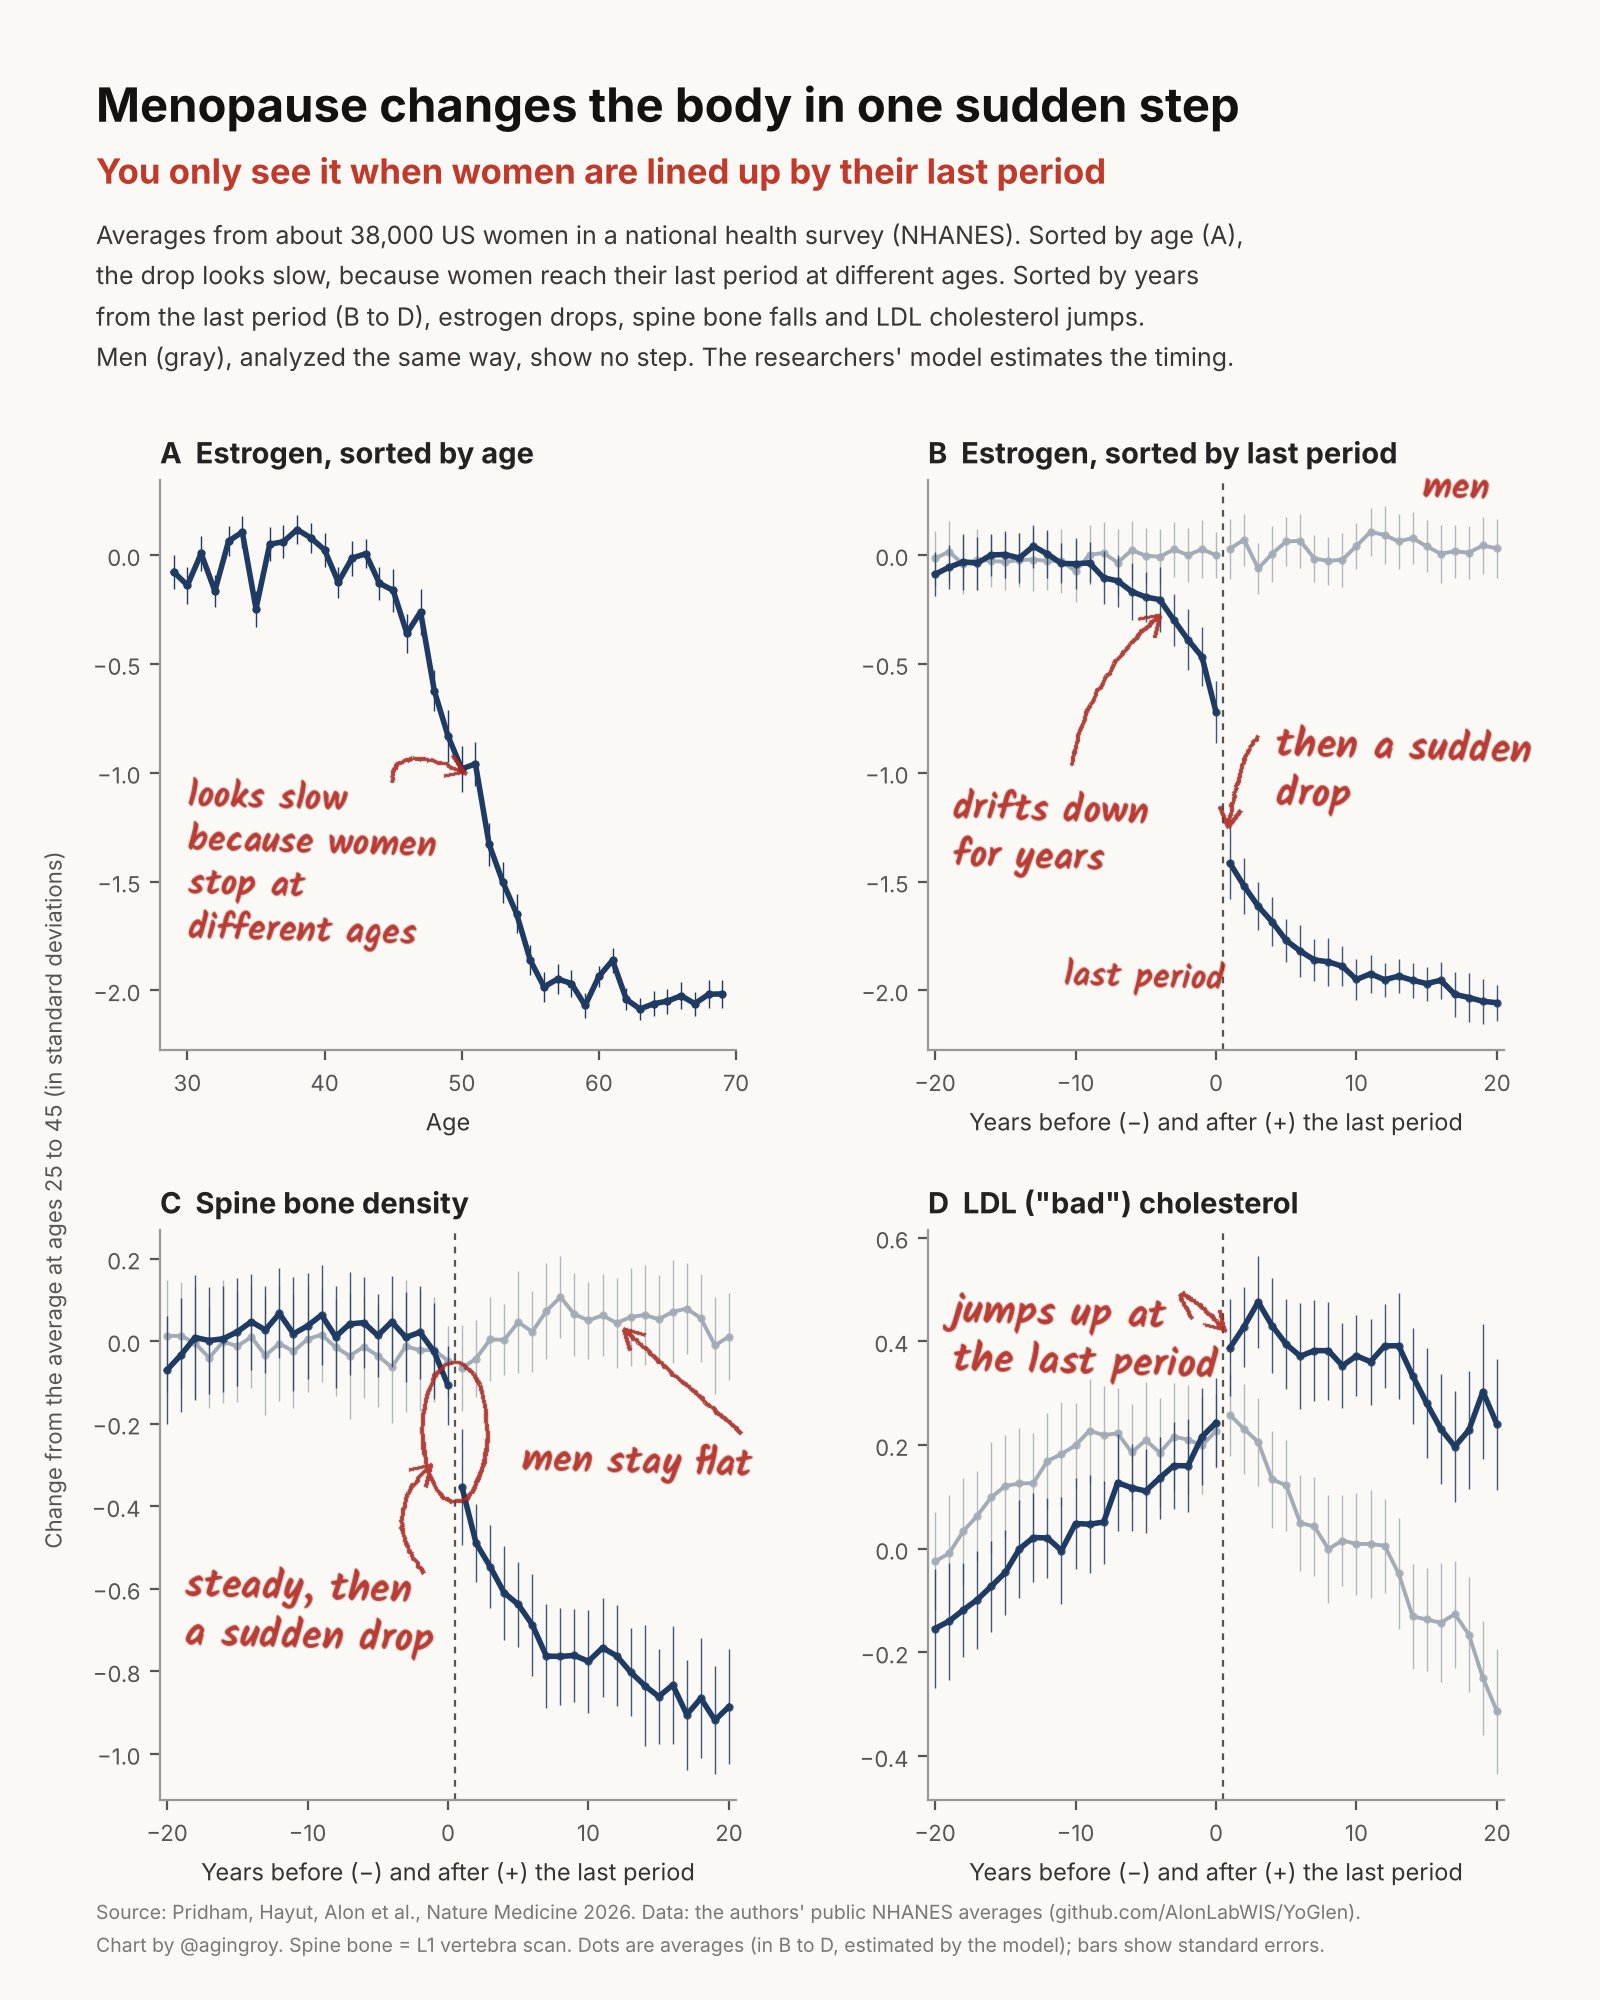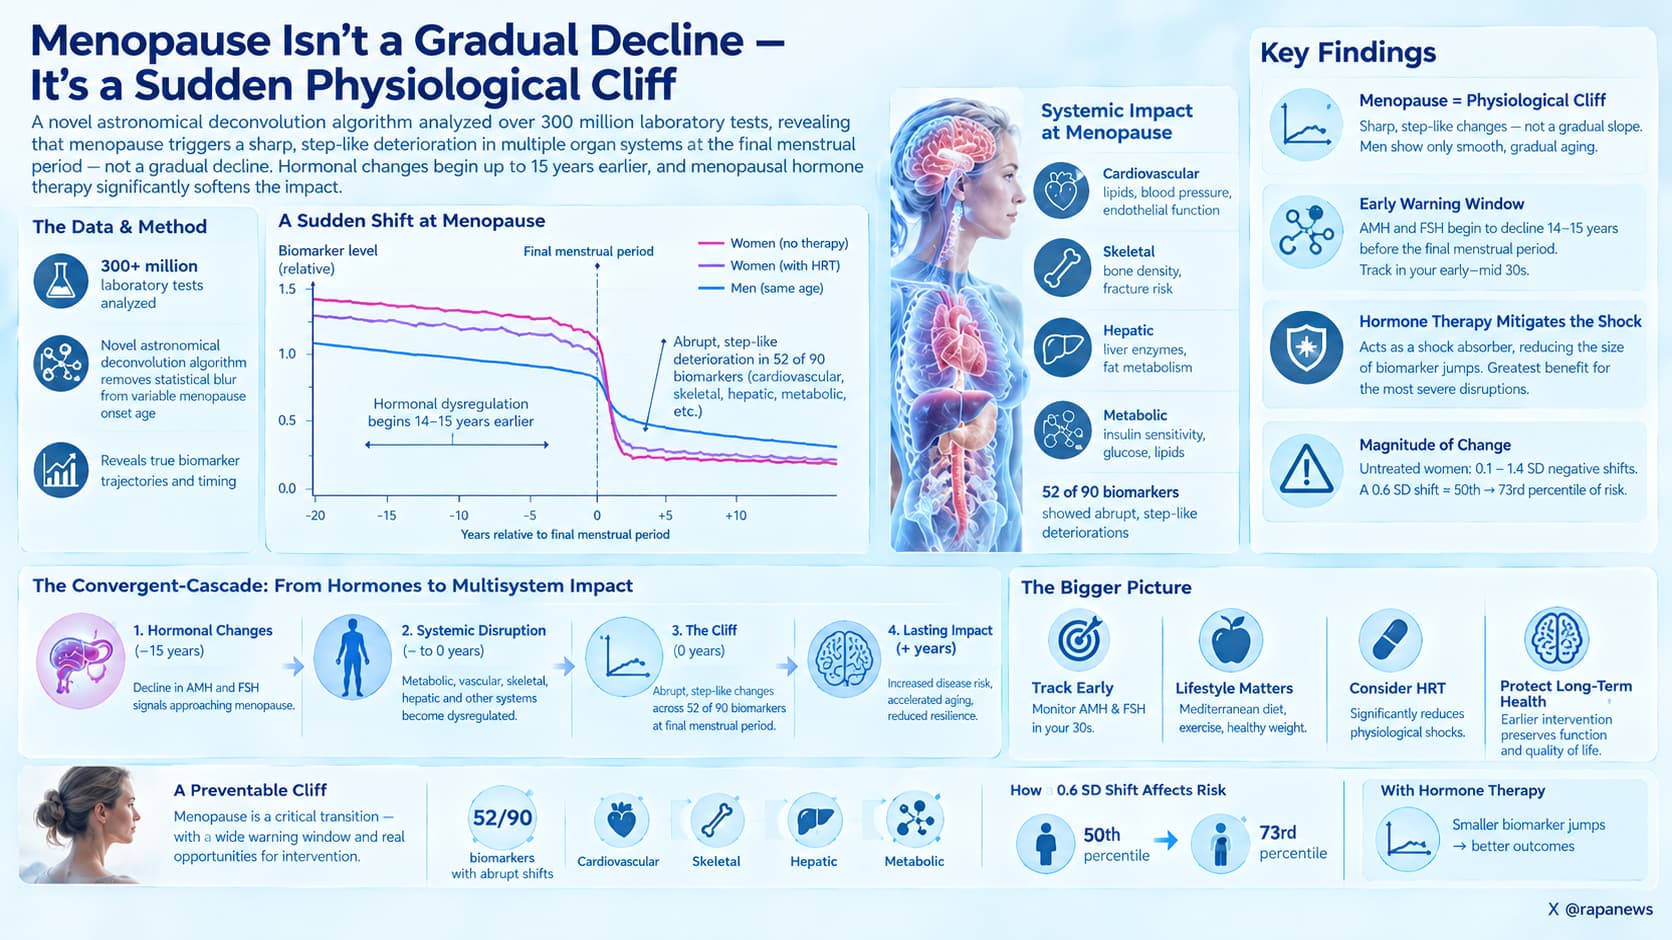
Uri Alon’s group at the Weizmann Institute built a statistical “deblurring” method, borrowed from image processing in astronomy, to line up cross-sectional lab data by each woman’s estimated final menstrual period (FMP) instead of by age. They applied it to about 300 million lab tests from the US NHANES survey and Israel’s Clalit health system. At the FMP, 52 of 90 lab tests shifted abruptly across bone, liver, lipid, kidney, blood count and hormone systems. Men run through the same analysis showed no such jump. Women reporting current hormone therapy showed much smaller jumps. Changes in sex hormones were detectable in the mean data 12 to 15 years before the FMP.
For decades, menopause has been described as a gradual transition. Blood markers drift, bone thins and cholesterol creeps up over years. A new study argues that much of that gradualness comes from how we look at the data, not from the biology.
The problem is timing. Most large health datasets record a woman’s age but not when her periods stopped. Because women reach menopause anywhere from their early 40s to late 50s, averaging lab results by age smears together women who are years before menopause with women years past it. A sharp change in each individual becomes a gentle slope in the population average.
Glen Pridham, Yoav Hayut and colleagues in Uri Alon’s lab treated this as a blurred photograph. Astronomers sharpen telescope images by mathematically reversing the known distortion of the lens. Here, the “lens” is the known spread of menopause ages. By reversing that spread, the team reconstructed what the average lab trajectory would look like if every woman were lined up by her own final menstrual period.
The picture that emerged was a cliff. Across two very different populations, an American health survey and an Israeli insurer covering about half the country, 52 of 90 lab tests showed a step-like change right at the final period. The expected hormones moved most: estradiol fell sharply and FSH rose. But the jumps extended well beyond reproduction. Spinal bone density dropped, bone turnover markers rose, LDL cholesterol and liver enzymes climbed, and blood sodium and osmolality shifted. The size of each jump correlated strongly between the US and Israeli data, which makes a statistical fluke unlikely.
As a built-in check, the researchers ran men through the identical analysis, pretending they had a “menopause” at around age 50. Men showed smooth, gradual aging curves with no step.
Most of the jumps went in the direction of higher disease risk. The exception was iron and red blood cell markers, which improved, consistent with the end of monthly blood loss. Anemia rates fell accordingly. Clinical outcomes followed the lab data. Osteoporosis and cardiovascular disease rose faster after menopause, while depression scores and sleep problems spiked in the year after the final period and then eased.
Two findings stand out for prevention. First, women who reported taking menopausal hormone therapy showed markedly smaller jumps, especially in bone, liver and kidney markers, and the biggest jumps were the ones most corrected. Second, hormone changes appeared to begin 12 to 15 years before the final period, roughly seven years earlier than estimates from the landmark SWAN cohort.
The caveats are real. The data are cross-sectional, the hormone therapy results are observational and prone to healthy-user bias, and the pre-menopause timeline is reconstructed statistically rather than observed. Still, the study reframes menopause as a systemic event with a quantifiable edge, and it offers a method that could sharpen other hidden transitions such as puberty or disease onset.
Actionable Insights
Menopause appears to be a sharp, multi-system event rather than a slow drift, so the year or two around the final period is a sensible time to get baseline and follow-up measurements: bone density scan, lipid panel including ApoB, liver enzymes and blood pressure.
The biggest non-hormonal shift was in spinal bone. In practical units, lumbar bone density fell roughly 8 to 9 percent at the transition, a medium-to-large effect (roughly 0.7 standard deviations, comparable to a Cohen’s d of 0.7). LDL rose roughly 10 percent, about 10 to 12 mg/dL for a typical woman, which is small but persistent.
Ferritin rose about 80 percent after periods stopped. Postmenopausal women taking iron “just in case” should check ferritin first.
Women on hormone therapy showed jumps reduced by roughly half to nearly all in bone, liver and kidney markers. This supports discussing hormone therapy around the transition with a clinician, but it is not proof of benefit: users differ from non-users, and oral estrogen raised CRP. Transdermal routes avoid that liver effect.
Mood deserves attention. Moderate-to-severe depression was 19.5 percent in the year after the final period versus 10.7 percent later, roughly 1 extra case per 11 to 12 women.
Context and Source
- Open Access Paper: Population-scale reconstruction of menopause dynamics reveals a physiological cliff at the final menstrual period
- Institution: Weizmann Institute of Science (Alon and Neeman labs), with Kaplan Medical Center, Clalit Health Care and Rabin Medical Center
- Country: Israel
- Journal: Nature Medicine, Published online 12 October 2026.
- Impact Evaluation: The impact score of this journal is 52.5, evaluated against a typical high-end range of 0 to 60+ for top general science and medicine, therefore this is an Elite impact journal.