Deep Sleep:
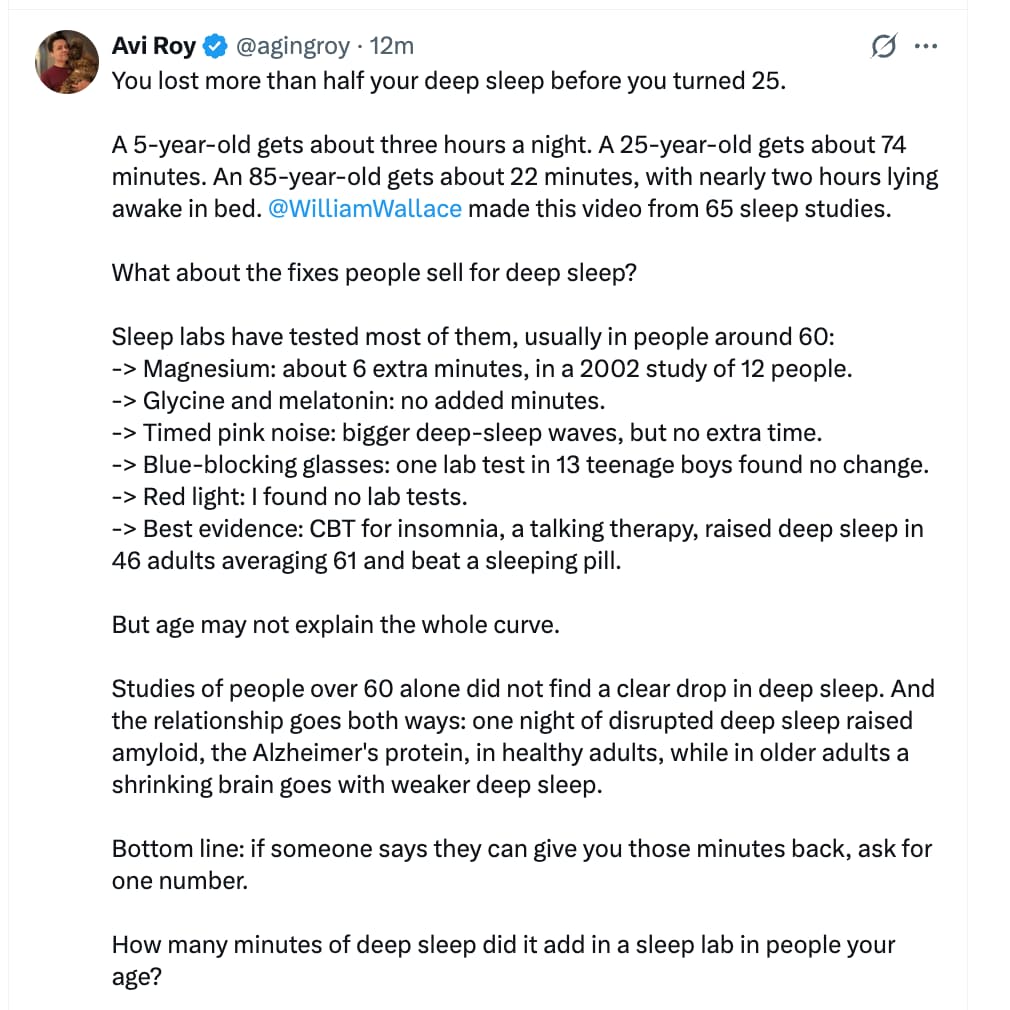
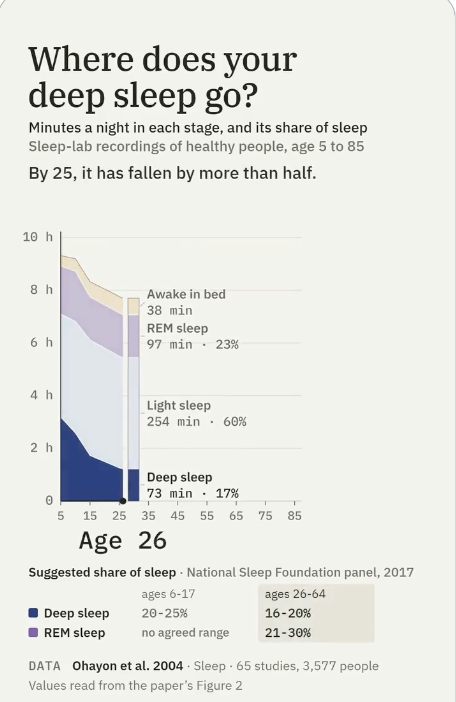
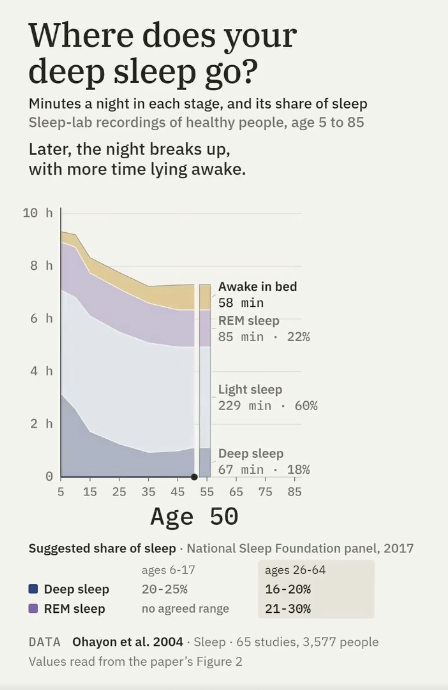
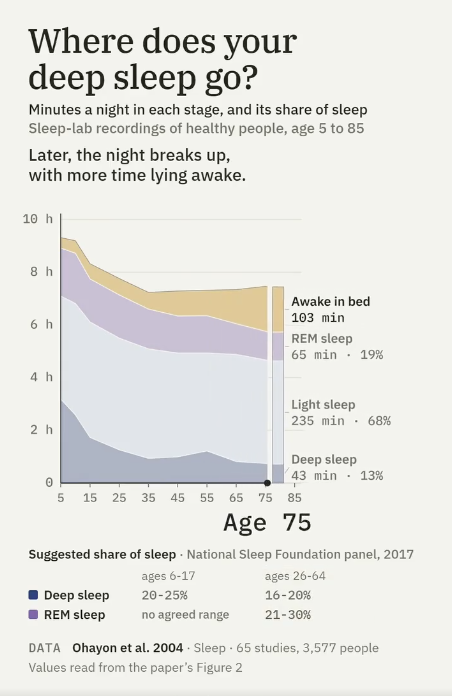
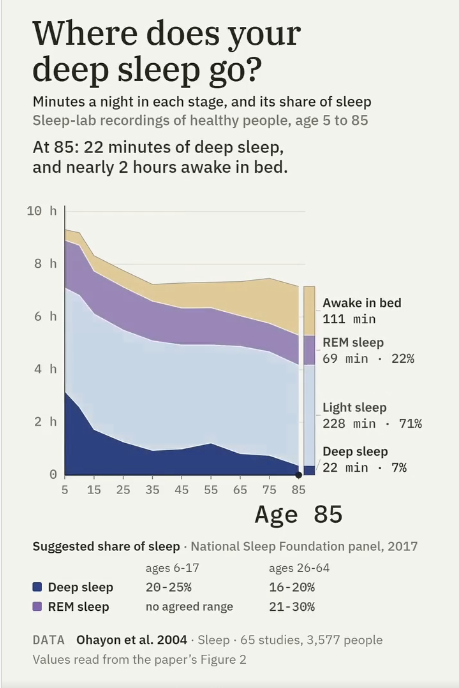
Source: This X Post
The Sleep impact of Aging is an interesting topic, and the paper that is cited at the bottom of the sleep images in the previous post also sounded interesting, so I’ve dug it up and summarized it for you:
This 2004 meta-analysis pooled 65 sleep-laboratory and actigraphy studies covering 3,577 healthy people aged 5 to 102 to establish what normal sleep looks like at each stage of life. Across adulthood, total sleep time, sleep efficiency, deep slow-wave sleep and REM sleep all decline, while light sleep and time spent awake during the night increase. The two largest changes are the loss of deep sleep and the growth in night-time wakefulness. The less expected finding is that in healthy people nearly all of this change happens between young adulthood and about age 60. After 60, only sleep efficiency keeps declining. The paper also shows that the size of these age effects depends heavily on how carefully each study screened out illness, sleep apnea and psychiatric conditions.
For decades, sleep researchers could not agree on basic questions. Does REM sleep shrink with age? Does it take longer to fall asleep at 70 than at 25? Roughly half the published studies said yes and half said no, largely because most enrolled a few dozen people at most.
Maurice Ohayon at Stanford, with colleagues at Brown and the University of Washington, settled much of the argument by combining the numbers. They screened more than 4,000 reports published between 1960 and 2003 and kept 65 that measured sleep objectively in people without clinical complaints. That gave them 3,577 subjects from age 5 to 102.
The adult picture is consistent. Total sleep time falls by about 10 minutes per decade. Slow-wave sleep, the deepest stage, drops by about 2 percentage points per decade. Sleep efficiency, the share of time in bed actually spent asleep, starts sliding at about 40 and loses roughly 3 points per decade. Time awake after first falling asleep rises by about 10 minutes per decade from age 30. REM sleep falls more modestly, with older adults getting about 4 percentage points less than young adults. Time to fall asleep barely moves, lengthening by under 10 minutes between ages 20 and 80.
The headline result is the plateau. When the authors looked only at studies comparing people aged 60 and over with each other, total sleep time, deep sleep, REM sleep and night-time wakefulness showed no further significant decline. Only sleep efficiency continued to worsen. In people who stay healthy, sleep architecture appears to do most of its aging in early and middle adulthood, then hold roughly steady.
That matters because sleep in old age is commonly assumed to deteriorate without limit. This analysis suggests that marked worsening after 60 is more likely to reflect disease, medication, sleep apnea or mood disorders than age itself.
The second major finding is methodological. Studies that failed to exclude people with medical illness, psychiatric conditions, substance use or sleep apnea produced much weaker age effects, and in some cases none. The association between age and total sleep time was about three times stronger in studies that screened for mental disorders than in those that did not. The authors admit they have no simple explanation for the direction of this effect.
In children, the analysis overturned another assumption. Sleep duration fell with age only when recordings were made on school nights. On weekends and holidays, children and adolescents slept the same amount regardless of age, pointing to school schedules, not biology.
The limits are substantial. Every study was a snapshot comparing different people of different ages, not a record of the same people aging. The oldest subjects were unusually healthy survivors. Middle-aged adults were thinly sampled, and race could not be analyzed at all. The paper describes what healthy sleep looks like. It does not show that restoring youthful sleep extends life.
This paper tested no treatment, so it cannot show that anything improves health or lifespan. Its value is as a reference range.
First, set expectations correctly. A healthy 70-year-old typically sleeps about 50 minutes less than a healthy 20-year-old and spends about 40 more minutes awake during the night. In statistical terms the sleep-time difference is “medium” (Cohen’s d of 0.60), meaning the average older adult sleeps less than about 73 percent of young adults. The groups overlap a great deal.
Second, deep sleep takes the largest hit. It falls by roughly half between 20 and 70 (d of 0.85, “large”). If a tracker shows less deep sleep at 55 than at 30, that is expected.
Third, treat new deterioration after 60 as a medical signal. Healthy sleep is largely stable from 60 onward, so a clear decline justifies checking for sleep apnea, depression, pain, medication effects and alcohol.
Fourth, trouble falling asleep is not a normal part of aging. Sleep onset lengthens by under 10 minutes across 60 years (d of 0.27, “small”).
Fifth, for parents, adolescent sleep loss tracks school schedules. On non-school nights the age effect was essentially zero (d of 0.04).
No lifespan extension data exist in this paper. The outcomes are sleep measurements compared across ages.
How to read the numbers: Cohen’s d expresses a difference between two groups in units of normal person-to-person variation. By convention 0.2 is small, 0.5 medium and 0.8 large. The “share of young adults” column converts d into something more intuitive: the percentage of young adults who score above the average older adult for measures that fall, or below for measures that rise. I calculated that column from the reported d values assuming bell-shaped distributions.
Adult age effects, all studies pooled:
| Sleep measure | Direction with age | Cohen’s d (95% CI) | Size | Absolute change reported | Share of young adults beyond the older average |
|---|---|---|---|---|---|
| Wake after sleep onset | Up | 0.89 (0.75 to about 1.02) | Large | About 10 min per decade from age 30 | 81% |
| Slow-wave sleep % | Down | 0.85 (0.75 to 0.96) | Large | About 2 points per decade | 80% |
| Sleep efficiency | Down | 0.71 (0.61 to 0.81) | Medium to large | About 3 points per decade from age 40 | 76% |
| Total sleep time | Down | 0.60 (0.51 to 0.69) | Medium | About 10 min per decade | 73% |
| REM % | Down | 0.46 (0.37 to 0.55) | Medium | About 4 points, young vs 60+ | 68% |
| Stage 1 % | Up | 0.38 (0.26 to 0.49) | Small | About 5 points from 20 to 70 | 65% |
| Stage 2 % | Up | 0.28 (0.17 to 0.40) | Small | About 5 points from 20 to 70 | 61% |
| Sleep latency | Up | 0.27 (0.17 to 0.37) | Small | Under 10 min from 20 to 80 | 61% |
| REM latency | Down | 0.15 (0.03 to 0.28) | Trivial | Not stated | 56% |
Approximate cumulative change from age 20 to 70 is below. The percentages are my estimates from the fitted curves in the paper’s figures. [Confidence: Medium]
The plateau after 60 shows in the “elderly only” samples:
The screening effect is large:
In children, total sleep time fell with age on school days (d of 0.57) and not on non-school days (d of 0.04, with a confidence interval crossing zero).
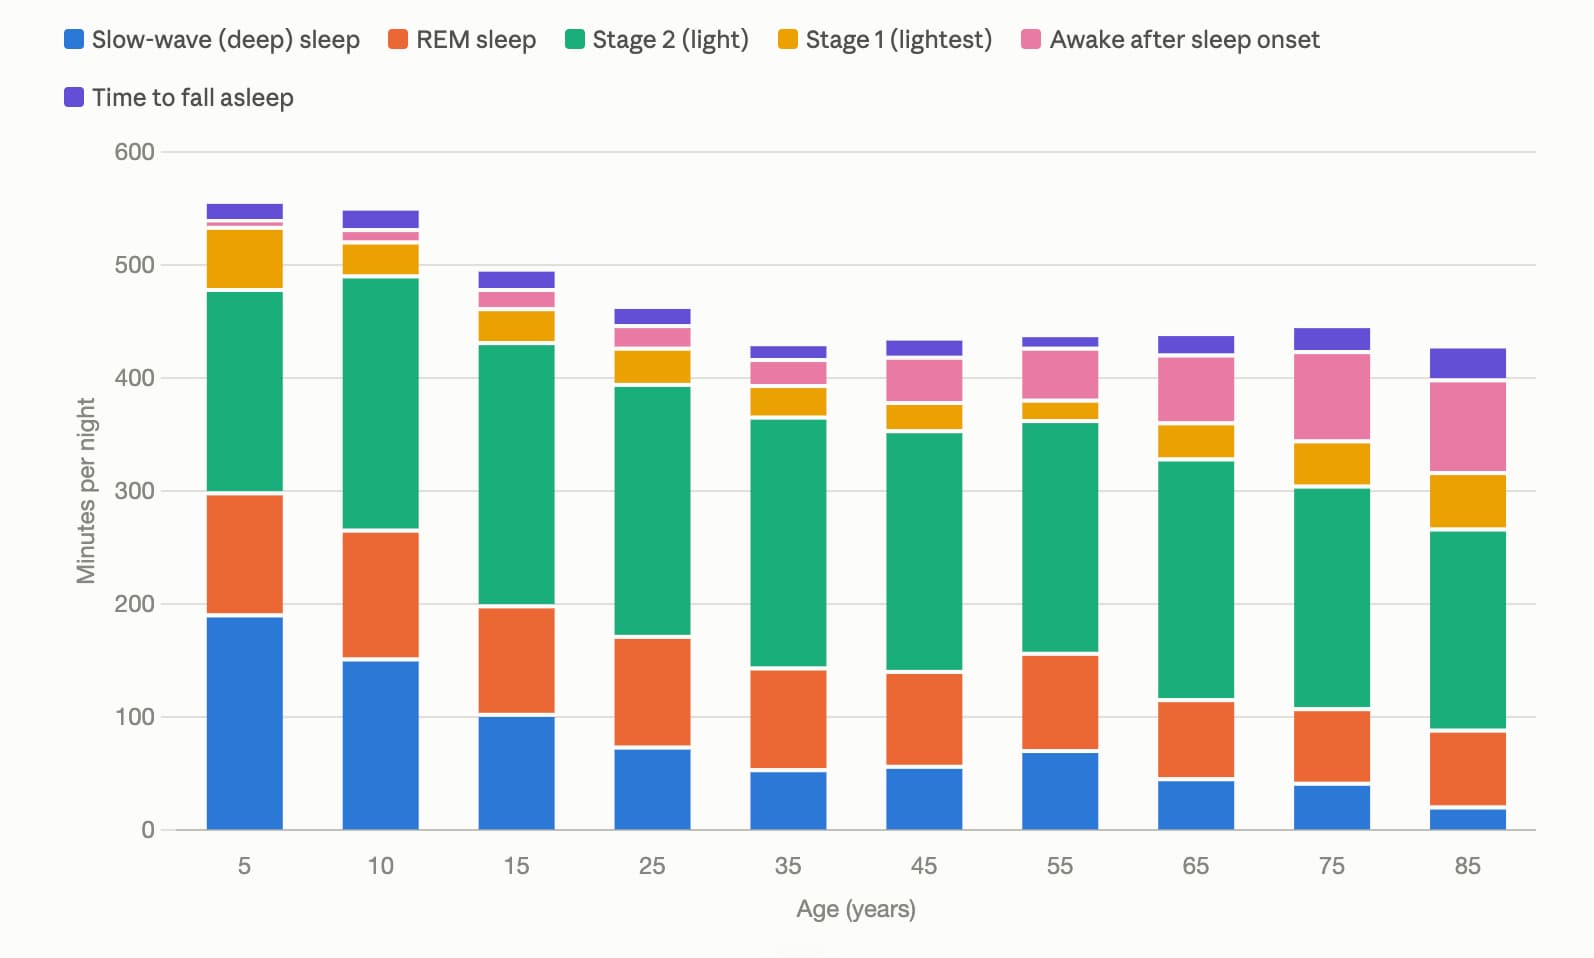
Estimated minutes per night by sleep stage and age (read from Figure 2, Ohayon et al. 2004)
| Age | Deep (slow-wave) | REM | Stage 2 | Stage 1 | Total asleep | Awake after sleep onset | Time to fall asleep |
|---|---|---|---|---|---|---|---|
| 5 | 192 | 108 | 180 | 55 | 535 | 6 | 17 |
| 10 | 153 | 114 | 225 | 30 | 522 | 11 | 19 |
| 15 | 104 | 96 | 233 | 30 | 463 | 17 | 18 |
| 25 | 75 | 98 | 223 | 32 | 428 | 20 | 17 |
| 35 | 55 | 90 | 222 | 28 | 395 | 23 | 14 |
| 45 | 58 | 84 | 213 | 25 | 380 | 40 | 17 |
| 55 | 72 | 86 | 206 | 18 | 382 | 46 | 12 |
| 65 | 47 | 70 | 213 | 32 | 362 | 60 | 19 |
| 75 | 43 | 66 | 197 | 40 | 346 | 79 | 23 |
| 85 | 22 | 68 | 178 | 50 | 318 | 82 | 30 |
Values are approximate readings from the published figure, accurate to roughly 5 to 10 minutes. The bump in deep sleep at age 55 is likely noise from sparse middle-age data.
Each bar is one night at that age, and hovering shows the minutes per stage and the total time asleep.
Three things limit how far the graph can be trusted: