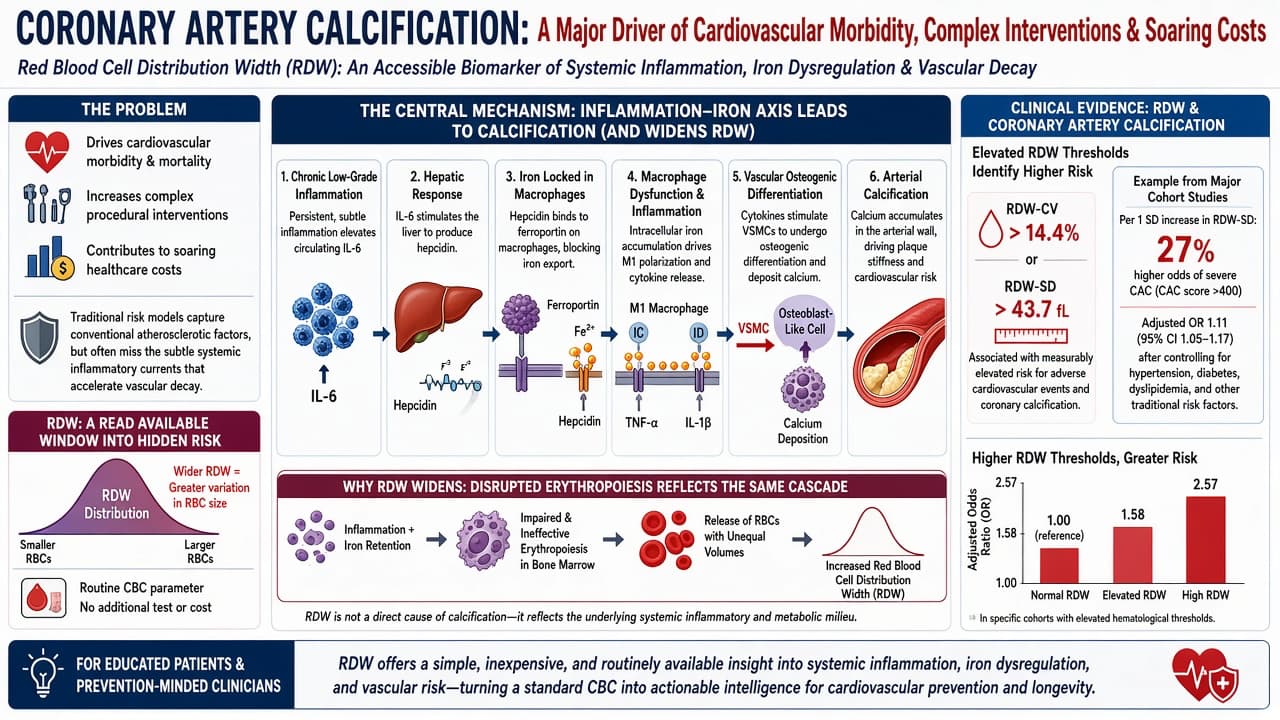
Coronary artery calcification remains a major driver of cardiovascular morbidity, complex procedural interventions, and soaring healthcare costs. Traditional risk models capture conventional atherosclerotic factors, but they often miss the subtle systemic inflammatory currents that accelerate vascular decay. A comprehensive narrative review explores how red blood cell distribution width, a standard parameter reported in routine complete blood counts, serves as an accessible integrative biomarker for the inflammatory and metabolic shifts that precede arterial calcification. Rather than acting as a direct physical cause of calcified lesions, red blood cell size variation reflects a systemic cascade linking immune activation, iron dysregulation, and macrophage dysfunction.
The central mechanism detailed in the review hinges on the crosstalk between systemic inflammation and iron homeostasis. When chronic low-grade inflammation elevates circulating interleukin-6, the liver responds by synthesizing high levels of the peptide hormone hepcidin. Hepcidin binds to ferroportin channels on macrophages, effectively locking iron inside these immune cells. This intracellular iron accumulation drives macrophages toward a proinflammatory M1 phenotype, releasing tumor necrosis factor-alpha and interleukin-1 beta, which subsequently stimulate vascular smooth muscle cells to undergo osteogenic differentiation and deposit calcium within the arterial wall. Because inflammation and iron retention disrupt normal erythropoiesis, the bone marrow releases red blood cells of unequal volumes, widening the red blood cell distribution width. Across multiple large cohort studies comprising over 16,000 subjects, elevated red blood cell distribution width standard deviation correlates strongly with severe coronary artery calcification scores above 400, while the coefficient of variation independently predicts adverse cardiovascular events. This framework reframes a routine, low-cost hematological metric into a powerful prognostic indicator of immune-driven vascular pathology, pointing toward future therapeutic strategies that target upstream inflammatory pathways.
Actionable Insights
For educated individuals tracking cardiovascular health and longevity, red blood cell distribution width offers a readily available window into systemic inflammation and metabolic health. Clinically, patients with a red blood cell distribution width coefficient of variation above 14.4 percent or a standard deviation above 43.7 femtoliters demonstrate a measurably elevated risk for adverse cardiovascular events and coronary calcification. The real-world magnitude of this association is illustrated by quantitative effect sizes from major cohort studies evaluated in the paper. For instance, a single standard deviation increase in red blood cell distribution width standard deviation is associated with a 27 percent increase in the odds of having a severe coronary artery calcium score above 400, remaining significant with an adjusted odds ratio of 1.11 after controlling for traditional confounders like hypertension, diabetes, and dyslipidemia. Furthermore, specific patient cohorts exhibit adjusted odds ratios as high as 2.57 for heavy calcification burdens when exceeding elevated hematological thresholds. To translate these insights into practice, individuals should examine their complete blood count panels for red blood cell distribution width elevations alongside high-sensitivity C-reactive protein and fasting insulin metrics. Because elevated values are sensitive to chronic inflammation, iron maldistribution, and metabolic syndrome, discovering an unexplained elevation should prompt a broader investigation into underlying immune activation, renal status, or subclinical metabolic dysfunction rather than being dismissed as simple nutritional anemia.
Institutions: Institute for Development and People, Francisco de Vitoria University; Pontificio Instituto Teológico Juan Pablo II Madrid, UCAM; Quironsalud University Hospital Madrid; Ruber Juan Bravo Quironsalud University Hospital
Country: Spain
Journal Name: Life
Impact Evaluation: The impact score of this journal is 2.6, evaluated against a typical high-end range of 0 to 60 plus for top general science, therefore this is a medium impact journal.
What is the optimal red blood cell distribution width coefficient that a person seeking health and longevity, should target?
For individuals prioritizing health optimization and longevity, the target red blood cell distribution width coefficient of variation (RDW-CV) is below 13%, with functional longevity and preventive medicine frameworks often targeting a tighter physiological range of 11% to 12.6%.
While standard clinical laboratories typically define the broad “normal” reference range as roughly 11.5% to 14.5% (to capture 95% of the general population), population health and longevity data demonstrate that values tracking toward the upper half of that standard window correlate with escalating risks of all-cause mortality, cardiovascular events, and subclinical vascular calcification.
Key Considerations for Optimization
Lower is Better within Range: In longevity analytics and biological aging clocks (such as the Levine PhenoAge phenotype algorithm), lower RDW values within the reference interval are consistently associated with reduced biological aging acceleration and lower systemic inflammation.
Interpreting Low Values: A low RDW-CV (below 11%) simply indicates a highly uniform population of red blood cells and is generally considered clinically benign and non-pathological, provided other indices like hemoglobin and mean corpuscular volume (MCV) are normal.
Investigating Upward Drift: Because RDW-CV functions as a downstream proxy for metabolic stress, systemic inflammation (e.g., elevated IL-6), and early micronutrient imbalances, any upward drift above 13% warrants a deeper investigation into upstream drivers—such as iron availability, serum ferritin, high-sensitivity C-reactive protein (hs-CRP), vitamin B12, and folate status—rather than treating the metric in isolation.
I’ve gained an appreciation for the CBC with differential over the last 9 months, as I’ve been tracking my immune and bone marrow markers while on TRIIM. To me, CBC seems far more responsive than fasting insulin and glucose when it comes to determining safety of GH dose.
RDW seems to keep coming up again and again and again in all of these aging calculators and predictions. It’s a big factor in the basic Levine equation. It’s in LinAge2 also. So clearly it’s correlated quite strongly with health status. It’s fascinating really because all it measures is the consistency of the size of your red blood cells. However, perhaps it’s saying something much broader about your overall cell proliferation and clearance of old cells (as indicated in that graphical abstract).
And for me, taking Rapamycin at only 2mg per week, it lowered my RDW from around 12.8% down to 11.5%.
I wonder if the timing of the blood test (days after rapamycin dosing) has an effect on the blood measure for RDW. I think I’ll try doing a few blood tests after dosing rapamycin to check on this issue.
Over the past 5+ years I’ve been taking rapamycin my RDW has ranged between 11.7 and 12.7. But I’ve not really paid much attention to timing of the blood draw relative to my last rapamycin dose.
I’m not sure. But RDW reflects the distribution, so once you add new cells into the mix (or change clearance of old cells), you’d change the RDW.
For example, for someone with simple iron deficiency, MCV of 75, and they start taking iron and producing cells of MCV 90, you’d get a huge spike in RDW because there are two populations of RBCs in circulation. Over the ~120 days taken to normalise to MCV 90, the RDW would then shrink again.
Same for somebody with folate deficiency and an MCV of 120 going down to a normal MCV of 90.
So if you take 120 days as an average, that means you turn over 0.83% of your RBC population every day. That would mean that the largest RDW should occur around the middle point, when you have equal mixtures of old and young cells - so around 2 months after an intervention.
However, there is also the clearance size, where your spleen should be removing the crappy cells. So that might bring it down to 30-40 days, rather than 60 days.
If you’re taking Rapa weekly, I can’t think of how the blood test timing within a 7 day window would greatly affect RDW. Even if Rapa gave a fairly dramatic change in MCV, you don’t have enough cell production in a week to really move the RDW measurement IMO.
Yeah, I was about to point that out too. Too little time for rapa to impact those numbers. Same thing with A1c, you need at least 30-90 days to see this move in case rapa disregulates your glucose. You must look at every biomarker separately to see how much time to see impact.
In the Levine PhenoAge algorithm, Red Blood Cell Distribution Width (RDW) has a positive directional coefficient. This means:
Higher RDW: Increases a person’s calculated Phenotypic biological age. If your RDW is elevated relative to your peers, it acts as an accelerator, pushing your biological age higher than your chronological age.
Lower RDW: Decreases (or optimizes) a person’s calculated Phenotypic biological age. A lower, tighter distribution of red blood cell sizes contributes to a younger biological age estimate.
Why RDW Matters in Geroscience
RDW measures anisocytosis , or the variation in size and volume of circulating red blood cells. While traditionally used in hematology solely to diagnose subtypes of anemia, gerontological research has elevated RDW into one of the most robust, independent predictors of all-cause mortality, cardiovascular disease, and functional decline.
An elevated RDW reflects underlying biological dysfunction:
Systemic Inflammation: Pro-inflammatory cytokines (like IL-6 and TNF-alpha) suppress bone marrow erythropoiesis and alter iron metabolism, leading to uneven red blood cell production.
Oxidative Stress: Increased oxidative damage shortens red blood cell survival time, forcing the bone marrow to pump out cells of varying sizes to compensate.
Microvascular and Metabolic Strain: High RDW correlates with impaired tissue oxygenation, metabolic syndrome, and accelerated cellular senescence.
Unpacking the “lower is better” take, it looks more like “not elevated is better.” Risk is roughly flat through the lower part of the reference range and bends upward somewhere around 13-13.5%. I’m looking further at NHANESIII to see if there is large scale evidence that 11.5%, for example, predicts a lower ACM than 12.5% similarly to the way that 13.5% predicts higher ACM than 12.5%.
What I see so far is that RDW is right-skewed with a biological floor around 11-12%. Even perfectly uniform production leaves irreducible heterogeneity from reticulocyte maturation and volume loss in senescent cells.
OK. I found that RDW is not standardized across machines and the two common metrics forms vary. A 13%" on one machine can be from 0.5 to 1.0% different on another. This blurs any pooled threshold estimate.
What seems most defensible is that you want to be below 13% and perhaps on multiple machine types (Sysmex, Beckman and Abbott).
While we’re at it, let’s go one step further in measurement science to point out the weaknesses, some better described as inferential errors, in applying these kinds of markers at the individual level.
The inferential problems come from how these markers are validated. Hazard ratios, splines, and quartile contrasts describe populations. An individual is one random draw from a distribution those statistics only summarize. This leaves a very large inferential gap. A few points to unpack that:
Association strength is not discrimination. A per-SD hazard ratio that emerged clearly in a 250,000-person cohort is usually characterized by heavily overlapping distributions between people who die and people who don’t. (The wannabes don’t even bother with dying; the simulate it statistically). Looking at the MVX as I have of late, as a rough approximation, treating the per-SD HR as an odds ratio, a per-SD ratio of 1.3 (in ~ 0.26) implies an AUC of only about 0.57 for the marker alone as the range MVX occupies in general-population data: in PREVEND, the adjusted HR per SD was 1.32 in people with no chronic disease and 1.29 in the multimorbid. RDW’s extreme-category contrasts (HR ~3 for >15% versus <12.5%) look stronger, but they compare tails and leave the large middle of the distribution unaddressed. I am not the first measurement scientist to make the point that a marker needs odds ratios in the dozens before it classifies individuals well (I can dig up some references for anyone interested). Almost nothing in the aging and mortality biomarker space comes close.
Stacking markers yields diminishing returns. I see too many discussions based on a tacit and generally incorrect assumption that combining weak signals yields a strong one. You can see some of that if the behavior of the components show they carry independent information. This history is full of instances in which a dozen biomarkers improved the C-statistic only marginally over conventional risk factors and not always across the full distribution. The MVX, for example, is already a composite of six NMR analytes. Labcorp describes it as combining an inflammation sub-index (from GlycA and small HDL particles) with a metabolic malnutrition sub-index (from branched-chain amino acids and citrate). It could be that much of what it adds over RDW, albumin or CRP is re-measuring the same latent construct with a different assay. We’ll see.
My background take on metrics such as RDW, GlycA, albumin, BCAA depletion, NLR, cystatin C and others is that they are partial, noisy indicators of something like diminished physiological reserve: an inflammation–malnutrition–senescence axis. That predicts outcomes non-specifically, loses its individual contribution once modeled together, and shows threshold or hockey-stick shapes, flat until the underlying stressor engages. This is all speculation, of course.
A longstanding theme for me is within person biological variation in relation to the significance of markers. This individual-level noise compounds the problem.
There is also a conceptual limit. An individual’s “risk” isn’t an observable property. It depends on the reference class you assign the person to, and each added covariate redefines that class. So “your MVX is 72” is shorthand for “people who resemble you on these six analytes had X-fold relative mortality.” That is a population statement that does not track back to you.
Taking the other side, lest I feel like an idiot for paying any attention whatsoever to clocks, indices, calculators, and the like:
Serial measurement against the person’s own baseline can be very useful because within-person change removes much of the between-person confounding that dilutes cross-sectional discrimination. The question for RDW, for example is not is my 12.5% okay, but which direction am I headed.
In contrast to what I said above, extreme values – distributional outliers – can and usually do mean something, and may prompt a workup. An RDW of 16.5% or a very high MVX should prompt a search for inflammation, malnutrition, occult malignancy, or marrow stress. It should not be read as a prognosis.
Most important for those of us in this group is that discrimination and calibration are properties of a prediction, while clinical value is a property of a decision. A marker can predict well and still be clinically useless if it never moves anyone across a line where management changes. Safe to say that we are all about making an acting upon decisions.