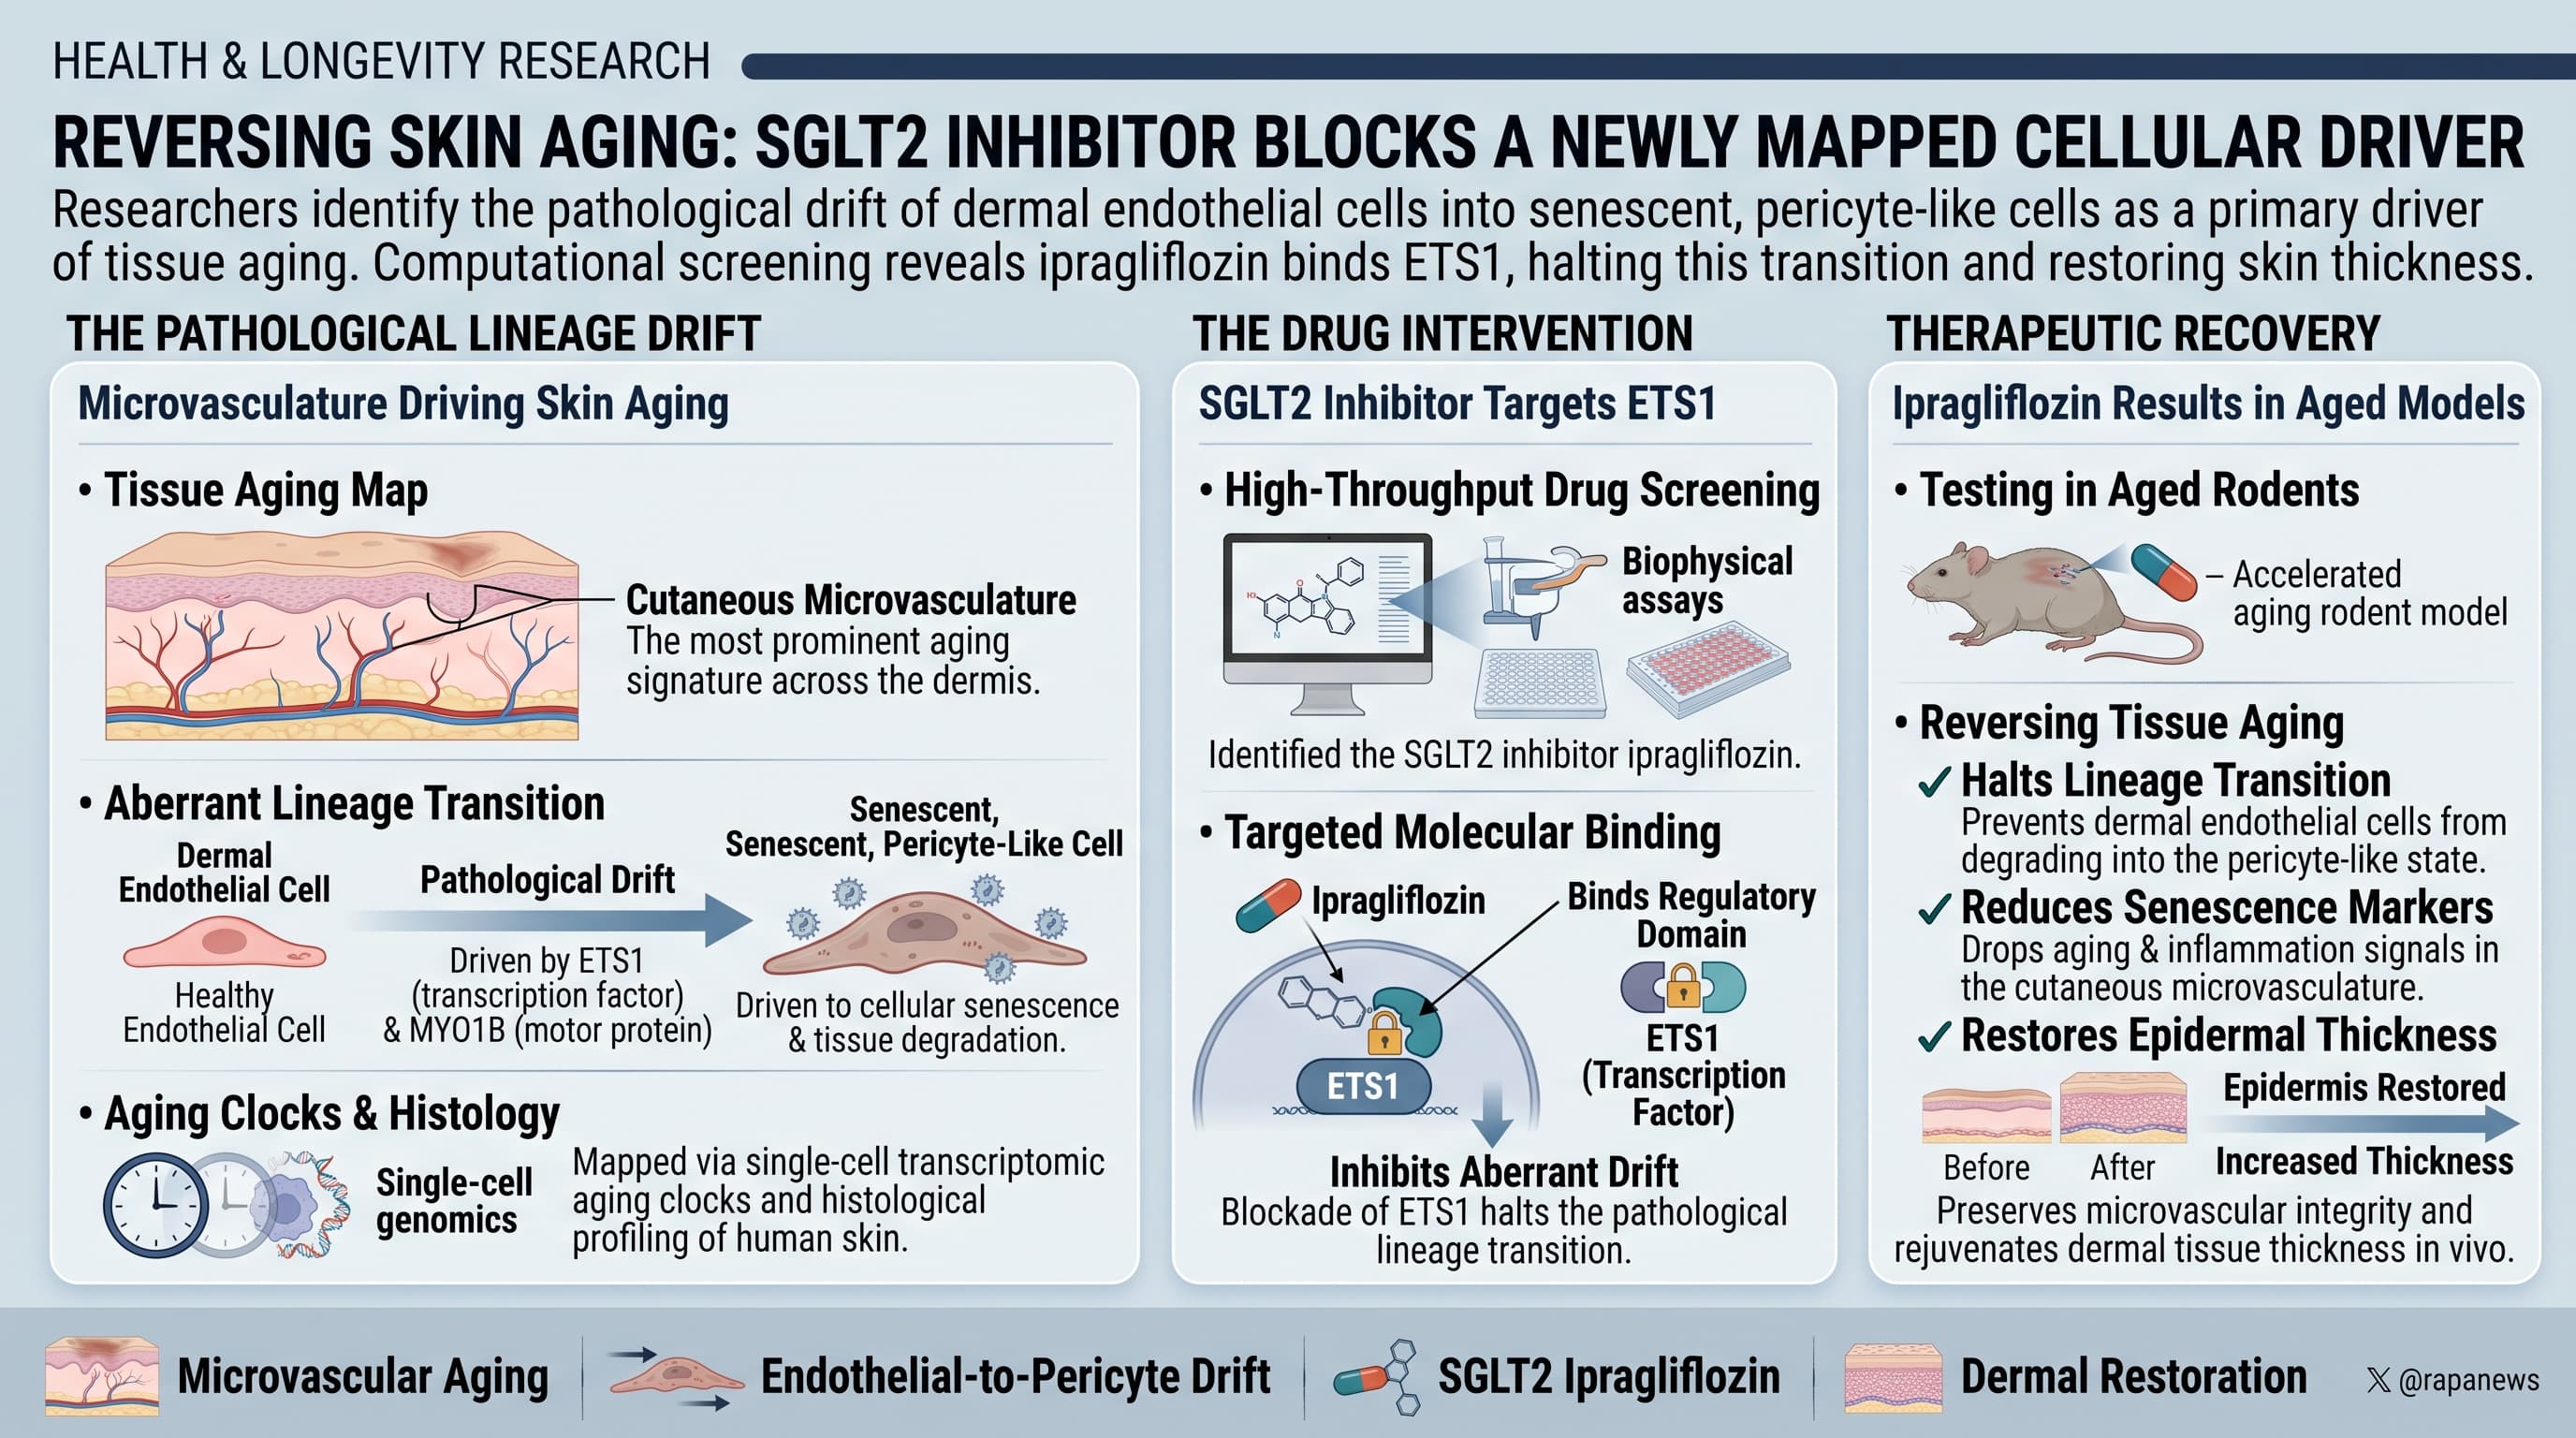
A Chinese team built a single-cell “aging clock” from three published human skin datasets and found that the small blood vessels of the skin carry the strongest age signal. They propose that, under chronic inflammation, vessel-lining endothelial cells drift toward a pericyte-like, senescent state marked by the motor protein MYO1B and controlled by the transcription factor ETS1. A computer screen of a drug library flagged the SGLT2 inhibitor ipragliflozin as an ETS1 binder. The drug lowered MYO1B and senescence markers in a cultured endothelial cell line and partially restored epidermal thickness in young rats given D-galactose to mimic aging.
Skin aging is usually told as a story about collagen, sunlight and fibroblasts. This paper argues that the plumbing matters more than we thought.
The researchers pooled three public single-cell RNA datasets of human skin and trained a machine-learning model to guess a donor’s age from gene activity in each cell type. Across 18 donors, predicted age tracked real age reasonably well. The interesting part was where the signal came from. Blood vessel endothelial cells, lymphatic endothelial cells and pericytes, the support cells that wrap around capillaries, were the cell types whose gene activity most consistently tracked age.
Within the pericytes, one subgroup was more common in older donors and carried high levels of MYO1B, a motor protein tied to the cell’s internal skeleton. When the team lined up endothelial cells and these pericytes computationally, they formed a continuous gradient rather than two separate islands. The authors read this as endothelial cells slowly converting into pericyte-like cells with age, a process they call endothelial-to-pericyte transition, or EndoPT.
To test the idea, they bathed a human endothelial cell line in two inflammatory signals, TGF-beta1 and IL-1beta, for a week. The cells lost an endothelial marker, gained pericyte markers including MYO1B, and stained positive for senescence. Silencing the transcription factor ETS1 cut MYO1B expression by roughly 70 percent and reduced senescence staining, and ETS1 was found sitting on the MYO1B gene’s promoter. That gives a plausible chain: inflammation switches on ETS1, ETS1 switches on MYO1B, and the cell shifts identity and senesces.
Then comes the leap. The team docked more than 4,000 drugs against a predicted structure of ETS1. Ipragliflozin, a diabetes drug sold in Japan, ranked third. A binding assay showed the drug sticking to purified ETS1 in a concentration-dependent way, and in cells it lowered MYO1B and two senescence genes. In rats given D-galactose for eight weeks, a standard chemical shortcut for mimicking aging, daily ipragliflozin left the epidermis about 50 percent thicker than in untreated D-galactose rats, though still far thinner than in healthy animals.
The big idea is worth taking seriously: skin aging may be driven partly by a deteriorating vascular niche, and that niche may be druggable. Independent work already links SGLT2 inhibitors to senescent-cell clearance and vascular protection.
But the gap between the idea and the proof is wide. The human evidence comes from 18 donors in the clock and 15 tissue samples whose body sites differ between the young and old groups. The cell identity shift is inferred from snapshots, not tracked in living tissue. The rats were juveniles, all male, six per group, and the study never checked whether the drug’s known whole-body effects on glucose and metabolism explain the skin result. The claim that ipragliflozin works by binding ETS1, rather than through its ordinary pharmacology, rests on computer modeling and one binding experiment with no reported affinity.
Insights
To put the headline result in real-world terms: D-galactose thinned rat epidermis from about 14 micrometers to about 5 micrometers. Ipragliflozin brought it back to about 8 micrometers. That is a gain of roughly 2.6 micrometers, or about 30 percent of the lost thickness recovered. Treated skin was still around 43 percent thinner than healthy skin. The standardized effect size (Cohen’s d) works out to about 1.4, which is “large” on paper, meaning a randomly picked treated rat would have thicker epidermis than a randomly picked untreated one about 85 percent of the time. With only six rats per group, though, the plausible range for that effect runs from trivial to enormous. All of these figures are my estimates read from the paper’s bar chart, since the authors give no numbers in the text.
The rat dose translates to roughly 110 mg per day for a 70 kg adult, about double the standard 50 mg clinical dose.
The practical takeaway is modest: vascular health and chronic inflammation are reasonable things to care about for skin aging, and people already on an SGLT2 inhibitor for medical reasons have one more speculative reason to consider.
Ipragliflozin, jointly developed by Astellas Pharma and Kotobuki Pharmaceutical and commonly sold under the brand name Suglat, is approved and commercialized in Japan, South Korea, Russia, Taiwan and China.
Context and Source
- Open Access Paper: Multimodal profiling uncovers an aging-associated ETS1-MYO1B vascular niche responsive to ipragliflozin
- Institutions: Department of Dermatology, Shengjing Hospital, China Medical University, Shenyang (lead); and others.
- Country: China
- Journal: Frontiers in Cell and Developmental Biology, published 25 September 2026
- Impact evaluation: The impact score of this journal is 5.3 (Journal Impact Factor; CiteScore 9.9), evaluated against a typical high-end range of 0 to 60+ for top general science, therefore this is a Medium impact journal.