Any reference for this?
For anyone with hours of free time. I’m still working on it:
Regulation and metabolic functions of mTORC1 and mTORC2
https://journals.physiology.org/doi/full/10.1152/physrev.00026.2020
2 Likes
I started with this article and it is mentioned and discussed in one of the references.
2 Likes
Quick selfish question — can you confirm that the rebound effect was only observed among participants taking Sirolimus alone? Not among the grapefruit juice + Sirolimus folks?
I take 4-6 mg + GFJ weekly and I wonder if I should be translating my dose to an effective dose based on common amplification coefficients for GFJ and … possibly worry, or breathe a sigh of relief. It wasn’t clear to me that the rebound was only observed among those who took sirolimus alone but I didn’t comb the supplemental tables very closely.
1 Like
Another thing to consider is that Rapa doesn’t follow a standard 1/2 life curve like the calculator above is generating. If you look at any of the papers graphing rapa levels in whole blood it shows a spike (cmax) at about 90 minutes after ingestion. However, it initially doesn’t decay according to T1/2 kinetics. It drops precipitously and then conforms to half life kinetics. Take one of the graphs and you’ll see that a dose that generates a cmax of 25ng/ml has a value of 8-10 ng/ml 12 hours later. T 1/2 of rapa is 65 hours. if you take a value later on the curve (say at 24 hours) you can then predict the 65 hour reduction by half.
4 Likes
Yes - I think the first two hours does not follow a typical spike and fall-off, as shown here:
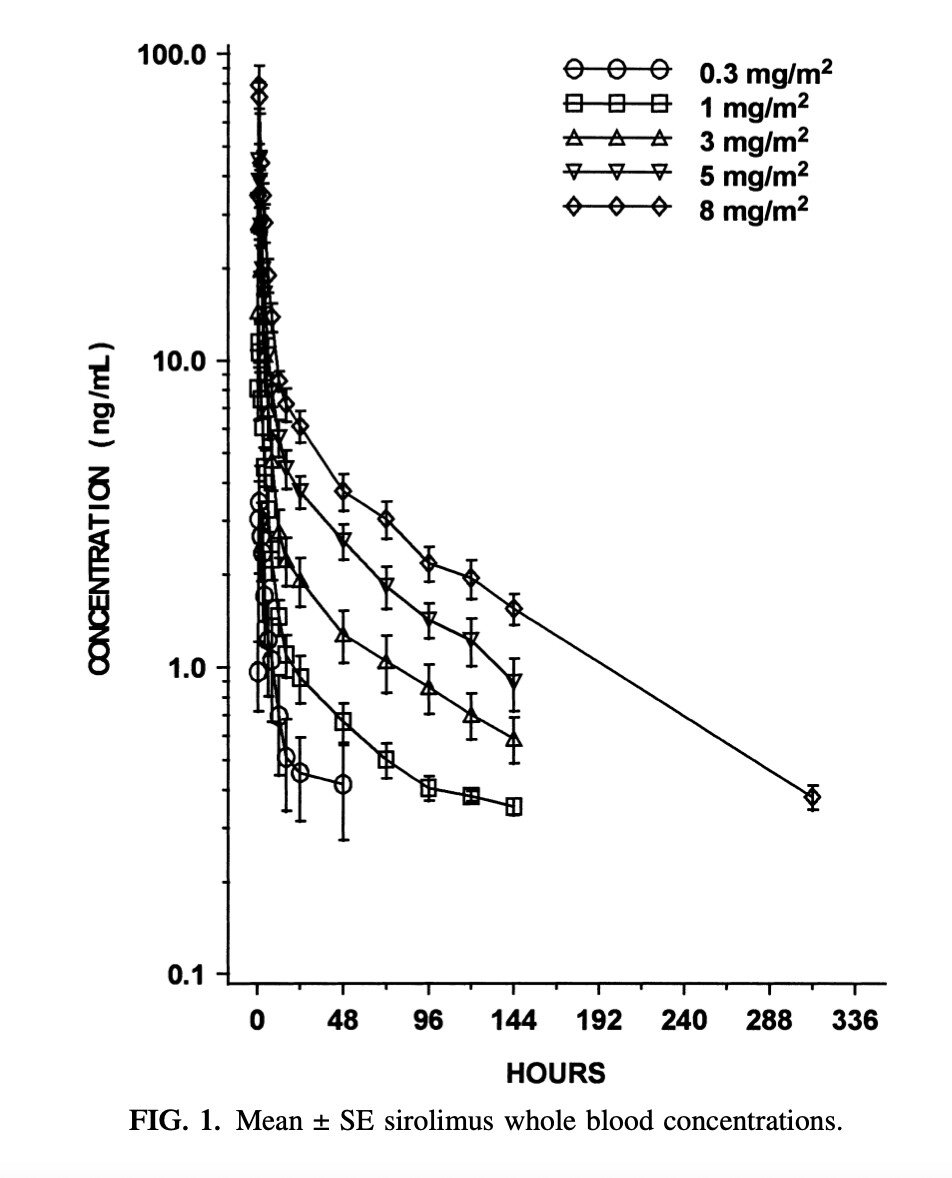
Source: What is the Rapamycin Dose / Dosage for Anti-Aging or Longevity?
2 Likes
Yeah that graph, which gets shown a lot in threads, always confused me, because it doesn’t show a true half life of 65 hours. Maybe we should stop saying rapamycin has a half life of 65 hours?
65 hours is used as an approximation or good enough simplification. The reality is that absorption and pharmakinetics is hugely dependent on personal biology and even rapamycin source.
1 Like
They only performed a rebound analysis in the sirolimus-alone study, so there’s no data to directly answer your question. But, since the rebound was driven by the concentration of rapamycin, I can’t envision a mechanism for how GFJ could increase the concentration without incurring the same risk of a rebound.
The GFJ approach does, however, reduce the total amount of rapamycin that your digestive tract sees. The dynamics here potentially resemble daily dosing:
So, GFJ might reduce the mTOR rebound in the digestive tract by lowering its total rapamycin exposure. This is just a biologically plausible speculation, though. And, either way, I don’t see it influencing the risk of a rebound elsewhere in the body.
I wish I could give you the relief of a well-designed clinical trial! But, lacking that, I’ll re-emphasize that the doses leading to an mTOR rebound in (Cohen et al. 2012) are much higher (up to 90 mg) than the doses most of us use. The “low doses” in this study were 10 mg and 20 mg.
5 Likes
While duration does contribute to rapamycin’s inhibition of mTORC2 assembly, I think it’s dose that drives the mTORC1 rebound.
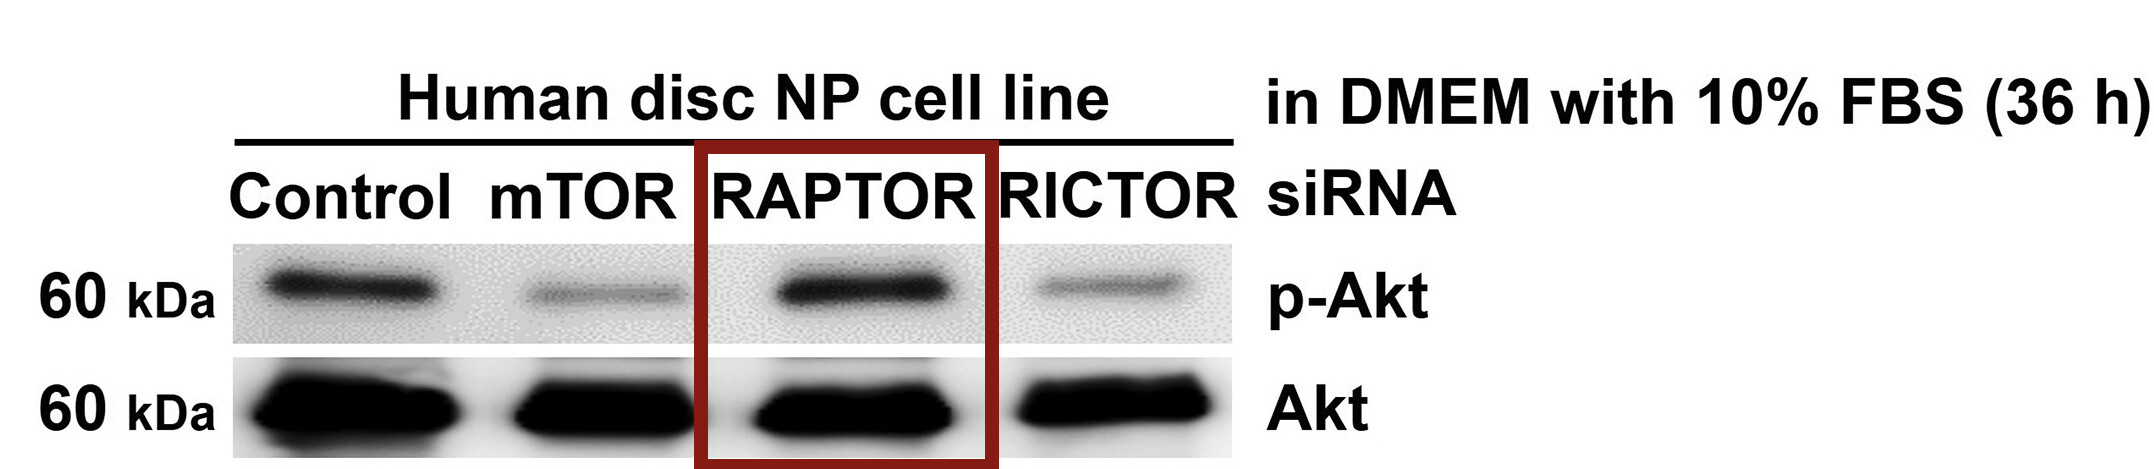
If that’s the case, an equivalent dose of everolimus (with a shorter half-life) and genetic mTORC1 knockdown (e.g. with siRNA targeting RAPTOR) would both drive a rebound so long as the inhibition was strong enough. If, instead, it’s the duration, than we should see no (or at least less) rebound with treatments that clear the body more quickly.
Background/Context: I’m using activation of Akt as an indicator of the mTOR rebound. Why? See (Rozengurt et al. 2014) for the details, but in short mTORC1 inhibits IRS1/2 and mTORC2 under normal conditions. Releasing this inhibition (through, for example, rapamycin) can overactivate AKT and MEK/ERK, which then both increase mTORC1 upstream (by inhibiting TSC2).
Everolimus and the mTOR Rebound
I don’t have time for a deep dive into the literature today, but (Wood et al. 2021) indicates that everolimus can also induce a rebound (and includes three references):
The relative ineffectiveness of everolimus monotherapy has been attributed in part to resistance via rebound Akt hyperphosphorylation and unrestrained HIF-2α expression (Battelli and Cho 2012), (Bhatt et al. 2008), (Sarbassov et al. 2005)
@John_Hemming may be interested to know (or already know) that:
when HDAC inhibitors were combined with mTOR inhibitors in preclinical studies, the rebound Akt hyperphosphorylation seen with mTOR monotherapy was muted
Genetic mTORC1 Inhibition and the mTOR Rebound
(Ito et al. 2017) used siRNA against the mTORC1 component RAPTOR and showed the same rebound Akt hyperphosphorylation in human disc nucleus pulposus (NP) cells:
Taken together, these papers point to dose rather than duration driving the rebound. If you have thoughts and evidence that point to duration, I’m happy to hear them.
2 Likes
I was not aware of this. Which paper is it in?
Obviously HDACi s have some effect on transcription (particularly of longer genes) potentially they could make the cellular logic more responsive. However, I would like to read the paper that made this comment if you could give me a reference.
Sadly, this is exactly the data I wanted, but that neither the lead author nor the senior author were able to provide:
And the response (from memory) was that higher concentration = more rebound. No other characteristics predicted a rebound.
So, we do not have a table of patient doses and phospho-p70S6K levels over time. Instead, we have summaries from two of the authors and the pharmacokinetic-pharmacodynamic (PK-PD) model from the paper. That model supports the same conclusion:
the rebound [expressed as krebound × C’siro] was driven by the concentration of sirolimus
Caveat: My research does not involve (PK-PD) modeling, so I have no special expertise here. But, this is how I interpret their model.
krebound quantifies how much the rebound effect changes for each unit change in sirolimus concentration. In this experiment, a typical krebound was 11.3 mL/ng.
Csiro represents the concentration of sirolimus in the effect compartment (i.e. where it inhibits mTORC1). It’s not used in the formula above.
C’siro represents the concentration of sirolimus in a separate compartment that models the rebound effect (i.e. where it increases mTORC1). I don’t know enough about this kind of modeling to say in detail how C’siro is calculated (these models are governed by a set of differential equations), but my understanding is that Crebound < Ceffect. Or, specific to this paper: C’siro < Csiro.
That aside, let’s return to their model from above:
Rebound = krebound × C’siro
A typical krebound was 11.3 mL/ng:
Rebound = 11.3 mL/ng × C’siro
So, as C’siro increases, the rebound increases. Or, as the paper puts it “the rebound was driven by the concentration of sirolimus”. My interpretation, based on this model and comments from the authors, is that C’siro remains low until Csiro passes a threshold of strong mTORC1 inhibition.
If the lower doses in this study (10 mg and 20 mg) didn’t cause a rebound, I can’t envision a biologically plausible reason why an even lower dose (6 mg) would. Do you have anything in mind on that front?
3 Likes
Absolutely: Phase I study of the mTOR inhibitor everolimus in combination with the histone deacetylase inhibitor panobinostat in patients with advanced clear cell renal cell carcinoma. This particular trial was negative: the “therapeutic pairing did not appear to improve clinical outcomes in our group of patients with advanced ccRCC”. Still, the combination could have utility in other contexts.
1 Like
IC50 for panobinostat is in the nano molar range (IC50’s against HDAC s 1-9 range between 3 – 61 nM except for a slightly higher IC50 value of 248 nM for HDAC 8.)
I think the anti-cancer activity of HDACis arises from a reduction in aberrant splicing. I don’t know what proportion of cancers arise from aberrant splicing, but clearly quite a few do.
I tried finding the original source for the comment about hyperphosphorylation and it looked like that may be in references 18 or 19 and most likely 19, but a search for hyperp in the references did not find this.
They did reference hyperacetylation which is something I would think more likely to result from HDACi than hyperphosphorylation.
Hence I cannot really comment further.
@McAlister Thank you for your insights and input. It appears that we may want to put an upper threshold on the amount of Rapamycin we take at a given time to less than 20 mg in order to avoid MTOR rebound which can then lead to overactivation of cancer cells.
I will adapt my future Rapamycin plans to this information and limit my dosing to a maximum of 20 mg at a time. Instead of 40 mg over a month, I will break it up into 18 mg (5 mg + GFJ + EVOO) every two weeks. Thank you for this.
This is why an MTOR rebound is bad:
2 Likes
yes, negative feedback loops could be mediated by mTORC2, and lead to enhanced MEK/ERK pathway
A strategy could be to as they say in your link “adding an AKT inhibitor following cessation of PI3K or mTOR inhibitors.” like black seed oil (Nigella sativa).
or adding a ERK inhibitor, to prevent rebound.
But then again, different cancers in different organs have different environment inside the cancer cells. Not all cancers respond to AKT inhibitors or ERK inhibition. If they did, cancer would be extinct. We are as always flying in the dark and navigating with crude instruments.
But I name few natural products that come to my mind. Apigenin (Will it be absorbed?), Pterostilbene, Curcumin, Silibinin, fisetin, Kaempferol.
1 Like
I think the best way to prevent a rebound is to keep your dosage at 20 mg or below to be safe.
I started taking 0.5mg every day for 5 days and break for 5 days. Today I had my bloodwork done. Many bio markers have improved: WBC, MCHC, MPV, BUN, Creatinine, CKD-EPI, Albumin. In fact, all my bio markers are in normal range.
6 Likes
That’s good to know.
2 Likes
I don’t think these graphs show that the 20 mg dose was better: they show differential effects depending on the person’s background exposure to influenza. If anything, I would say even just looking at those two graphs, the 5 mg weekly dose appears slightly better overall. Fig. 2. (Increase in antibody titers to heterologous influenza strains) and Table 3 (Percentages of subjects who seroconverted to heterologous strains of influenza) reinforce that view.
These are mostly small differences regardless — and all of them were with lower doses and a different protocol from the Cohen et al paper.
2 Likes