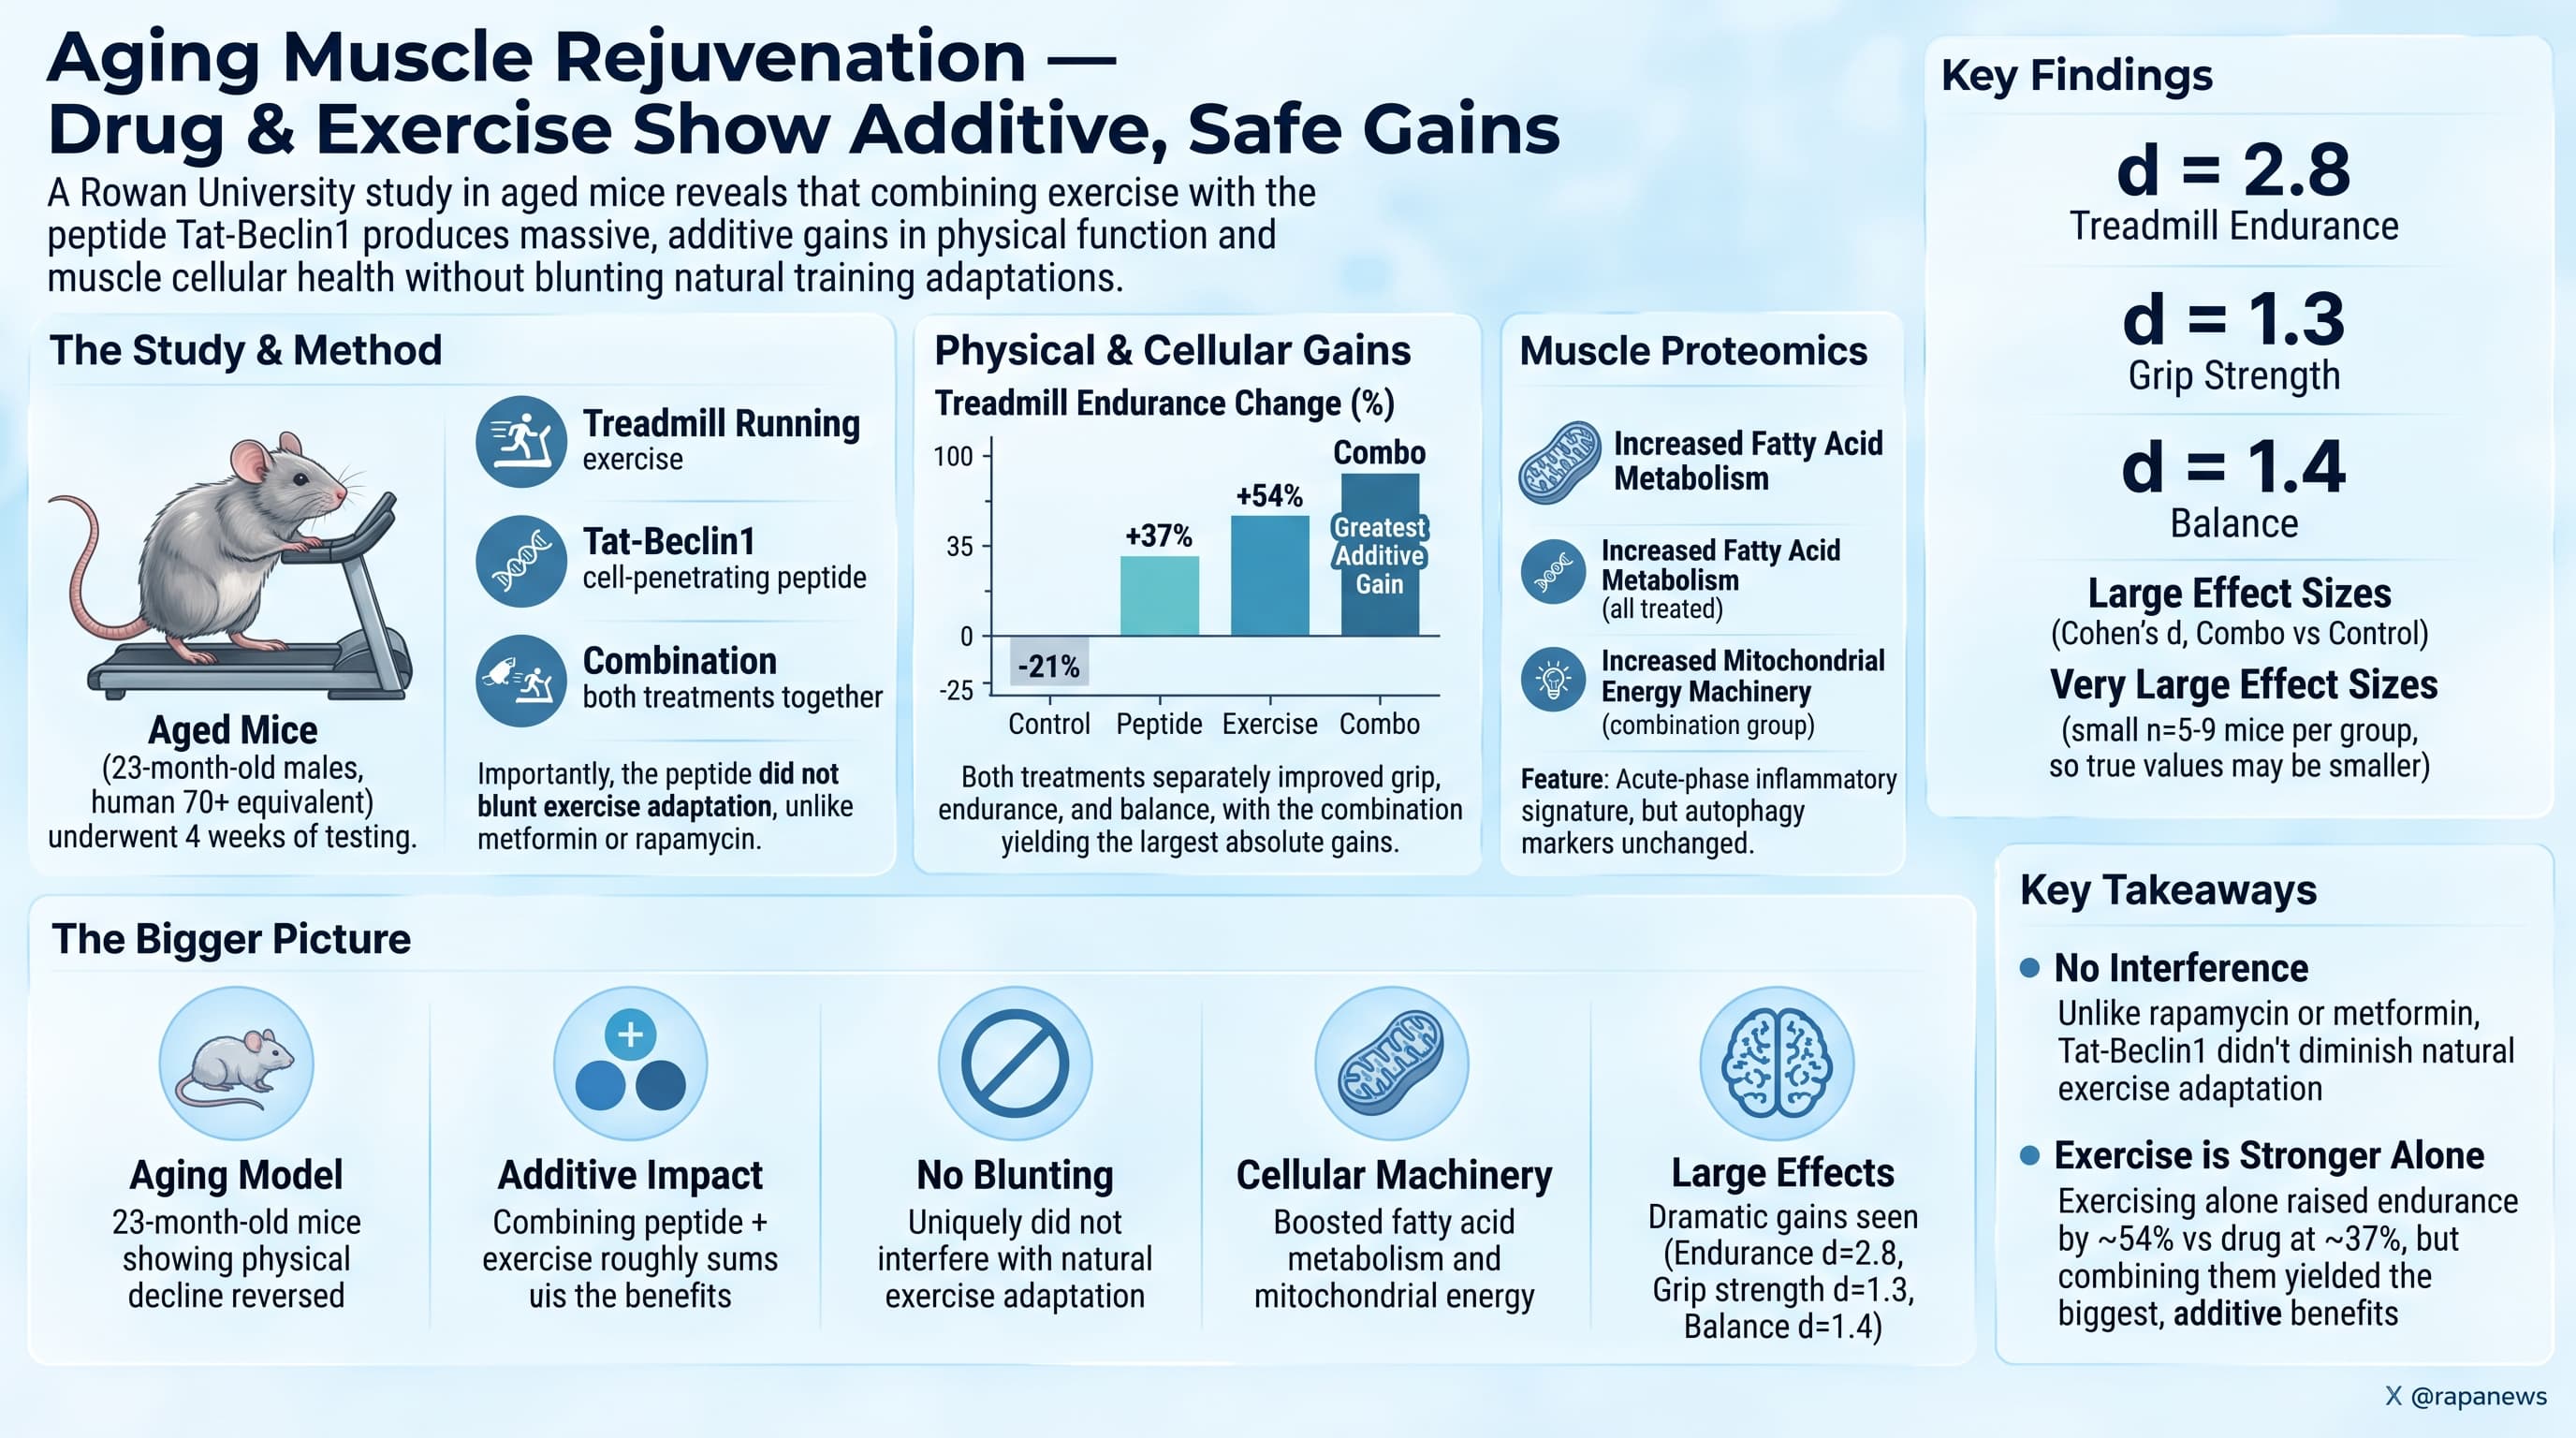
A preclinical study in 23-month-old male mice demonstrates that combining endurance treadmill training with Tat-Beclin1, a synthetic peptide that directly activates cellular autophagy, produces additive improvements in muscle strength, aerobic endurance, and motor coordination. Unlike popular longevity compounds such as metformin and rapamycin, which can blunt some of the beneficial adaptations of exercise when combined, administering Tat-Beclin1 on alternating non-exercise days enhanced physical performance and upregulated mitochondrial energy production alongside protective acute-phase muscle proteins.
Old muscle gets weak, and the cell’s waste disposal system is one reason. Autophagy, the process by which cells digest and recycle their own damaged proteins and organelles, slows down with age. Exercise switches it back on. So does a short peptide called Tat-Beclin1, which works by freeing up Beclin1, a protein that sits at the top of the autophagy cascade, from a molecule that normally holds it hostage.
The obvious question is whether a drug that does what exercise does will help an exercising animal or get in its way. That question is not academic. Metformin, the most widely used candidate geroprotector in humans, has been shown to blunt muscle adaptations to resistance training in older adults and to suppress the mitochondrial response to aerobic training. Rapamycin opposes hypertrophy signaling. The field has a recurring problem: the drugs that extend life in mice often antagonize the single intervention we already know works in humans.
Tchen and colleagues took 31 male C57BL/6J mice at 23 months of age, roughly equivalent to a 69-year-old person, and split them four ways: untreated controls, peptide only, treadmill only, and both on alternating days for one month. They then measured grip strength, time to exhaustion on a treadmill, and balance on a rotating rod, and finished by profiling more than two thousand proteins in the calf muscle.
The controls got worse over the month, which is what you expect from a mouse in its last stage of life. Every treated group improved. The combination group improved most: grip strength up about 42 percent from its own baseline, endurance up about 67 percent, balance up about 60 percent. Statistically there was no interaction between drug and exercise, meaning the two did not amplify each other. They simply stacked, which in this field counts as a win, because the alternative outcome is interference.
The mechanism is the murky part. The authors expected to see autophagy markers rise. They did not. Beclin1, LC3B and p62 were essentially flat in both muscles examined, which the authors attribute to measuring static snapshots rather than flux. What did appear instead was a protein signature of fatty acid oxidation across all treatments, mitochondrial oxidative phosphorylation machinery specifically in the combination group, and a cluster of acute-phase inflammatory proteins, haptoglobin and orosomucoid-1, that are not usually welcome news but which both have published links to protection against muscle atrophy.
In summary, a peptide that activates autophagy improved physical function in very old male mice and did not sabotage their exercise training. It did not do anything that exercise alone could not do, and the molecular story explaining why remains unfinished.
Actionable Insights
While Tat-Beclin1 remains an experimental injectable peptide not yet approved for human clinical use, this study provides immediate strategic lessons for scheduling longevity interventions alongside physical training. First, temporal separation between catabolic stimuli and exercise matters. Unlike daily metformin or frequent rapamycin regimens that clash with exercise recovery, pulsing an autophagy activator on non-training days (Tuesdays and Thursdays) while exercising on Mondays, Wednesdays, and Fridays prevented interference and produced additive functional gains.
In practical terms, the real-world magnitude of combining these interventions was substantial. Using standardized effect sizes (Cohen’s d, where a score above 0.8 represents a large, easily noticeable difference between groups), the combined protocol achieved an estimated effect size of roughly 2.8 for net grip strength (+41.74 percent gain versus a 16.51 percent decline in controls), 4.9 for treadmill endurance (+66.67 percent gain, adding over 8.4 minutes of running capacity), and 2.5 for balance and coordination (+60.28 percent improvement). Even Tat-Beclin1 alone yielded a large effect size of 1.4 for strength and 2.2 for endurance. For longevity practitioners, the takeaway is clear: avoid stacking strong autophagy-inducing agents directly on top of workout windows, and instead alternate cellular cleanup days with aerobic training days. [Confidence: Medium]
Context and Source
- Open Access Paper: Adding Tat-Beclin1 to an endurance training program promotes additive improvements in physical function in aged male mice (pdf), Published Sept. 2026.
- Institutions: Cooper Medical School of Rowan University, Rowan University, Children’s Hospital of Philadelphia, Oklahoma Medical Research Foundation, and University of Iowa
- Country: United States of America
- Journal Name: Physiological Reports
- Impact Evaluation: The impact score of this journal is 2.2 (Journal Impact Factor; CiteScore 4.1), evaluated against a typical high-end range of 0-60+ for top general science, therefore this is a Low impact journal.