Pregnancy Ages the Body. The Time Between Babies May Decide Whether It Sticks

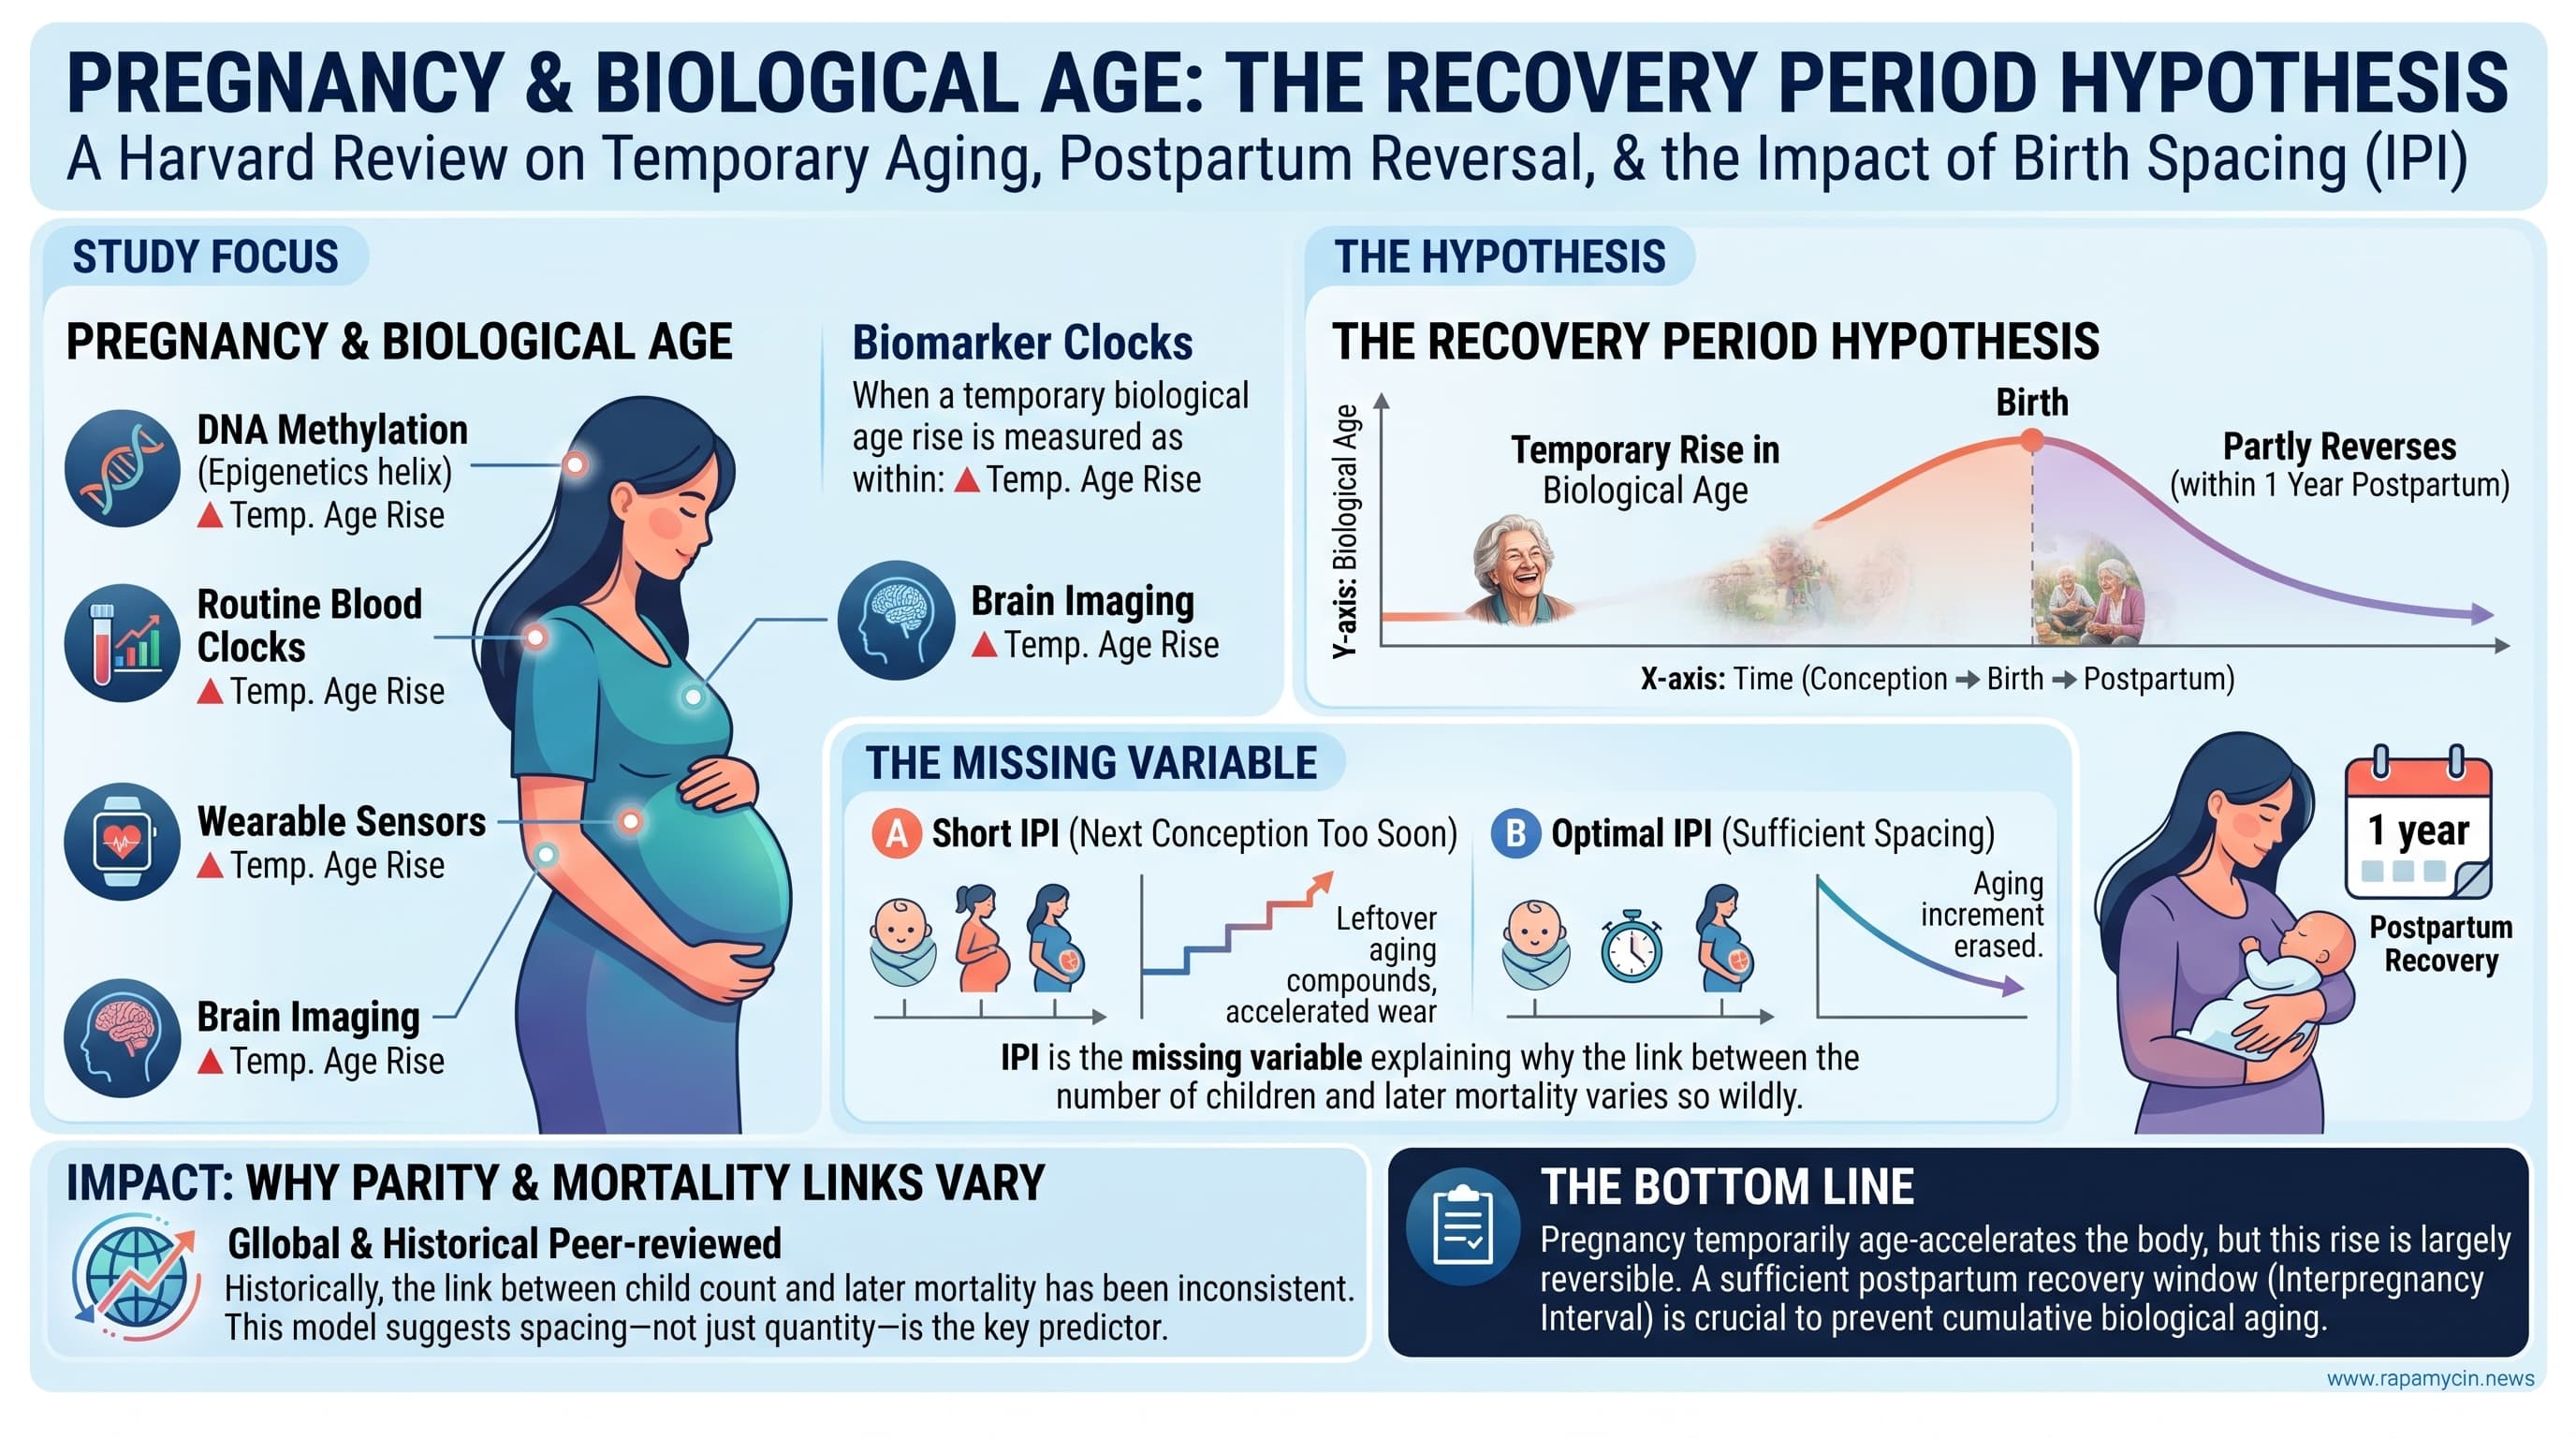
This Harvard review pulls together evidence that pregnancy temporarily raises biological age. The rise shows up in DNA methylation clocks, routine blood test clocks, wearable sensor clocks and brain imaging, and it partly reverses in the year after birth. The authors propose a “recovery period hypothesis”: each pregnancy leaves an aging increment that can be erased with enough time, but if the next conception comes before recovery finishes, the leftover increment compounds. On this view the interpregnancy interval (IPI) is the missing variable that explains why the link between number of children and later mortality is so inconsistent across populations.

Pregnancy is one of the hardest things a healthy human body does. Blood volume rises by about half, the immune system is rebuilt in stages, cortisol climbs, and a new organ, the placenta, is built from scratch. In the past few years, researchers using biological age tests have found that this upheaval leaves a measurable mark. In cohorts from Europe, the United States, Israel and the Philippines, methylation clocks, routine blood tests, brain scans and even smartwatch sensors show mothers looking biologically older as pregnancy advances. They then partly bounce back in the months after birth.

A new review from Stephen Albright and Jesse Poganik at Brigham and Women’s Hospital and Harvard Medical School asks the obvious next question. If pregnancy pushes the clock forward and the postpartum period pulls it back, what happens when the next pregnancy starts before the reset is finished?

Their answer, the recovery period hypothesis, is that each pregnancy deposits an aging increment that can largely be erased given time. If the next conception comes too soon, the leftover increment carries forward and stacks onto the next one. Over several closely spaced pregnancies, a woman could drift onto a steeper aging trajectory than another woman with the same number of children who spaced them further apart.

The idea is appealing because it might solve a long-running puzzle. Large studies often find a U-shaped link between births and later mortality. Women with two or three children tend to do best, while women with none, or with five or more, do worse. But the size of that effect varies widely between populations. The authors argue that spacing, not the count alone, may be the hidden variable. Where births are well spaced, high parity would cost little. Where short intervals are common, the costs would pile up.

Some evidence points their way. A study following 130 women for nearly four years after birth found that those who became pregnant again showed a disrupted slowdown in their pace of aging. Among mothers 35 or older, conceiving six months after a birth rather than 18 months was linked to more than double the risk of death or severe complications, a gap not seen in younger mothers. And a randomized trial of nurse home visits, which lengthened birth spacing among low-income first-time mothers, recorded far fewer maternal deaths over two decades in the visited groups.

None of this proves the hypothesis. No study has yet tracked interval length alongside biological age for decades. The clocks were built in non-pregnant people and may be reading normal pregnancy physiology as “aging.” Studies of Tsimane forager women found little lasting cost from frequent births, and a recent brain imaging preprint suggests the maternal brain may end up looking younger than it did before conception.

What the review offers is a sharp, testable frame. The authors propose a cumulative interval burden score, similar to pack-years for smokers, and outline cohort and sibling designs that could confirm or kill the idea. If it holds, postpartum care and birth spacing could become some of the most accessible tools in aging medicine.

Actionable Insights

  • Spacing. The best-supported window is roughly 18 to 24 months from delivery to the next conception. A meta-analysis of about 47 million pregnancies found the best birth outcomes at 18 to 23 months. For mothers 35 or older, conceiving at 6 months rather than 18 months raised the risk of death or severe complications from 0.26% to 0.62%. That is a 2.4-fold relative increase, but in absolute terms it is about 1 extra serious event per 280 pregnancies. For women aged 20 to 34, maternal risk did not differ.
  • Breastfeeding. Exclusive breastfeeding was linked to a lower biological age at 3 months postpartum, about one year younger on average in that study. This is observational, and breastfeeding also naturally lengthens spacing.
  • Prepregnancy weight. Higher BMI predicted higher biological age at every time point measured. Reaching a healthy weight before conception is a low-risk, reasonable target.
  • Sleep and stress. These are plausible modifiers of recovery, but they are untested in the postpartum window.
  • Keep it in proportion. In longitudinal data, each pregnancy adds about 2.4 to 2.8 months of epigenetic age. That is small next to the several-year spread that is common between people of the same age.

Context and Source

  • Paywalled Paper: The postpartum recovery window as a determinant of maternal aging, Published October 22, 2026.
  • Institution: Division of Genetics, Department of Medicine, Brigham and Women’s Hospital, Harvard Medical School, Boston
  • Country: United States
  • Journal: Trends in Endocrinology & Metabolism (Cell Press/Elsevier)
  • Impact Evaluation: The impact score of this journal is 20.1, evaluated against a typical high-end range of 0 to 40+ for endocrinology and metabolism, therefore this is a High impact journal.

Biomarker Data (Effect Size Extraction)

A quick guide to the numbers. A relative risk (RR) or odds ratio (OR) of 2 means double the risk. The absolute difference tells you how many people out of 100 are actually affected. “Clock years” are model outputs, not calendar years.

Finding Source (N) Effect What it means in practice
DNAm age rise across pregnancy (about 200 days) Panelli 2025 (75) +1.58 years (Hannum) to +5.28 years (PhenoAge) beyond controls Large in clock units. Likely inflated by pregnancy-related shifts in blood cell types [Confidence: Medium]
Lab-test clock across gestation Clalit (>300,000 pregnancies) Down about 5 years in trimester 1, up about 20 years near delivery, roughly 1 year to recover A 20-year swing in 9 months cannot be true aging. The clock is reading pregnancy physiology [Confidence: High]
Wearable PPG clock Apple study (213,593) Median +3.5 years, slow postpartum normalization Cardiovascular readouts recover more slowly than methylation readouts [Confidence: Medium]
Cost per pregnancy Ryan 2024 (1,735) +2.4 to 2.8 months longitudinally; +4.0 to 14.2 months cross-sectionally Four pregnancies would add about 10 to 11 months. Assuming a between-person SD of about 3 to 4 years in age acceleration, that is roughly d = 0.05 to 0.1 per pregnancy, which is very small. This is my estimate, not the authors’ [Confidence: Medium]
Reconception disrupts recovery Etzel 2026 (130, saliva) DunedinPACE interaction b = 0.20 (SE 0.07) About 0.2 extra biological years per calendar year, or roughly a 20% faster pace. This is large relative to typical between-person variation, which hints at overestimation in a small subgroup [Confidence: Low]
Exclusive breastfeeding Pham 2024 (119) About 1 year lower biological age at 3 months postpartum vs formula Modest. Confounded by BMI, socioeconomic status and spacing [Confidence: Low to Medium]
First-trimester GrimAge2 and complications Panelli 2025 OR 1.36 per clock-year Each extra year of GrimAge2 means 36% higher odds of a composite of preeclampsia, gestational diabetes, preterm birth or small-for-gestational-age birthweight [Confidence: Medium]
IPI 6 vs 18 months, mothers 35 or older Schummers 2018 (148,544 pregnancies) 0.62% vs 0.26%; aRR 2.39 (95% CI 2.03 to 2.80) Absolute increase of 0.36 percentage points, or about 1 extra severe event per 278 pregnancies. This measures acute peripartum risk, not aging [Confidence: High for the association]
IPI 6 vs 18 months, mothers 20 to 34 Schummers 2018 0.23% vs 0.25%; aRR 0.92 (0.83 to 1.02) No maternal effect in younger women [Confidence: High]
Nurse home visiting RCT Olds 2014 (1,138 mothers) 21-year maternal mortality: 3.7% in controls, 0.4% with prenatal plus postpartum visits, 2.2% with extended visits RR about 0.11 and 0.59 respectively. The 0.4% arm (n = 230) is about one death, so the result is fragile, and spacing is not isolated from the many other effects of the intervention [Confidence: Low for an IPI-specific effect]
Preeclampsia and later CVD; gestational diabetes and later type 2 diabetes Bellamy meta-analyses About 2-fold CVD risk; up to about 7-fold type 2 diabetes risk These are robust links between pregnancy complications and later disease, not effects of the interval [Confidence: High]
Parity and mortality Finnish Twin Cohort (14,836) U-shaped: lowest risk at 2 to 3 births, higher at 0 and at 5 or more Hazard ratios are not reported in the review, so magnitude cannot be stated here

Median and maximum lifespan extension: N/A. There are no lifespan intervention data.

Mechanistic Deep Dive

The review’s stated drivers are the immune shift from a tolerogenic state toward a pro-inflammatory state at parturition, rising reactive oxygen species from expanded neutrophil activity, cortisol driven by placental CRH, partial offset by a roughly 100-fold rise in estrogen (via telomerase activation and mitochondrial efficiency), and postpartum prolactin and oxytocin dominance in breastfeeding mothers. The authors do not engage the canonical longevity pathways. What follows maps the hypothesis onto them, and is my extrapolation rather than the paper’s.

  • mTOR. Late gestation is an anabolic, insulin-resistant state, with maternal hepatic and beta-cell expansion driven by lactogens and with placental mTORC1 nutrient sensing. Sustained anabolic signaling across back-to-back pregnancies is a plausible substrate for compounding. [Confidence: Low]
  • AMPK. Lactation imposes a large energy drain, about 500 kcal per day. That could transiently favor AMPK-dominant catabolic states, which would fit the breastfeeding-recovery association. This has not been tested. [Confidence: Low]
  • Autophagy. Uterine involution and post-weaning mammary involution are massive remodeling events driven by autophagy, lysosomes and apoptosis. Whether systemic autophagic flux sets the speed of epigenetic recovery is unexamined. [Confidence: Low]
  • cGAS-STING. Cell-free fetal DNA and fetal microchimerism expose the mother to foreign nucleic acid that rises toward term, along with placental debris. This is a credible innate-immune input to the inflammatory surge at parturition. No data link it to clock readouts. [Confidence: Low]
  • Mitochondrial dynamics. Estrogen improves mitochondrial efficiency and lowers oxidative stress in vascular tissue, while glucocorticoids and neutrophil-derived ROS push the other way. Mitochondrial DNA copy number, mitophagy markers and the respiratory capacity of peripheral blood mononuclear cells across the postpartum window would be an obvious, cheap addition to existing cohorts. [Confidence: Low]

Organ-specific aging priorities:

  • Cardiovascular: This is the strongest long-term signal. The wearable PPG clock recovers slowly, preeclampsia roughly doubles CVD risk, and IPI shows a J-shaped relationship with CVD in 216,467 women.
  • Metabolic and pancreatic: driven by the gestational diabetes to type 2 diabetes link.
  • Brain: gray matter loss with partial recovery.
  • Coagulation, thyroid and musculoskeletal: these lab markers follow aging-like trajectories, and lactation-related bone loss adds a musculoskeletal concern.
  • Renal and iron indices move opposite to aging, which is direct evidence that composite clocks blend adaptation with damage. [Confidence: Medium]