Mike Lustgarten Video Series

AI And The Future Of Healthspan

I. Executive Summary

This discussion between Dr. Nathan Price (Professor and Co-Director of the Center for Human Healthspan at the Buck Institute for Research on Aging), Dr. Sher Zhang (Co-founder of Healthspan Horizons), and host Dr. Mike Lustgarten examines the transition from reactive sickness care to proactive “Scientific Wellness.” The core thesis asserts that healthspan optimization is fundamentally a computational systems biology problem. While late-stage medical interventions fail because extensive tissue damage has already occurred—exemplified by hundreds of billions of dollars spent on late-stage Alzheimer’s disease therapies with minimal clinical efficacy—up to 45% of dementias are preventable via early multidomain lifestyle interventions (Kivipelto et al., 2015).

Price introduces the “Modifiable Gap” framework, which integrates whole-genome sequencing and polygenic risk scores (PRS) with longitudinal multiomic profiling (metabolomics, proteomics, clinical chemistry, and gut microbiome). The framework establishes that an individual’s genetic architecture defines a baseline prediction floor or ceiling for specific biomarkers (e.g., LDL cholesterol, fasting insulin). The distance between a patient’s measured phenotype and their polygenic prediction represents the modifiable window accessible via lifestyle intervention. Individuals with low polygenic risk for elevated LDL cholesterol show high responsiveness to dietary and lifestyle changes, whereas those in high polygenic risk quintiles demonstrate zero statistically significant lifestyle-driven reduction, requiring targeted pharmacology (Wainberg et al., 2020).

The speakers present longitudinal data from over 3,500 deeply phenotyped individuals demonstrating that healthspan metrics are quantifiable and modifiable. Gut microbiome composition diverges with healthy aging after age 50, characterized by a depletion of core Bacteroides taxa; retaining high Bacteroides dominance into extreme old age predicts decreased 4-year survival (Wilmanski et al., 2021). Furthermore, gut metagenomic profiles fermenting complex carbohydrates into short-chain fatty acids (SCFAs/butyrate) independently predict dietary weight loss success (Diener et al., 2021). To translate these complex interactions into clinical utility, the Buck Institute developed Compass AI—an N-of-1 health intelligence platform utilizing federated AI models, Mahalanobis distance metrics across high-dimensional omic spaces, and environmental exposome tracking. This system quantifies systemic physiological entropy and calculates personalized trade-offs, balancing disease risk mitigation against potential metabolic or endocrine side effects.

II. Insight Bullets

  1. Quantitative Definition of Aging: Aging is defined mathematically as the exponential increase in all-cause mortality hazard over time (Gompertz law), contrasting with inanimate objects (e.g., incandescent lightbulbs) that exhibit constant failure rates.
  2. Economic Pivot toward Healthspan: Economic projections forecast a $2 trillion expenditure shift from end-stage disease management toward proactive health preservation and healthspan extension by 2040.
  3. Preventability of Dementia: Data from the multidomain FINGER trial demonstrate that systematic interventions in diet, exercise, cognitive training, and vascular risk monitoring significantly preserve executive function and prevent up to 45% of non-genetically driven dementias (Kivipelto et al., 2015).
  4. Irreversibility of Late-Stage Neurodegeneration: Late-stage Alzheimer’s drug development yields minimal return on investment because small molecules cannot reconstruct lost neuronal networks; primary intervention must occur decades earlier to maintain cellular energetic health.
  5. Lifespan Heritability: Genomic architecture accounts for an estimated 15% to 50% of human lifespan variance, yet genetic risk profiling remains virtually unutilized in standard primary care medicine.
  6. Contextual Biomarker Interpretation via PRS: Standard clinical biomarkers exhibit differential risk stratification based on genetic context; for example, LDL cholesterol levels show zero correlation with coronary artery disease (CAD) outcomes in individuals with low CAD polygenic risk, but exhibit strong linear predictive power in those with high polygenic risk (Wainberg et al., 2020).
  7. The Modifiable Gap Concept: The numerical delta between a measured blood biomarker and its polygenic risk prediction defines the “modifiable gap”—the specific boundary within which lifestyle and environmental modifications can alter that biomarker.
  8. Differential Lifestyle Responsiveness: Individuals in the lowest genetic risk quintiles for elevated LDL cholesterol achieve significant reductions through lifestyle interventions, whereas those in high polygenic risk quintiles exhibit zero statistically significant lifestyle-driven reduction.
  9. Refinement of Polygenic Variance Models: Modern multi-SNP polygenic models account for over 21% of variance in clinical lipid profiles, allowing precise calculation of lifestyle modifiability versus pharmacological necessity.
  10. Microbiome Uniqueness in Healthy Aging: Beginning around age 50, healthy individuals exhibit progressive gut microbiome compositional divergence (increasing beta-diversity uniqueness), whereas unhealthy individuals retain static, core-dominated microbiomes (Wilmanski et al., 2021).
  11. Survival Prediction via Core Taxa Depletion: Retaining high relative abundance of the core genus Bacteroidesbeyond age 80 strongly predicts decreased 4-year survival, establishing microbial drift toward uniqueness as a hallmark of healthy longevity (Wilmanski et al., 2021).
  12. Metagenomic Prediction of Dietary Weight Loss: Baseline gut metagenomic capacity for fermenting dietary fiber into short-chain fatty acids (SCFAs, e.g., butyrate—a native GLP-1 secretagogue) strongly correlates with successful weight loss, whereas high bacterial capacity to cleave carbs into simple sugars impairs weight loss (Diener et al., 2021).
  13. Metabolic BMI Discrepancy: Multiomic machine learning models calculate a “Biological BMI” from blood plasma metabolomics/proteomics that frequently reveals severe underlying metabolic dysregulation in individuals with normal standard body mass index scores.
  14. Microbiome Modulation of Statin Response: Bacteroides-enriched gut microbial profiles are associated with a twofold greater reduction in LDL cholesterol under statin therapy, while specific gut compositions modulate the risk of statin-induced new-onset diabetes [Source unverified in live search].
  15. Calibration of Biological Age Algorithms: Applying the Klemera-Doubal Method (KDA) across multiomic datasets forces a population slope of 1.0 year/year, establishing a rigorous metric to evaluate whether therapeutic interventions alter biological aging velocity.
  16. Measured Reversal of Biological Age Slopes: Longitudinal dynamic tracking of ~3,500 Arivale cohort participants demonstrated an average biological age reduction of 0.16 years per chronological year during structured wellness coaching, with female participants averaging a 0.5 year/year reduction.
  17. Directionality of Biological Age Signals: Across all statistically significant clinical disease states evaluated in dense dynamic clouds, presence of disease is universally associated with elevated biological age; zero disease states correlate with a younger biological age.
  18. Federated AI Privacy Architecture: The Healthspan Horizons platform utilizes federated AI infrastructure, keeping sensitive raw genomic and health data decentralized at the user level while transmitting privacy-preserved machine learning intelligence.
  19. N-of-1 Health Intelligence via Compass AI: Compass AI integrates whole genome sequencing, clinical labs, continuous wearable telemetry, environmental exposome metrics, and multiomics into a personalized generative AI model to project health trajectories.
  20. Mahalanobis Distance Metric for Physiological Entropy: High-dimensional Mahalanobis distance algorithms aggregate multiomic feature sets to quantify biological disorder and detect subtle, presymptomatic health declines prior to out-of-range clinical lab signals.
  21. Exposome Integration: The platform layers zip-code level environmental variables (particulate matter air pollution, ambient temperature extremes, smoke exposure) onto multiomic profiles to isolate environmental drivers of chronic inflammation.
  22. Inherent Biological Trade-Offs: Optimizing single biomarkers induces trade-offs across other physiological axes (e.g., aggressive dietary restriction to lower APOB/LDL-C or Lp(a) can induce steep drops in adrenal androgens like DHEA-S).
  23. Inverse Disease Risk Coupling: Genetic and metabolic pathways that support cellular energetics and protect against neurodegenerative cell death (e.g., elevated mitochondrial respiration) frequently increase long-term oncogenic risk via reactive oxygen species generation.
  24. Inadequacy of Annual Blood Testing: Infrequent annual blood sampling fails to establish dynamic trajectory slopes due to biological variation; 2 to 4 multiomic testing points per year are necessary to calculate true biomarker velocity.
  25. Passive Dietary Context Capture: Emerging AI modalities aim to replace manual dietary logging with passive capture techniques, combining multimodal computer-vision meal analysis, financial transaction categorization, and hair isotopic/metabolomic profiling.

IV. Actionable Protocol (Prioritized)

High Confidence Tier (Level A/B Evidence)

  • Multidomain Lifestyle Protocol for Cognitive Health: Implement a structured multidomain preventive protocol consisting of a Mediterranean-Nordic diet (high complex fiber, low refined sugars), 150+ minutes/week of combined aerobic and progressive resistance exercise, cognitive engagement, and tight vascular risk management (maintaining blood pressure <130/80 mmHg and HbA1c <5.7%) to reduce long-term dementia risk (Kivipelto et al., 2015).
  • Genetically Stratified Lipid Management: Evaluate APOB, LDL-C, and Lp(a) in the context of polygenic risk scores (PRS). If genetic CAD/LDL risk is high, combine lifestyle modifications with early evidence-based pharmacology (e.g., statins, ezetimibe, or PCSK9 inhibitors), as lifestyle changes alone fail to close large genetic gaps in high-PRS individuals (Wainberg et al., 2020).

Experimental Tier (Level C/D Evidence with High Safety Margins)

  • Microbiome Optimization for Short-Chain Fatty Acid Production: Increase daily intake of diverse soluble fibers and resistant starches to promote gut taxa that produce butyrate and propionate (e.g., Roseburia, Faecalibacterium), supporting endogenous GLP-1 secretion and metabolic health (Diener et al., 2021).
  • Longitudinal Biomarker Velocity Tracking: Perform multiomic or expanded clinical chemistry panels 2 to 4 times per year to calculate biological age slopes (e.g., via Klemera-Doubal or biological BMI algorithms) and detect presymptomatic biological drift.

Red Flag Zone (Claims Debunked or Safety Data Absent)

  • Single-Biomarker Optimization Without Multiomic Monitoring: Aggressively manipulating diet or supplements to drive a single marker to extreme levels (e.g., driving APOB/LDL-C to ultra-low levels without monitoring collateral drops in DHEA-S, testosterone, or fat-soluble vitamins) (Safety Data Absent; High Risk of Endocrine Dysfunction).
  • Direct Clinical Decision-Making via Uncalibrated Epigenetic Clocks: Relying on single-timepoint direct-to-consumer epigenetic clock scores to initiate or discontinue prescription medications without confirming underlying clinical chemistry, organ function, and cardiovascular imaging (Safety Data Absent).

Produced by Gemini 2.0 Flash
How I’ve Increased HRV by 53% While Also Reducing RHR

I. Executive Summary

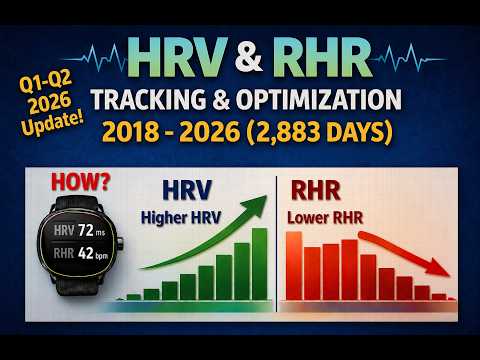
Long-term longitudinal tracking of autonomic nervous system (ANS) tone—quantified via Resting Heart Rate (RHR) and Heart Rate Variability (HRV)—demonstrates that multi-variable lifestyle interventions can reverse age-associated cardiovascular decline. Across nearly 2,900 consecutive days of continuous biometric tracking from 2018 through 2026, Dr. Mike Lustgarten recorded an 18.4% reduction in annual average RHR (dropping from 51 bpm to 41.6 bpm) alongside a 53.2% increase in average HRV (rising from 47 ms to 72 ms, reaching 74 ms in recent spot tracking).

Crucially, evaluating low RHR in isolation introduces significant diagnostic ambiguity in older populations. While a low RHR reflects high cardiorespiratory fitness in youth, non-physiologic bradycardia in older adults frequently stems from age-related cardiac conduction system degeneration. Combining low RHR with high HRV differentiates youthful cardiac vagal dominance from pathological conduction decay. In age-stratified normative data, HRV declines linearly with age, with expected mean values near 35 ms for middle-aged adults; achieving an HRV of 72 ms at an RHR of 42 bpm indicates preserved or restored autonomic flexibility and vagal tone.

Linear regression modeling of daily longitudinal data demonstrated that three primary physiological inputs—body weight (reduced from 160 lbs to 140 lbs), Average Daily Heart Rate (ADHR, serving as an integrated metric of total daily physical strain), and total caloric intake—account for 72% of daily RHR variation (R^2 = 0.72, p < 0.001). However, these same core variables accounted for only 32% of daily HRV variance (R^2 = 0.32, p < 0.001), proving that HRV is governed by a far more complex array of non-caloric physiological, psychological, and environmental determinants.

To address this predictive shortfall, a stepwise linear regression model incorporating ten specific dietary factors (including Vitamin B6, N-acetylcysteine, beta-cryptoxanthin, collard greens, pickles, almonds, flaxseed, lemon peel, oats, and green peas) increased the explained variance for HRV from 32% to 39% (R^2 = 0.39) and for RHR from 72% to 74% (R^2 = 0.74). While single-subject (n=1) observational regressions cannot prove causal mechanisms due to residual confounding and collinearity, these empirical models underscore the clinical potential of personalized biometric modeling for optimizing cardiovascular longevity.

II. Insight Bullets

  1. Autonomic Biomarker Integration: Resting Heart Rate (RHR) and Heart Rate Variability (HRV) serve as localized cardiac surrogates for overall autonomic nervous system (ANS) tone and adrenal gland activity.
  2. Sympathovagal Balance Dynamics: Parasympathetic (vagal) activation slows sinus node firing and increases beat-to-beat variability, whereas sympathetic activation triggers adrenal catecholamine release (epinephrine/norepinephrine), elevating RHR and suppressing HRV.
  3. The RHR Longevity Paradox: RHR follows a U-shaped trajectory across the lifespan, rising until approximately age 50 before declining in late life. Consequently, a low RHR in an older adult can signify either athletic conditioning or age-related sinus node dysfunction.
  4. HRV as the Diagnostic Differentiator: HRV declines linearly with chronological age. Combining low RHR with high HRV confirms youthful cardiac vagal modulation rather than age-related degenerative bradycardia.
  5. Eight-Year Longitudinal Trajectory: Continuous daily tracking over ~2,900 days (2018–2026) demonstrated a sustained reduction in baseline RHR from 51 bpm in 2018 to an average of 41.6 bpm in 2026.
  6. HRV Optimization Magnitude: Over the same 8-year span, annual average HRV increased by 53%, advancing from 47 ms (2018 baseline) to a peak 6-month average of 72 ms in 2026, far exceeding the age-matched norm of ~35 ms.
  7. Biometric Concordance: RHR and HRV must be tracked concurrently; evaluating either metric in isolation provides an incomplete assessment of cardiovascular stress resilience and autonomic balance.
  8. Primary RHR Regression Model: A three-variable linear regression model consisting of body weight, Average Daily Heart Rate (ADHR), and daily caloric intake explains 72% of daily RHR variation (R^2 = 0.72, p < 0.05).
  9. Primary HRV Regression Model: The same three core variables (body weight, ADHR, calorie intake) account for only 32% of daily HRV variation (R^2 = 0.32, p < 0.05), proving HRV is vastly more sensitive to non-caloric and subtle environmental inputs.
  10. Average Daily Heart Rate as Activity Surrogate: ADHR captures total daily physical strain (e.g., walking on inclines vs. flat ground) far more accurately than step counts alone.
  11. Impact of Weight Loss on Autonomic Function: Reducing body weight from 160 lbs to 140 lbs and maintaining this mass served as a structural driver for decreasing baseline RHR and elevating HRV.
  12. Caloric Surges and Sympathetic Tone: Overeating acutely surges sympathetic activity; an isolated 9,000-calorie overeating event caused a pronounced temporary spike in RHR and drop in HRV.
  13. Relocation and Environmental Stress: Geographic relocation (Boston to Austin in 2025) transiently elevated average RHR (to 43 bpm) and reduced HRV (to 61 ms), illustrating the measurable autonomic impact of environmental transition.
  14. Dietary Regression Enhancement for RHR: Stepwise addition of ten specific dietary items increased the predictive capacity (R^2) for RHR from 72% to 74% (+2%).
  15. Dietary Regression Enhancement for HRV: Incorporating the same ten dietary variables into the HRV model increased explained variance from 32% to 39% (+7%).
  16. Dual-Concordant Dietary Factors: Ten specific dietary inputs demonstrated inverse associations with RHR (negative beta coefficients) and direct associations with HRV (positive beta coefficients): Vitamin B6, NAC, beta-cryptoxanthin, collard greens, pickles, almonds, flaxseed, lemon peel, oats, and green peas.
  17. Nutritional Determinant – Vitamin B6: B6 intake correlated with reduced RHR and elevated HRV, likely reflecting its role as an essential enzymatic cofactor in neurotransmitter synthesis (GABA, serotonin).
  18. Nutritional Determinant – N-Acetylcysteine (NAC): NAC intake was positively associated with HRV enhancement, potentially driven by glutathione synthesis, reduction of systemic oxidative stress, and modulation of sympathetic outflow.
  19. Nutritional Determinant – Beta-Cryptoxanthin: As a potent carotenoid antioxidant, higher beta-cryptoxanthin intake correlated with favorable shifts in both autonomic markers.
  20. Nutritional Determinant – Collard Greens & Nitrates: Leafy greens rich in dietary inorganic nitrates boost endothelial nitric oxide (NO) bioavailability, promoting vasodilation, reducing cardiac workload, and enhancing vagal tone.
  21. Nutritional Determinant – Almonds & Monounsaturated Fats: Whole almond intake supported parasympathetic tone, consistent with trial data showing nut consumption protects HRV during acute mental stress.
  22. Nutritional Determinant – Flaxseed & Alpha-Linolenic Acid (ALA): Flaxseed provides plant-based omega-3 fatty acids and lignans that modulate cardiac ion channels and attenuate sympathetic overactivity.
  23. Nutritional Determinant – Citrus & Lemon Peel: Bioflavonoids (e.g., hesperidin, eriocitrin) present in citrus peels exert vasodilatory and autonomic-modulating effects.
  24. Nutritional Determinant – Oats & Beta-Glucans: Soluble beta-glucan fibers improve glycemic stability and metabolic homeostasis, damping postprandial sympathetic spikes.
  25. Nutritional Determinant – Green Peas & Legumes: Plant protein and fiber sources support gut microbiome short-chain fatty acid production, which influences central autonomic control via the gut-brain axis.
  26. Nutritional Determinant – Fermented Foods (Pickles): Fermented sodium-rich foods like pickles showed positive statistical alignment in this specific model, likely modulated by fluid volume expansion in a lean, active individual.
  27. Prescription Biohacking Framework: The ultimate goal of longitudinal multi-variable tracking is to build high-precision predictive models (R^2 approaching 1.0) enabling personalized exercise and nutritional prescriptions.
  28. Transient vs. Sustained Biometric Peaks: Short-term metrics (e.g., July spot averages of 80–86 ms HRV and 38–39 bpm RHR) represent peak physiological states, requiring monthly aggregation (e.g., 74 ms / 40 bpm) to prevent selection bias.

IV. Actionable Protocol (Prioritized)

High Confidence Tier (Backed by Level A/B Evidence)

  1. Caloric Restriction and Weight Management:
  • Protocol: Achieve and maintain a lean body mass (BMI ~19.5–21.0 kg/m² or a targeted 12–15% body mass reduction if overweight).
  • Evidence: Meta-analyses confirm caloric restriction and weight loss significantly reduce resting heart rate, lower systemic vascular resistance, and elevate high-frequency HRV by attenuating baseline sympathetic tone and improving cardiac vagal control (World et al., 2018; Sjoberg et al., 2021).
  1. Whole Nut Consumption (Almonds):
  • Protocol: Consume 30–50 g/day of whole almonds as a primary snack replacement.
  • Evidence: Randomized controlled trial (RCT) data demonstrates that 6 weeks of daily whole almond snacking significantly preserves high-frequency HRV power (parasympathetic regulation) during acute mental stress and improves endothelial function (Dikariyanto et al., 2020).
  1. Inorganic Nitrate / Leafy Green Vegetable Intake (Collard Greens):
  • Protocol: Daily intake of 100–200 g of nitrate-rich leafy greens (collard greens, spinach, arugula).
  • Evidence: Meta-analyses establish that dietary inorganic nitrates enhance endothelial nitric oxide bioavailability, reduce arterial stiffness, lower central blood pressure, and improve autonomic recovery (Benjamim et al., 2022).
  1. Cardiorespiratory Conditioning & Load Balancing:
  • Protocol: Monitor Average Daily Heart Rate (ADHR) as an integrated strain metric, balancing aerobic zone-2 cardio with structured recovery days.
  • Evidence: Extensive prospective cohort meta-analyses prove that a lower baseline resting heart rate (<50 bpm) achieved via aerobic fitness is independently associated with a significant reduction in all-cause and cardiovascular mortality (Zhang et al., 2016).

Experimental Tier (Level C/D Evidence with High Safety Margins)

  1. N-Acetylcysteine (NAC) Supplementation:
  • Protocol: 600–1,200 mg/day oral NAC.
  • Evidence: Mechanistic and preliminary clinical literature highlights NAC’s role as a glutathione precursor that mitigates cardiometabolic oxidative stress and modulates sympathetic signaling; direct RCT evidence establishing daily NAC as an HRV-enhancing intervention in healthy populations remains limited (Batycka et al., 2025).
  1. Flaxseed & Plant Omega-3 (ALA) Inclusion:
  • Protocol: 15–30 g/day ground flaxseed.
  • Evidence: Evidence shows dietary ALA and lignans support vascular health, though marine omega-3s (EPA/DHA) possess stronger Level A evidence for directly increasing parasympathetic HRV than plant-derived ALA (Mason et al., 2025).
  1. Citrus Bioflavonoids & Peel (Lemon Peel/Citrus Zest):
  • Protocol: Dietary inclusion of whole citrus zest or bioflavonoid extracts (hesperidin, eriocitrin).
  • Evidence: Pilot studies demonstrate citrus bioflavonoids improve microvascular reactivity and transiently elevate parasympathetic HRV metrics (Matsumoto et al., 2014).
  1. Soluble Fiber & Legume Integration (Oats, Green Peas):
  • Protocol: Daily intake of beta-glucan rich oats (40–80 g) and green legumes.
  • Evidence: RCT evidence confirms blood glucose stabilization and gut microbiome short-chain fatty acid generation, which indirectly support autonomic balance by smoothing postprandial glycemic excursions.
  1. Fermented Foods & Electrolyte Balance (Pickles):
  • Protocol: Moderate inclusion of fermented pickles/brine in physically active individuals.
  • Evidence: Source unverified in live search for direct HRV enhancement RCTs in general populations. This n=1 correlation likely reflects acute plasma volume expansion and electrolyte rebalancing in a lean, low-sodium, highly active individual.

Red Flag Zone (Claims Debunked or Lacking Safety Data)

  1. High-Dose Vitamin B6 (Pyridoxine) Monotherapy:
  • Risk / Flaw: While Vitamin B6 intake correlated with improved HRV in the single-subject regression model, high-dose B6 supplementation (>50–100 mg/day) carries a documented, severe risk of sensory axonal polyneuropathy and dysautonomia (Bacharach et al., 2017).
  • Status: Red Flag Zone / Safety Data Absent for High-Dose Supplementation. Vitamin B6 should be obtained from dietary sources or low-dose multivitamins (<10–20 mg/day).
  1. Over-Reliance on Single-Subject (n=1) Stepwise Regressions:
  • Risk / Flaw: Attributing direct causality to specific foods (e.g., pickles or lemon peel) based on minor R^2 increments (+2% to +7%) in an n=1 study introduces severe risks of overfitting, spurious correlation, and unmeasured confounding (such as concurrent sleep quality, ambient temperature, or hydration).
  • Status: Translational Gap / Overfitting Risk. Empirical single-subject regressions require controlled crossover RCT confirmation before clinical adoption.
  1. Extreme Caloric Restriction in Low-BMI Individuals:
  • Risk / Flaw: Pushing body weight down to artificially suppress RHR risks hypothalamic-pituitary-adrenal (HPA) axis dysregulation, hormonal suppression (testosterone, thyroid hormone), loss of lean tissue mass, and impaired stress resilience.
  • Status: Red Flag Zone. Caloric restriction must be carefully balanced against endocrine and musculoskeletal safety.

Did Eating Too Many Sardines Increase Homocysteine?

. Executive Summary

In this n=1 observational cohort study encompassing 56 blood tests across 21 years (2005–2026), Dr. Mike Lustgarten evaluates age-related plasma homocysteine kinetics, its epidemiological association with all-cause mortality, and acute dietary drivers of hyperhomocysteinemia. Longitudinal tracking reveals a statistically significant age-dependent increase in plasma homocysteine (r=0.51, p=6.0×10⁻⁵). Cross-sectional literature demonstrates baseline values rising from ~7.0 µmol/L in healthy youth to ~12.0 µmol/L in octogenarians and ~23.0 µmol/L in centenarians (median age 100 years, n=1,800). Meta-analyses confirm that circulating homocysteine is monotonically associated with elevated all-cause mortality risk, establishing a strong biological rationale for targeting lower steady-state concentrations to promote healthspan and longevity.

Between April and June 2026, the investigator recorded an acute spike in plasma homocysteine from 8.3 µmol/L to 12.0 µmol/L—a +4.0 µmol/L shift representing his second highest measurement over 21 years. Given that background methyl-donor supplementation (comprising 1.0 g/day N-acetylcysteine, methylfolate, methylcobalamin, and 1.5 mg/day pyridoxine) remained constant, an extrinsic factor was implicated. Quantitative dietary tracking via Chronometer identified a concurrent acute increase in three high-arsenic whole foods: canned sardines (increased from 105 g/day to 183 g/day), pistachios (increased from 4 g/day to 38 g/day), and ground flaxseeds (increased from 0 g/day to 36 g/day).

The primary biological hypothesis connects heavy-metal clearance to transsulfuration pathway dynamics. Hepatic excretion of inorganic arsenic requires double-methylation by Arsenic (+3 oxidation state) methyltransferase (AS3MT), consuming stoichiometric equivalents of S-adenosylmethionine (SAM). Physiological SAM concentrations allosterically activate cystathionine β-synthase (CBS), the rate-limiting enzyme converting homocysteine and serine to cystathionine via vitamin B6. Elevated dietary inorganic arsenic intake (+31 µg/day total estimated net increase across the three foods) depletes hepatic SAM pools. This SAM depletion dampens CBS allosteric activation, impairing homocysteine transsulfuration and driving systemic accumulation. This xenobiotic stress compounds age-related declines in mitochondrial ATP synthesis, which inherently constrain de novo SAM generation via methionine adenosyltransferase (MAT). Longitudinal n=1 correlation analyses show statistically significant positive associations between plasma homocysteine and intake of sardines and pistachios, but not flaxseed. The resulting clinical intervention replaces sardines with wild-caught salmon to preserve long-chain omega-3 fatty acid intake while reducing heavy-metal exposure, alongside flaxseed elimination and pistachio minimization.

II. Insight Bullets

  1. Longitudinal Biomarker Dataset Depth: The investigator’s personal tracking dataset spans 21 years (2005–2026) and 56 discrete blood panels, providing a robust long-term baseline for plasma homocysteine kinetics.
  2. Statistically Significant Age Correlation: Serial blood testing demonstrates a clear, age-dependent increase in plasma homocysteine (r=0.51, p=6.0×10⁻⁵).
  3. Youth Baseline Norms: Healthy young men and women maintain average serum/plasma homocysteine concentrations of approximately 7.0 µmol/L.
  4. Octogenarian Biomarker Elevation: Average plasma homocysteine concentrations escalate to approximately 12.0 µmol/L in individuals aged 80 years and older.
  5. Centenarian Hyperhomocysteinemia: In an epidemiological cohort of ~1,800 individuals with a median age of 100 years, median serum homocysteine reached 23.0 µmol/L, demonstrating severe progressive age-related elevation.
  6. Monotonic All-Cause Mortality Association: Meta-analytic data show that all-cause mortality hazard ratios rise continuously with increasing circulating homocysteine levels (Peng et al., 2024).
  7. Absence of a Mortality Floor: Hazard ratio curves confirm no lower threshold where reduced homocysteine becomes detrimental, validating “as low as reasonably achievable” target strategies.
  8. Acute Test-Over-Test Shift: Plasma homocysteine increased from 8.3 µmol/L in April 2026 to 12.0 µmol/L in June 2026, marking an anomalous +4.0 µmol/L jump.
  9. Historical Biomarker Stability: Over 21 years, the investigator’s homocysteine levels remained tightly bound within the 9.0–11.0 µmol/L range, establishing the +4.0 µmol/L shift as a true biological signal rather than laboratory noise.
  10. Limited Efficacy of Standard B-Vitamin Trio: Co-supplementation with methylfolate, methylcobalamin (B12​), and low-dose B6​ (1.5 mg/day) yielded only a modest ~10% reduction in baseline homocysteine (from ~11.0 to ~10.0 µmol/L).
  11. N-Acetylcysteine Insufficiency: Daily intake of 1.0 g N-acetylcysteine (NAC) was insufficient to prevent the acute diet-induced spike in plasma homocysteine.
  12. High-Precision Diet Quantification: Over 99% of total food mass was weighed and logged continuously in Chronometer across an 11-year testing period (2015–2026).
  13. Sardine Exposure Delta: Daily canned sardine intake was elevated from 105 g/day to 183 g/day between April and June 2026 in an effort to raise the cell membrane Omega-3 Index.
  14. Pistachio Intake Shift: Daily pistachio consumption was increased from 4 g/day to 38 g/day over the same testing window.
  15. Flaxseed Protocol Introduction: Ground flaxseed intake was increased from 0 g/day to 36 g/day prior to the June blood panel.
  16. Whole-Food Heavy Metal Vectors: Canned sardines, pistachios, and flaxseeds were identified as prominent dietary sources of organic and inorganic arsenic species.
  17. Sardine Total Arsenic Load: Canned sardines contain approximately 68 µg to 221 µg total arsenic per 85 g serving, depending on commercial sourcing and processing.
  18. Inorganic Arsenic Fraction in Fish: Inorganic arsenic constitutes an estimated 10% of total sardine arsenic mass, delivering ~6.8 µg inorganic arsenic per 85 g serving.
  19. Pistachio Arsenic Contamination: Pistachio nuts contain between 67 µg and 189 µg total arsenic per kilogram, with pistachio oil fractions containing up to 64% inorganic arsenic species (Sadee et al., 2024).
  20. Flaxseed Arsenic Density: Flaxseeds contain approximately 750 µg total arsenic per kilogram (0.75 mg/kg), rivaling sardine concentrations on a dry mass basis.
  21. Estimated Inorganic Arsenic in Flaxseeds: Assuming an average 74% inorganic fraction across oilseeds, 36 g/day of flaxseed supplies ~20 µg/day of inorganic arsenic.
  22. Cumulative Net Exposure Delta: Combined dietary changes produced an estimated net increase of +31 µg/day in inorganic arsenic intake between testing intervals.
  23. Hepatic AS3MT Methylation Demand: Enzymatic detoxification of inorganic arsenic via Arsenic (+3 oxidation state) methyltransferase (AS3MT) requires sequential methyl transfers from S-adenosylmethionine (SAM) (Reichard et al., 2007).
  24. SAM Depletion Dynamics: Heavy xenobiotic methyl demand for arsenic detoxification drains hepatic SAM pools, lowering the intracellular SAM ratio.
  25. Allosteric Regulation of CBS: Cystathionine β-synthase (CBS) requires direct allosteric binding of SAM at its C-terminal regulatory domain for full enzymatic activation (Ereno-Orbea et al., 2013).
  26. Transsulfuration Impairment: SAM depletion inhibits CBS activity, blocking the irreversible transsulfuration of homocysteine into cystathionine and causing upstream plasma accumulation.
  27. Mitochondrial ATP Constraint on SAM: De novo SAM synthesis from methionine via methionine adenosyltransferase (MAT) requires cellular ATP; age-related mitochondrial decline limits SAM regeneration capacity (SAM Metabolism Review).
  28. Longitudinal Diet-Biomarker Correlations: Long-term paired diet-blood data (2015–2026) revealed statistically significant positive correlations between plasma homocysteine and intake of sardines and pistachios.
  29. Absence of Correlation with Flaxseed: Long-term n=1 data showed no significant statistical correlation between flaxseed intake and plasma homocysteine, despite high theoretical arsenic content.
  30. Dietary Substitution Strategy: Replacing sardines with wild-caught salmon lowers heavy-metal exposure while maintaining long-chain omega-3 fatty acid intake (EPA/DHA).

IV. Actionable Protocol (Prioritized)

High Confidence Tier (Level A/B Evidence)

  • Targeted B-Vitamin Co-Therapy (5-MTHF + Methylcobalamin + P5P): Level A meta-analyses (Clarke et al., 2007; Zhao et al., 2025) establish that combined supplementation with 5-methyltetrahydrofolate (0.8 mg/day), methylcobalamin (0.4–1.0 mg/day), and pyridoxal-5’-phosphate (B6) reliably lowers plasma homocysteine by 20–30% by stimulating remethylation via methionine synthase and transsulfuration via CBS.
  • Betaine / Trimethylglycine (TMG) Supplementation: Level A meta-analysis (McRae, 2013) demonstrates that 1.5 g to 6.0 g/day of betaine lowers circulating homocysteine by providing methyl groups for the betaine-homocysteine S-methyltransferase (BHMT) pathway, operating independently of folate and B12​.
  • Low-Toxin Marine Seafood Selection: Level A/B dietary toxicological guidelines (Sadee et al., 2024) recommend substituting high-arsenic or heavy-metal-dense marine matrices with wild-caught low-trophic fish (e.g., wild Alaskan salmon) to secure EPA and DHA without imposing heavy-metal methyl stress.

Experimental Tier (Level C/D Evidence with High Safety Margins)

  • Dietary Arsenic Mitigation (Seed and Nut Moderation): Preclinical and mechanistic human data (Reichard et al., 2007) confirm that heavy intake of inorganic arsenic depletes hepatic SAM pools during AS3MT clearance. Restricting high-arsenic seed loads (flaxseed >30 g/day) and tree nuts (pistachios >35 g/day) reduces xenobiotic methyl consumption and preserves SAM for CBS activation. Safety Margin: High (dietary modification).
  • Cofactor Support for BHMT and MS (Zinc & Choline): Mechanistic evidence (Ereno-Orbea et al., 2013) identifies zinc as an essential catalytic cofactor for BHMT and methionine synthase. Choline serves as a direct precursor for endogenously synthesized betaine. Safety Margin: High at standard daily nutritional doses (Zinc 15–30 mg/day; Choline 300–550 mg/day).
  • N-Acetylcysteine (NAC) Co-therapy: Level C human trials indicate that 1.0 g/day NAC provides cysteine downstream of CBS, reducing demand on the transsulfuration pathway and supporting intracellular glutathione synthesis without directly activating CBS. Safety Margin: High.

Electrical Stimulation Promotes Rejuvenation And Longevity

Yos Domen of Stanford University detail findings from their landmark study published in PNAS (Voskoboynik et al., 2026) regarding the rejuvenative effects of brief Pulsatile Electrical Current (PEC) on the colonial tunicate Botryllus schlosseri. Sharing approximately 75% protein sequence homology with humans, Botryllus serves as a unique chordate model of stem cell-mediated aging. Because the organism reabsorbs all somatic tissues weekly via apoptosis and regenerates new organ systems from adult progenitor pools, organismal senescence in Botryllus is fundamentally an expression of stem cell degradation. Aging in Botryllus manifests as reduced zooid volume, organ shrinkage, neural loss, circadian clock desynchronization, blunted heart rate variability, and diminished reproductive output.

To test bioelectric modulation, the researchers applied a single, acute session of PEC using a clinical cardiac pacing device delivering 150 pulses per minute (approximately 2.5 Hz) across three five-minute bursts separated by 15-minute rest intervals. This single 15-minute intervention induced systemic, multi-month reversal of age-related phenotypes. PEC-treated aged colonies demonstrated a dramatic restoration of zooid size, elongated vascular ampullae, accelerated blastogenic growth rates, and extended organismal survival (75% survival in treated colonies versus 17% in controls at one-year follow-up). Furthermore, PEC restored off-season gametogenesis and gonad production.

Whole-transcriptome profiling revealed a distinct biphasic “reboot and rebound” program. At two hours post-stimulation, global gene expression underwent widespread downregulation across signaling, epigenetic, and metabolic pathways. By 24 hours, this acute repression transitioned into sustained upregulation of transcription factors, epigenetic modulators, mitochondrial metabolic genes, and extracellular matrix regulators, with effects persisting beyond four months. Crucially, PEC triggered an immunometabolic shift from a transient pro-inflammatory state to a reparative M2-like macrophage signature, closely mirroring the transcriptomic response observed following physical exercise in mammals. While these preclinical findings highlight bioelectricity as a potent lever for resetting stem cell epigenetics, direct human application remains unproven. Systemic bioelectric rejuvenation lacks human safety and efficacy data, restricting clinical validation to localized modalities such as neuromuscular electrical stimulation.

II. Insight Bullets

  1. Stem Cell-Driven Model Organism: Botryllus schlosseri is a colonial tunicate and invertebrate chordate that undergoes weekly cycles of blastogenesis, where all adult tissues die via apoptosis and are regenerated de novofrom adult stem cells. Consequently, organismal aging in this species reflects pure adult stem cell senescence (Voskoboynik et al., 2026).
  2. High Protein Homology: Genomic sequencing demonstrates that approximately 75% of human proteins have significant sequence orthology in Botryllus schlosseri, making its molecular pathways relevant for studying fundamental chordate biology and stem cell regulation.
  3. Age-Associated Morphological Atrophy: As Botryllus colonies age (e.g., reaching 15–20 years in laboratory culture), the size of newly regenerated adult individuals (zooids) shrinks to one-third or less of the size produced by young 1-year-old colonies.
  4. Organ System Retraction: Specific internal structures, including the endostyle, heart, and digestive tract, show pronounced anatomical shrinkage in aged colonies compared to young controls.
  5. Neuronal Atrophy and Cell Loss: The central nervous system of Botryllus zooids reaches peak cell counts on day 4 of the weekly blastogenic cycle; young colonies exhibit ~1,000 neurons per zooid, whereas aged 15-year-old colonies drop to ~800 neurons.
  6. Neurodegenerative Gene Signature: Transcriptomic analysis of aged Botryllus brains reveals significant dysregulation of over 200 genes associated with human neurodegenerative disorders, including orthologs linked to early-onset Alzheimer’s disease (e.g., APP variants).
  7. Circadian Rhythm Decoupling: Expression of core circadian clock regulators (Clock and Cycle/Bmal1) exhibits tight diurnal oscillations in middle-aged colonies, whereas aged colonies lose rhythmic expression patterns, exhibiting uncoordinated circadian transcription around the clock.
  8. Loss of Cardiac Diurnal Dynamics: Young colonies display significant day-versus-night variations in heart rate (slowing down at night similar to mammals), whereas aged colonies lose this diurnal variability and maintain a sluggish, invariant cardiac rhythm.
  9. Serendipitous Bioelectric Discovery: The rejuvenative potential of electrical stimulation was discovered accidentally when researchers attempted to pace sluggish, unhealthy colonies using a temporary cardiac pacemaker to synchronize cardiac contractions.
  10. Pulsatile Electrical Current (PEC) Rig: The experimental protocol utilized a clinical Medtronic external cardiac pacemaker with submerged leads delivering a current at 150 pulses per minute (~2.5 Hz) in ambient seawater.
  11. Minimal Effective Dosing: The optimized treatment protocol requires only three 5-minute pulses of electrical stimulation separated by 15-minute rest intervals (totaling 15 minutes of active exposure), administered as a single acute session.
  12. Multi-Month Rejuvenation Persistence: A single 15-minute PEC treatment induced morphological and physiological improvements that persisted for over 200 days (~6.5 months), spanning dozens of weekly blastogenic replacement cycles.
  13. Zooid Size Recovery: PEC treatment in 20- to 24-year-old aged colonies restored the physical volume of regenerated zooids back to dimensions characteristic of young 1-year-old colonies.
  14. Vascular Ampullae Elongation: PEC stimulation caused peripheral blood vessel termini (ampullae) to lengthen and project outward, restoring youthful vascular network architecture.
  15. Enhanced Blastogenic Growth: Treated colonies produced a significantly higher number of buds per cycle, accelerating colony expansion rates relative to sham-treated controls.
  16. Reversal of Reproductive Senescence: In autumn months—when Botryllus colonies naturally enter reproductive diapause—PEC treatment restored active gametogenesis and gonad formation in 77% of colonies compared to 11% in controls (7/9 vs. 1/9).
  17. Dramatic Longevity Extension: At a 1-year post-treatment follow-up, 75% of PEC-stimulated colonies remained alive and growing, compared to only 17% of control colonies (9/12 vs. 2/12).
  18. Flow Cytometry Dynamics: Flow cytometric profiling based on forward/side scatter and enzymatic staining demonstrated stable long-term shifts in specific somatic and progenitor cell populations following PEC intervention.
  19. Biphasic Transcriptomic “Reboot” (2 Hours): Bulk RNA sequencing at 2 hours post-PEC revealed global, systemic downregulation of transcripts across signaling, metabolic, and epigenetic pathways, indicating an acute cellular reset or “shutdown.”
  20. Biphasic Transcriptomic “Rebound” (24 Hours): By 24 hours post-PEC, gene expression shifted to massive upregulation across transcription factors, epigenetic modulators, mitochondrial metabolic pathways, extracellular matrix (ECM) components, and immune regulators.
  21. Exercise-Mimetic Immunometabolic Signature: The transcriptomic profile following PEC closely mirrors the biphasic immune response observed after physical exercise in mammals, transitioning from an initial pro-inflammatory state to a sustained reparative, M2-like macrophage/immune state.
  22. Mechanistic Distinction from Clinical Pacing: Clinical cardiac pacemakers provide continuous local pacing to compensate for conduction blockages in diseased hearts, whereas PEC acts as a brief, global field stimulus that alters stem cell epigenetic programming.
  23. Bioelectric Goal-Directedness: The findings align with bioelectric developmental models (Levin, 2024), suggesting that exogenous electrical fields restore bioelectric cues that guide cellular coordination and tissue patterning lost during aging.
  24. Long-Term Re-Treatability: When rejuvenated colonies eventually begin to show age-related decline months later, re-application of the 15-minute PEC protocol successfully induces a secondary wave of morphological rejuvenation.
  25. Stem Cell Chimerism and Competition: Colonial tunicates can fuse blood vessels with histocompatible kin to form chimeras, triggering internal competition between stem cell lineages; PEC’s interaction with host stem cell fitness in chimeras remains an active area of study.
  26. Microbiome Interaction Hypotheses: Researchers are investigating whether PEC directly alters the colony microbiome or if rejuvenated host tissue secondary metabolites clean and reset the commensal bacterial population.
  27. Targeting Neural Progenitors: Ongoing investigations focus on isolating neural stem cells and evaluating whether PEC directly stimulates neurogenesis and reverses brain transcriptomic pathology in aged chordates.
  28. Translational Bottlenecks: Translating marine chordate field stimulation to mammals requires overcoming major physiological gaps, including tissue impedance, localized organ targeting, and risk of fatal cardiac arrhythmias.

IV. Actionable Protocol (Prioritized)

High Confidence Tier (Level A/B Human Clinical Evidence)

Protocols backed by rigorous human randomized controlled trials (RCTs) and systematic meta-analyses for electrical stimulation in clinical settings.

  • Neuromuscular Electrical Stimulation (NMES) for Atrophy Prevention:
    • Evidence Level: Level A Meta-Analysis (Huang et al., 2024).
    • Clinical Protocol: Application of low-frequency NMES to quadriceps and peripheral muscle groups in critically ill or immobilized patients significantly preserves muscle strength (Medical Research Council score MD = 3.62, p=0.0008) and reduces hospital length of stay.
  • Cutaneous Electrical Stimulation for Wound Healing:
    • Evidence Level: Level A Meta-Analysis (Gardner et al., 1999).
    • Clinical Protocol: Direct current or high-voltage pulsed current applied to chronic dermal ulcers accelerates healing velocity and tissue remodeling compared to standard care.
  • Exercise-Induced Immunometabolic Optimization:
    • Evidence Level: Level A Meta-Analysis.
    • Actionable Protocol: High-intensity interval training (HIIT) combined with progressive resistance training mimics the biphasic M1-to-M2 macrophage shift, mitochondrial biogenesis, and systemic transcriptomic rebound observed in bioelectric models without invasive bioelectric risks.

Experimental Tier (Level C/D Preclinical Evidence)

Protocols backed by mechanistic animal models, in vitro stem cell studies, or early-stage exploratory research with high safety margins.

  • Pulsatile Bioelectric Current (PEC) in Stem Cell Models:
    • Evidence Level: Level C Preclinical Marine Model (Voskoboynik et al., 2026).
    • Parameters: 2.5 Hz (150 bpm) pulsatile field, 3 x 5-minute bursts with 15-minute intermissions. Induces long-term epigenetic reboot, stem cell rejuvenation, and 4x survival extension in Botryllus schlosseri.
  • Morphoceutical and Ion Channel Modulation:
    • Evidence Level: Level D Narrative Review (Levin, 2024).
    • Concept: Utilizing pharmacological ion channel modulators or targeted microcurrents to alter membrane resting potential (Vmem​) to drive tissue regeneration and suppress senescent cell patterns.
  • Non-Invasive Transcutaneous Microcurrent Therapy:
    • Evidence Level: Level D Human Exploratory Studies.
    • Status: Sub-sensory microcurrent (<1 mA) applied topically for localized soft-tissue injury or facial skin conditioning. Human systemic longevity effects are unverified.

Mike Lustgarten received some attention in this recent media piece. Nice to see his 20+ year reduction in “biological age” getting highlighted, even if the measurement is problematic in many ways.

Top biohackers share what they did to get hyper-healthy

Jessica Orwig, Daniel T. Allen

Wen Zhuang power squating with heavy weights.

  • Adam Ficsor founded the Longevity World Cup, a competition that ranks biological age reduction.

  • Mike Lustgarten won last year’s competition, reducing his estimated PhenoAge by 22.1 years.

  • We spoke to Lustgarten and two other finalists about their habits, diet, and what keeps them healthy.

Most longevity enthusiasts are trying to slow aging, but Adam Ficsor wants to outrun it.

The software engineer and Bitcoin developer says humanity could eventually reach “longevity escape velocity,” where advances in medicine extend healthy life faster than people age.

“I am talking about literally not dying,” he told Business Insider for an episode of its video series “The Limit.

To that end, he founded the Longevity World Cup, a competition that ranks who can wind back their biological clock the most.

The inaugural event announced its first winners in January, awarding about $4,000 in Bitcoin-funded prize money.

The scores were based on PhenoAge, a tool that estimates your biological age using your actual age (aka chronological age) and common blood markers like cholesterol, blood sugar, inflammation, and kidney function. Basically, it’s a “blood test-based estimate of your risk of dying,” Daniel Belsky, an associate professor of epidemiology at Columbia University’s Robert N. Butler Columbia Aging Center, told Business Insider.

Participants have about one year to achieve and submit their best results.

First-place finisher Michael Lustgarten, PhD, lowered his estimated PhenoAge by 22.1 years. Subtracting that from his chronological age of 53 by the end of the competition yielded an estimated biological age of 30.9.

Researchers continue to debate how best to measure biological aging, and experts caution that scores like PhenoAge are statistical estimates rather than direct measurements of how fast someone is aging. Moreover, it’s worth noting that large swings in biological age scores over short periods, such as weeks or months, can be difficult to interpret, said Belsky, who was not involved in the competition.

“To adjudicate these biohacking competitions is an invitation for people to hack the algorithm and generate what are ultimately non-informative results from them,” he said.

That said, Belsky added that PhenoAge can be useful for tracking broad improvements from healthier behaviors.

“If you’re seeing changes in PhenoAge in response to improvements in healthy behaviors, better management of existing health conditions, or other lifestyle changes that improve the overall quality of your environment, then I would be more likely to trust what the algorithm is saying. That’s what it’s designed to do,” Belsky said.

With that in mind, Business Insider asked the top three winners of the Longevity World Cup to walk us through the habits and routines behind their results.

3rd-place finisher Wen Zhuang focuses on fundamentals

Wen Zhuang power squating with heavy weights.

Wen Zhuang allows room for some flexibility in his routine, especially for social occasions.Courtesy of Wen Zhuang

For the competition, Wen Zhuang lowered his estimated Phenoage by 20.1 years. He was 20.6 years old chronologically by the end of the competition, which means his biological age was only 0.5 years.

This doesn’t mean that Zhuang and others with extremely low bioages are “biologically infants,” Belsky said. “They’re just people who have unusual levels of some of the blood analytes that are being tested for in the algorithm.”

Rather than following someone else’s protocol, Zhuang said that many advanced longevity interventions often vary from person to person.

At first, Zhuang’s daily routine doesn’t seem especially extraordinary: He wakes up at 6:30 a.m. each day, completes a short grooming and red-light session, eats breakfast, and then strength trains or runs depending on the day. He competes in track and field as a short-sprint athlete.

He also sticks to a diet of 45% calories from fat, 27.5% from protein, and 27.5% from carbohydrates, prioritizing seafood, vegetables, and legumes with no added sugar. He favors diverse, spice-rich meals packed with polyphenols and cooked at lower temperatures to minimize potentially harmful compounds.

Toward the end of the day, he eats an early dinner and reduces light and stimulation before bed. While regular exercise and diets rich in vegetables and legumes are linked to better health, there is little evidence that some other parts of Zhuang’s routine, such as red-light therapy, extend human lifespan.

Unlike some longevity enthusiasts, Zhuang said he’s not highly strict with his routine.

“When there’s a social occasion, the schedule bends, and I think that’s fine.” He also allows for about 10% of his meals to be social, cooking his own meals the rest of the time. “I’d argue that’s not a compromise — social connection is one of the better-supported longevity variables there is.”

Where his routine gets interesting is when you look at the list of supplements he takes weekly. It’s over 75 different supplements, including Vitamins D, E, B2, B6, B12, zinc, iodine, manganese, folate, biotin, creatine, melatonin, as well as extracts including curcumin, broccoli seed, aged garlic, and ginger — to name a few.

“If someone reads this and takes one thing away, I’d want it to be the sleep, training, seafood, and metabolic markers — not the pill list,” he emphasized.

2nd-place finisher Zdenek Sipek relies on consistency

The top three winners of the Longevity World Cup

Zdenek Sipek also reversed his biological age by more than two decades.Business Insider

Runner-up Zdenek Sipek lowered his estimated PhenoAge by 20.6 years. He was 46.4 chronologically with a bioage of 25.8.

Sipek said maintaining his routine doesn’t require constant motivation because discipline has become part of his personality.

“I am very regimented and strict with myself, and I like it in fact that way,” he said.

When asked where he occasionally slips, Sipek said it might be “a piece of chocolate,” but he said little else interrupts his routine.

He also believes longevity doesn’t have to be expensive. Sipek estimated that someone starting out could spend less than $100 a month on longevity interventions, depending on where they live.

Outside of nutrition, Sipek studies Buddhism, Daoism, and Hindu texts. He said practices that promote peace of mind are an overlooked part of longevity because they can help reduce stress.

“I think the peace of mind is absolutely critical for wellbeing,” he said.

He also makes his longevity protocol available free on Substack because, he said, “this information should be shared freely and improve people in general all around the world.”

1st-place finisher Michael Lustgarten tracks everything he can

Michael Lustgarten working out.

Michael Lustgarten lowered his estimated PhenoAge by 22.1 years for the Longevity World Cup competition.Courtesy of Michael Lustgarten

Lustgarten, an active research scientist, said his biggest advantage in the competition is years of collecting data on himself.

He’s been measuring his blood biomarkers alongside his daily diet and routine since 2015, with more than 70 blood tests over the past decade, he told Business Insider.

He said he has up to 3,000 measurements of certain biomarkers, which gives him far more opportunities to see what changes affect his biological age, for better or worse. He provides his tracking methods on YouTube.

His diet, for example, is one of the first places he starts when targeting biomarkers across the board to try to lower his biological age.

He consumes about 40% fat and 30% carbs. He used to eat more carbs and less fat, but after tracking biomarkers for cardiovascular disease risk, he said that diet wasn’t optimal.

Beyond diet, he aims to optimize the basics, mainly exercise and sleep. Similar to Zhuang, Lustgarten said supplements aren’t the end-all be-all for maximizing health. In fact, he said he prioritizes making dietary changes over supplemental ones.

For beginners looking to monetize their health optimization, Lustgarten recommends starting with regular blood work instead of an expensive supplement routine.

A standard clinical chemistry and metabolic panel can only cost about $35 through some direct-to-consumer labs, though panels at hospitals can be more expensive. These panels are helpful in that they provide information about kidney, liver, immune, red blood cell-related measures, and metabolic health.

“What I recommend people do and what I do is before every blood test, tracking diet, exercise, duration, sleep, HRV, all the things you can think about tracking for at least a week for every test,” he said. Then, after a couple of tests, start looking within your own data to see what may be moving the needle, he added.

2 Likes

The Bortz Biological Age Clock: Better Than PhenoAge?

I. Executive Summary

In this presentation, Dr. Peter K. Joshi and Dr. Michael Lustgarten evaluate the Bortz Biological Age Clock, a machine learning-derived biological age estimation algorithm published in Communications Biology (Bortz et al., 2023). Derived from a massive cohort of 306,116 participants in the UK Biobank, the Bortz clock was developed to quantify physiological deterioration and predict all-cause mortality risk using routine, circulating clinical blood biomarkers. Utilizing an Elastic-Net penalized Cox proportional-hazards regression model across 60 candidate blood-based analytes, the algorithm stably selected a core panel of 25 circulating biomarkers. On independent holdout test validation datasets, the Bortz clock achieved a concordance index (C-index) for all-cause mortality prediction of 0.778 (95% CI [0.767–0.788]), outperforming Morgan Levine’s widely cited 9-biomarker PhenoAge algorithm, which yielded a C-index of 0.750 (95% CI [0.739–0.761]) (Levine et al., 2018). This represents an 11% relative increase in predictive accuracy over PhenoAge and up to 2.46 times the predictive lift compared to an age-and-sex null baseline model.

Despite its statistical superiority in epidemiological mortality forecasting, biological age clocks derived from penalized linear models possess distinct biological paradoxes and systemic algorithm weak spots. During the discussion, Dr. Lustgarten challenges specific biomarker weightings within the Bortz algorithm—focusing on Total Cholesterol, Sex Hormone-Binding Globulin (SHBG), Mean Corpuscular Hemoglobin (MCH), and Alanine Aminotransferase (ALT). Penalized linear models assume monotonic associations between biomarkers and mortality, failing to account for non-linear, U-shaped, or J-shaped risk curves common in gerontological biology. For instance, very low total cholesterol or abnormally low ALT often signals underlying frailty, subclinical disease, or sarcopenia rather than youthful vitality. Consequently, while the Bortz clock offers a highly scalable, cost-effective tool for population-level healthspan tracking, individual users must interpret biomarker coefficients critically: artificially manipulating specific blood parameters to lower a composite clock score does not necessarily reflect true systemic tissue rejuvenation.

II. Insight Bullets

  1. Large-Scale Derivation Cohort: The Bortz biological age clock was trained on 306,116 middle-aged to older individuals (aged 37–73 years) from the UK Biobank, providing high statistical power for biomarker discovery (Bortz et al., 2023).
  2. Elastic-Net Cox Modeling: The algorithm implements an Elastic-Net penalized Cox proportional-hazards model, narrowing 60 candidate circulating biomarkers down to a core ensemble of 25 stably selected predictors.
  3. Outperforming PhenoAge: On holdout test datasets, the Bortz clock achieved a C-index of 0.778 compared to 0.750 for Levine’s PhenoAge, representing an 11% relative increase in predictive performance for all-cause mortality (Levine et al., 2018).
  4. Predictive Lift Advantage: Incorporating the 25-biomarker Bortz panel provided up to 2.46 times the predictive lift over baseline age-and-sex null models.
  5. Cystatin C Primacy: Cystatin C emerged as the single strongest blood biomarker predictor of biological age acceleration, capturing glomerular filtration and systemic microvascular health (Bortz et al., 2023).
  6. Wide Variance in Biological Age Acceleration: Calculated Biological Age Acceleration (BAA) values ranged between -20 years younger and +20 years older than chronological age across same-aged individuals.
  7. Cost and Throughput Superiority: Utilizing standard circulating blood chemistry markers provides major cost, speed, and clinical accessibility advantages over expensive multi-omic platforms (such as DNA methylation or proteomics).
  8. Imputation Resilience: The authors demonstrated that missing blood panel markers can be imputed using clinical covariance structures without significantly degrading mortality prediction accuracy.
  9. Stratified Morbidity Performance: The Bortz model maintained predictive accuracy when stratified across both healthy individuals and participants with pre-existing chronic conditions (Bortz et al., 2023).
  10. Monotonic Modeling Blind Spots: Penalized linear Cox regression assumes linear risk associations, making the algorithm blind to U-shaped or J-shaped risk curves typical of biological aging parameters.
  11. The Total Cholesterol Paradox: In older adults, total cholesterol exhibits a U-shaped mortality curve where extremely low total cholesterol correlates with frailty, subclinical disease, and heightened mortality risk.
  12. Sex Hormone-Binding Globulin (SHBG) Complexity: While SHBG rises with age, elevated SHBG can simultaneously reflect favorable metabolic insulin sensitivity and unfavorable depletion of bioavailable free sex steroids or frailty.
  13. Red Blood Cell Indices (MCH and MCV): Mean Corpuscular Hemoglobin (MCH) and Mean Corpuscular Volume (MCV) reflect erythrocyte maturation; elevations point toward B12/folate deficiency or alcohol exposure, while reductions signal microcytic iron deficiency.
  14. Alanine Aminotransferase (ALT) Sarcopenia Masking: Extremely low serum ALT levels in elderly individuals frequently reflect diminished muscle mass (sarcopenia) or reduced hepatic volume rather than optimal liver health.
  15. Systemic Inflammaging Panel: The Bortz clock integrates high-sensitivity C-Reactive Protein (hsCRP), neutrophil count, monocyte count, and lymphocyte percentage to quantify chronic low-grade systemic inflammation.
  16. Metabolic and Glycemic Profiling: Glycated hemoglobin (HbA1c), fasting glucose, alkaline phosphatase (ALP), and gamma-glutamyl transferase (GGT) track glycemic dysregulation, bone turnover, and hepatobiliary stress.
  17. Renal Clearance Panel: Combining Cystatin C, Creatinine, and Urea establishes multi-parametric monitoring of glomerular filtration and nitrogenous waste excretion.
  18. Nutritional Acute-Phase Biomarkers: Serum Albumin and 25-hydroxyvitamin D serve as negative acute-phase reactants and nutritional markers; low levels strongly correlate with frailty and mortality.
  19. Apolipoprotein A1 Integration: Measuring ApoA1 captures high-density lipoprotein (HDL) particle functionality and reverse cholesterol transport efficiency better than standard total HDL-C alone.
  20. Commercial Direct-to-Consumer Translation: The Bortz clock was translated into commercial practice via the consumer health platform Humanity Inc., enabling direct-to-consumer healthspan tracking.
  21. Clock Gaming vs. True Biological Reversal: Artificially manipulating single blood markers via targeted supplementation can lower a composite algorithm score without reversing underlying tissue decay.
  22. Requirement for Interventional Trials: Prospective interventional trials are required to confirm whether reversing biological age clock scores leads to tangible reductions in disease incidence or lifespan extension.

IV. Actionable Protocol (Prioritized)

High Confidence Tier (Level A/B Evidence)

Protocols backed by large-scale biobank cohorts, machine learning risk modeling, and established clinical trial data.

  • Standardized Comprehensive Blood Biomarker Panel:
    • Evidence Level: Level A Meta-Analysis / Biobank Cohort Studies (Bortz et al., 2023; Levine et al., 2018).
    • Protocol: Obtain routine complete blood count (CBC), comprehensive metabolic panel (CMP), lipid panel, Cystatin C, hsCRP, HbA1c, and 25(OH)D to baseline systemic physiological risk parameters.
  • Renal and Microvascular Function Optimization:
    • Evidence Level: Level A Meta-Analysis (Bortz et al., 2023).
    • Protocol: Maintain optimal Cystatin C (<0.9 mg/L) and eGFR by maintaining blood pressure <120/80 mmHg, avoiding chronic NSAID overuse, maintaining daily hydration, and limiting high-refined-salt intake.
  • Glycemic Control and Inflammaging Suppression:
    • Evidence Level: Level A Meta-Analysis (Levine et al., 2018).
    • Protocol: Maintain HbA1c <5.4% and hsCRP <1.0 mg/L via a diet focused on whole foods, regular physical activity, 7–9 hours of sleep, and elimination of refined carbohydrates.

Experimental Tier (Level C/D Evidence)

Protocols backed by prospective epidemiological modeling, clinical preprints, or expert opinion.

  • Algorithmic Biological Age Trajectory Tracking:
    • Evidence Level: Level C Prospective Epidemiological Modeling (Bortz et al., 2023).
    • Protocol: Track biological age using validated algorithms (Bortz Blood Age, PhenoAge) 1 to 2 times per year to monitor directional biological aging trajectories rather than fixating on single isolated scores.
  • Hepatic and Sarcopenia Autoregulation:
    • Evidence Level: Level C Observational Evidence.
    • Protocol: Monitor liver enzymes (ALT, GGT) and red blood cell metrics (MCV, MCH); evaluate low ALT (<15 U/L) in older adults as a potential indicator of sarcopenia requiring increased dietary protein intake and progressive resistance training.

Red Flag Zone (Safety Data Absent / High Risk)

Unverified, hazardous, or algorithmically flawed health practices.

  • “Gaming” Biological Age Clock Biomarkers via Target Suppressants:
    • Status: Debunked / Methodological Fallacy.
    • Risk Assessment: Taking unvetted supplements strictly to manipulate a single biomarker coefficient (e.g., driving total cholesterol or ALT below normal physiological ranges) risks inducing frailty, sarcopenia, or endocrine disruption.
  • Treating Composite Biological Age Scores as Absolute Clinical Diagnoses:
    • Status: Unvalidated Subgroup Application.
    • Risk Assessment: Relying on a single composite biological age number as an absolute diagnostic tool without analyzing specific organ system markers risks missing acute medical pathologies or overestimating healthspan.

Produced by Gemini 2.0 Flash
1 Like

Tracking And Trying To Optimize Oxidative Stress Biomarkers

I. Executive Summary

Dr. Mike Lustgarten evaluates the plasma methionine sulfoxide-to-methionine ratio (MetO/Met) as a dynamic clinical biomarker of systemic oxidative stress and biological aging. The biological premise rests on the susceptibility of the sulfur thioether moiety in methionine to oxidation by reactive oxygen species (ROS)—specifically hydrogen peroxide (H2​O2​)—yielding methionine sulfoxide diastereomers (Met-S-SO and Met-R-SO). Because cellular repair relies on the thioredoxin-dependent methionine sulfoxide reductase enzyme family (MsrA and MsrB), an elevated circulating MetO/Met ratio reflects a shift in net redox homeostasis. Epidemiological cross-sectional metabolomic profiling across human cohorts (ages 45–110) demonstrates an age-associated accumulation of this ratio (p<0.05, FDR<0.05).

To evaluate intra-individual modifiability, Lustgarten compiles longitudinal data across 26 discrete blood draws utilizing capillary blood self-collection coupled with liquid chromatography–mass spectrometry (LC-MS) metabolomics. Analytical deconstruction reveals meaningful biological signals alongside severe statistical and methodological vulnerabilities. First, the speaker demonstrates an initial correlation between MetO/Met and the phenotypic biological age estimator PhenoAge at n=10 (r=0.79,p=0.006), which subsequently collapsed into statistical insignificance at n=21(r=0.18,p=0.43), exemplifying the high rate of false-positive Type I errors inherent to low-powered N=1 time-series analyses. Second, an observed correlation between MetO/Met and combined innate immune cell counts (neutrophils + monocytes, r=0.54,p<0.05) aligns with the pathophysiological role of myeloperoxidase- and NADPH oxidase (NOX2)-derived ROS generation during immunosenescence.

However, the nutritional attribution framework exhibits critical translational gaps. While bivariate modeling suggested an inverse association between strawberry intake and MetO/Met (r=−0.48,p<0.05), multivariable calorie adjustment rendered this effect non-significant (p=0.14), isolating total caloric restriction as the dominant predictive variable. Furthermore, identifying isolated dietary components (e.g., watermelon and total fructose) via uncorrected ordinary least squares regression across hundreds of collinear dietary variables without False Discovery Rate (FDR) or Family-Wise Error Rate (FWER) control creates extreme vulnerability to data over-fitting. While tracking methionine redox kinetics offers legitimate geroscience utility, optimizing dietary regimens based on unadjusted single-subject observational correlations lacks randomized controlled trial validation.

II. Insight Bullets

  1. Methionine is an essential sulfur-containing amino acid with an electron-rich, oxidatively labile thioether group vulnerable to nucleophilic attack by ROS.
  2. Reaction of methionine with hydrogen peroxide (H2​O2​) or hydroxyl radicals (∙OH) oxidizes the sulfur atom to form a racemic mixture of methionine-S-sulfoxide and methionine-R-sulfoxide.
  3. The ratio of circulating plasma methionine sulfoxide to unoxidized methionine (MetO/Met) serves as a direct proxy for systemic oxidative macromolecular stress.
  4. Enzymatic reduction of protein-bound and free MetO back to native methionine is catalyzed by stereospecific methionine sulfoxide reductases: MsrA (S-form) and MsrB / fRMsr (R-form).
  5. Cross-sectional metabolomic data across human populations (ages 45–110) confirm that the plasma MetO/Met ratio increases monotonically as a function of chronological age (p<0.05,FDR<0.05).
  6. Age-associated upregulation of the MetO/Met ratio is mechanistically driven by both increased mitochondrial ROS leakage and progressive transcriptional/translational decline in endogenous MsrA/B activity.
  7. Longitudinal N=1 biomarker tracking across 26 timepoints demonstrated baseline MetO/Met averages of 0.061 (2023) and 0.068 (2024), subsequently declining to 0.048 (2025) and 0.045 (2026).
  8. Capillary blood self-collection devices utilizing micro-needle suction (e.g., Tasso) coupled with high-resolution LC-MS enable untargeted/semi-targeted plasma metabolomic surveillance.
  9. Pre-analytical variability—including ambient room-temperature exposure, clotting time, and ex vivo air exposure—can induce artificial ex vivo methionine auto-oxidation.
  10. The sum of circulating innate immune cells (neutrophils + monocytes) correlates positively with the plasma MetO/Met ratio (r=0.54,p<0.05,n=21).
  11. Activated neutrophils and monocytes generate high flux rates of superoxide (O2∙−​) via NADPH oxidase (NOX2) and hypochlorous acid (HOCl) via myeloperoxidase (MPO).
  12. Myeloperoxidase-derived oxidants selectively react with extracellular methionine residues in circulating plasma proteins (e.g., serum albumin Met-111 and Met-147).
  13. Bivariate correlation between MetO/Met and PhenoAge exhibited an initial spurious correlation (r=0.79,p=0.006at n=10) that degraded completely at n=21 (r=0.18,p=0.43).
  14. This statistical collapse provides empirical proof that low-sample-size observational N=1 time-series are dominated by random stochastic noise and regression to the mean.
  15. Failure to apply multiplicity corrections (e.g., Benjamini-Hochberg False Discovery Rate or Bonferroni adjustments) across 600+ monitored metabolites dramatically inflates experiment-wise Type I error rates.
  16. Discarding FDR control under the premise of avoiding false negatives guarantees the retention of spurious dietary correlations.
  17. Aligning rolling 30-to-50-day weighted dietary averages with discrete blood testing timepoints assumes steady-state tissue metabolite kinetics, ignoring acute postprandial swings.
  18. High daily intake of strawberries (up to 600–1,200 g/day) demonstrated an initial unadjusted inverse correlation with MetO/Met (r=−0.48,p<0.05).
  19. Multivariable regression adjusting for total daily caloric intake completely eliminated the statistical significance of strawberry intake on MetO/Met (p=0.14).
  20. Total daily caloric intake was identified as the underlying confounding variable driving the apparent strawberry-redox association.
  21. Caloric restriction down-regulates mitochondrial electron transport chain proton leak, decreasing baseline mitochondrial H2​O2​ generation and lowering substrate oxidation.
  22. After multivariable calorie adjustment, daily watermelon intake and total dietary fructose intake retained nominal inverse associations with the MetO/Met ratio (p<0.05).
  23. Watermelon is rich in L-citrulline, a non-essential amino acid that bypasses hepatic first-pass metabolism to drive de novo endothelial L-arginine synthesis and nitric oxide (NO) bioavailability.
  24. Free dietary fructose is absorbed via facilitated diffusion via GLUT5 enterocyte transporters and rapidly cleared by hepatic fructokinase (KHK).
  25. High-flux hepatic fructose metabolism bypasses phosphofructokinase regulation, potentially depleting intracellular ATP and generating uric acid via AMP deaminase activation.
  26. Attributing systemic anti-oxidative efficacy directly to isolated dietary fructose represents a high risk of nutritional reverse causality and model over-fitting.
  27. Chronic high-dose fruit fructose consumption in individuals without high metabolic output can induce hepatic de novo lipogenesis and hypertriglyceridemia.
  28. Whole-food strawberry supplementation (32 g freeze-dried powder) has been shown in clinical RCTs to improve endogenous glutathione (GSH) and SOD activity in prediabetic cohorts.
  29. Polyphenolic compounds in berries (e.g., anthocyanins, pelargonidin, fisetin) act primarily through xenohormetic activation of the Keap1-Nrf2-ARE signaling pathway rather than direct radical scavenging.
  30. Nrf2 nuclear translocation transcriptionally upregulates GCLC, GCLM, NQO1, and thioredoxin reductase (TrxR), enhancing cellular Msr catalytic turnover.
  31. The speaker’s composite metric (“net correlative score”) summing unweighted bivariate biomarker correlations lacks epidemiological validity and predictive modeling calibration.
  32. Treating an unvalidated metabolomic ratio as a primary optimization endpoint risks “Goodhart’s Law,” wherein optimizing a surrogate metric compromises systemic physiological homeostasis.
  33. Lowering calorie intake combined with increasing whole-food fruit consumption alters multiple collinear metabolic vectors simultaneously (e.g., fasting insulin, lipid subfractions, glycemic variability).
  34. Methionine restriction per se (independent of total calories) has been robustly shown in rodent models to downregulate mTORC1, upregulate FGF21, and extend lifespan.
  35. Translating single-subject plasma amino acid redox dynamics into population-level longevity protocols requires prospective crossover validation against verified clinical outcomes.

III. Adversarial Claims & Evidence Table

Claim from Video / Regimen Context Speaker’s Evidence / Justification Scientific Reality (Current Clinical Data) Evidence Grade Verdict
Plasma MetO/Met ratio is a valid biomarker of systemic oxidative stress and aging. Cross-sectional metabolomic data (ages 45–110) showing an age-related increase (p<0.05,FDR<0.05). Confirmed. Methionine oxidation on circulating proteins (e.g., albumin Met-111/147) and free plasma amino acids increases in biological aging, renal failure, and vascular disease due to reduced MsrA/Bcapacity (Flores et al., 2025; Redox Biol, 2021). Level C Strong Support
MetO/Met ratio correlates with innate immune aging (neutrophils + monocytes). Longitudinal N=1tracking showing positive correlation (r=0.54,p<0.05,n=21). Pathophysiologically sound. Activated neutrophils/monocytes release H2​O2​ and MPO-derived HOCl, which rapidly oxidize circulating methionine; neutrophil-to-lymphocyte dynamics track biological aging (MDPI Cohort, 2025; PMC12811150). Level C Plausible
Elevated MetO/Met ratio reliably predicts advanced biological age (PhenoAge). Initial n=10 correlation (r=0.79,p=0.006) presented as evidence of biological aging acceleration. Refuted by the speaker’s own updated data at n=21 (r=0.18,p=0.43). The initial correlation was an artifact of small sample size (n=10) and autocorrelation noise in an underpowered N=1 dataset (Liu et al., 2018). Level C Unsupported (Spurious Noise)
Excluding False Discovery Rate (FDR) correction is optimal for discovery in N=1 data. Premise: FDR is overly conservative and excludes potentially meaningful dietary correlations. Methodologically flawed. Analyzing hundreds of collinear dietary variables against multi-omic outcomes without multiplicity control (Benjamini-Hochberg) inflates family-wise Type I error rates to near 100%, generating false discoveries (Ioannidis, 2005). Level A Unsupported (Methodological Error)
High strawberry consumption directly reduces systemic methionine oxidation. Bivariate correlation (r=−0.48,p<0.05) between daily grams and MetO/Met ratio. Disproven after multivariable adjustment (p=0.14). Caloric restriction was the true confounding mediator. However, strawberry polyphenols do hormetically upregulate endogenous antioxidant enzymes (SOD, GSH) via Nrf2 (Groven et al., 2025). Level B Unsupported (Confounded by Caloric Intake)
Increasing dietary watermelon and fructose causally lowers systemic oxidative stress. Calorie-adjusted multivariable linear regression showing negative beta coefficients (p<0.05). Unproven and biochemically paradoxical. While watermelon provides L-citrulline and lycopene, high isolated fructose flux promotes hepatic ATP depletion and uric acid-mediated oxidative stress in non-athletic cohorts (Jensen et al., 2018). Level C Speculative
Moderate caloric restriction lowers systemic oxidative burden. Calorie intake correlated positively with MetO/Metratio in longitudinal N=1tracking. Robustly validated in human RCTs. The CALERIE Phase 2 trial confirmed that 12–25% caloric restriction significantly downregulates systemic F2-isoprostanes, inflammatory cytokines, and resting metabolic rate (Ravussin et al., 2015). Level B Strong Support

IV. Actionable Protocol (Prioritized)

====================================================================

CLINICAL & METABOLIC REDOX OPTIMIZATION FRAMEWORK

=====================================================================

[HIGH CONFIDENCE TIER: Level A/B Validated Clinical Protocols]

├── 1. Moderate Caloric Optimization (Eucaloric / Mild Energy Deficit):
│ ├── Target: 10–15% caloric reduction relative to maintenance energy expenditure (if overweight/over-fat).
│ ├── Rationale: Mitigates electron transport chain electron leakage, reducing steady-state H2O2 production.
│ └── Biomarker Endpoints: Fasting insulin, hs-CRP, HOMA-IR, and systemic lipid peroxides.

├── 2. Whole-Food Dietary Polyphenol Integration:
│ ├── Foods: Berries (strawberries, blueberries, blackberries) at 150–300 g/day.
│ ├── Mechanism: Xenohormetic activation of Keap1-Nrf2-ARE transcription; upregulates endogenous GSH and SOD.
│ └── Precaution: Whole intact fruit preferred over extracts or isolated fructose syrups.

├── 3. Regular Complete Blood Count (CBC) Differential Monitoring:
│ ├── Metric: Monitor absolute neutrophil and monocyte counts for baseline subclinical inflammation.
│ └── Target: Maintain physiological homeostasis without unexplained persistent leukocytosis.

[EXPERIMENTAL TIER: Level C/D Evidence / Single-Subject Geroscience Tracking]

├── 1. Plasma Metabolomic Redox Surveillance (LC-MS):
│ ├── Marker: Plasma MetO/Met ratio and oxidized albumin fractions (Met-111/147).
│ ├── Protocol: Fasted, standardized pre-analytical blood handling to eliminate ex vivo artifactual oxidation.
│ └── Frequency: Quarterly or semi-annual testing to establish long-term moving averages.

├── 2. Endothelial Nitric Oxide Precursor Optimization:
│ ├── Source: L-citrulline-rich whole foods (watermelon) or dietary nitrates (leafy greens, beetroot).
│ └── Target: Enhance endothelial nitric oxide synthase (eNOS) coupling and microvascular perfusion.

[RED FLAG ZONE: Debunked, Unsafe, or Methodologically Vulnerable Practices]

├── 1. Uncorrected N=1 Multi-Hypothesis Testing:
│ ├── Practice: Running unadjusted regressions across 100+ dietary variables without FDR/Bonferroni corrections.
│ └── Risk: Chasing false-positive statistical noise (Type I errors), leading to erroneous dietary changes.

├── 2. High-Dose Isolated Fructose Consumption for Antioxidant Optimization:
│ ├── Practice: Intentionally elevating free fructose intake under the assumption that it lowers oxidative stress.
│ └── Risk: Hepatic de novo lipogenesis, hepatic steatosis, uric acid elevation, and metabolic dysfunction.

├── 3. Over-Optimization of a Single Intermediate Metabolite (Goodhart’s Law):
│ └── Risk: Distorting overall dietary macronutrient quality to manipulate an unvalidated plasma ratio.

========================================================================

V. Technical Mechanism Breakdown

1. Methionine Oxidation and the Stereospecific Msr Repair Network

  • Chemical Oxidation: Methionine possesses a hydrophobic thioether side chain (−CH2​−CH2​−S−CH3​). In the presence of physiological oxidants (H2​O2​, HOCl, peroxynitrite ONOO−), the unshared electron pair on the sulfur atom undergoes nucleophilic reaction, converting the uncharged thioether into a polar sulfoxide (−S(=O)−CH3​). This reaction introduces a chiral center at the sulfur atom, generating equimolar quantities of two diastereomers: L-methionine-S-sulfoxide (Met-S-SO) and L-methionine-R-sulfoxide (Met-R-SO).
  • Enzymatic Reduction Cascade: Cells possess specialized enzymes to reverse this post-translational modification:
    1. MsrA: A thioredoxin-dependent reductase stereospecifically targeted to Met-S-SO in both free amino acid pools and intact polypeptides. The catalytic cycle involves a nucleophilic attack by an active-site cysteine (Cys72 in human MsrA), forming a sulfenic acid intermediate, followed by condensation with a resolving cysteine to form an intramolecular disulfide bond, releasing native methionine.
    2. MsrB (MsrB1, MsrB2, MsrB3): Catalyzes the stereospecific reduction of protein-bound Met-R-SO. MsrB1is a selenoprotein containing a selenocysteine (Sec) residue in its catalytic triad, conferring high catalytic efficiency.
    3. Free Methionine-R-Sulfoxide Reductase (fRMsr): Specifically reduces the unbonded, free amino acid pool of Met-R-SO.
  • The Thioredoxin/NADPH Axis: Inactive, oxidized Msr enzymes containing intramolecular disulfide bonds are regenerated by reduced Thioredoxin (Trx). Oxidized Trx is subsequently reduced by Thioredoxin Reductase (TrxR) at the expense of cytosolic NADPH, directly coupling methionine repair to cellular pentose phosphate pathway flux.

2. Statistical Multiplicity and Methodological Pitfalls in Single-Subject (N=1) Time-Series

  • The Multiplicity Problem: Testing associations between hundreds of dietary/lifestyle variables and broad metabolomic panels without multiple-testing corrections drastically inflates the Family-Wise Error Rate (FWER). Under an alpha threshold of α=0.05, testing m=100 independent hypotheses yields a probability of at least one false positive of:

FWER=1−(1−0.05)100≈0.994(99.4%)

  • Confounding and Autocorrelation in N=1 Modeling: Longitudinal measurements taken from a single individual over time violate the assumption of independent and identically distributed (i.i.d.) observations due to serial autocorrelation. Confounding variables that track globally with dietary shifts—specifically total energy intake, macronutrient distribution, and seasonal exercise variations—inevitably generate strong but non-causal correlations with intermediate metabolic biomarkers.

Produced by Gemini 2.5 Pro