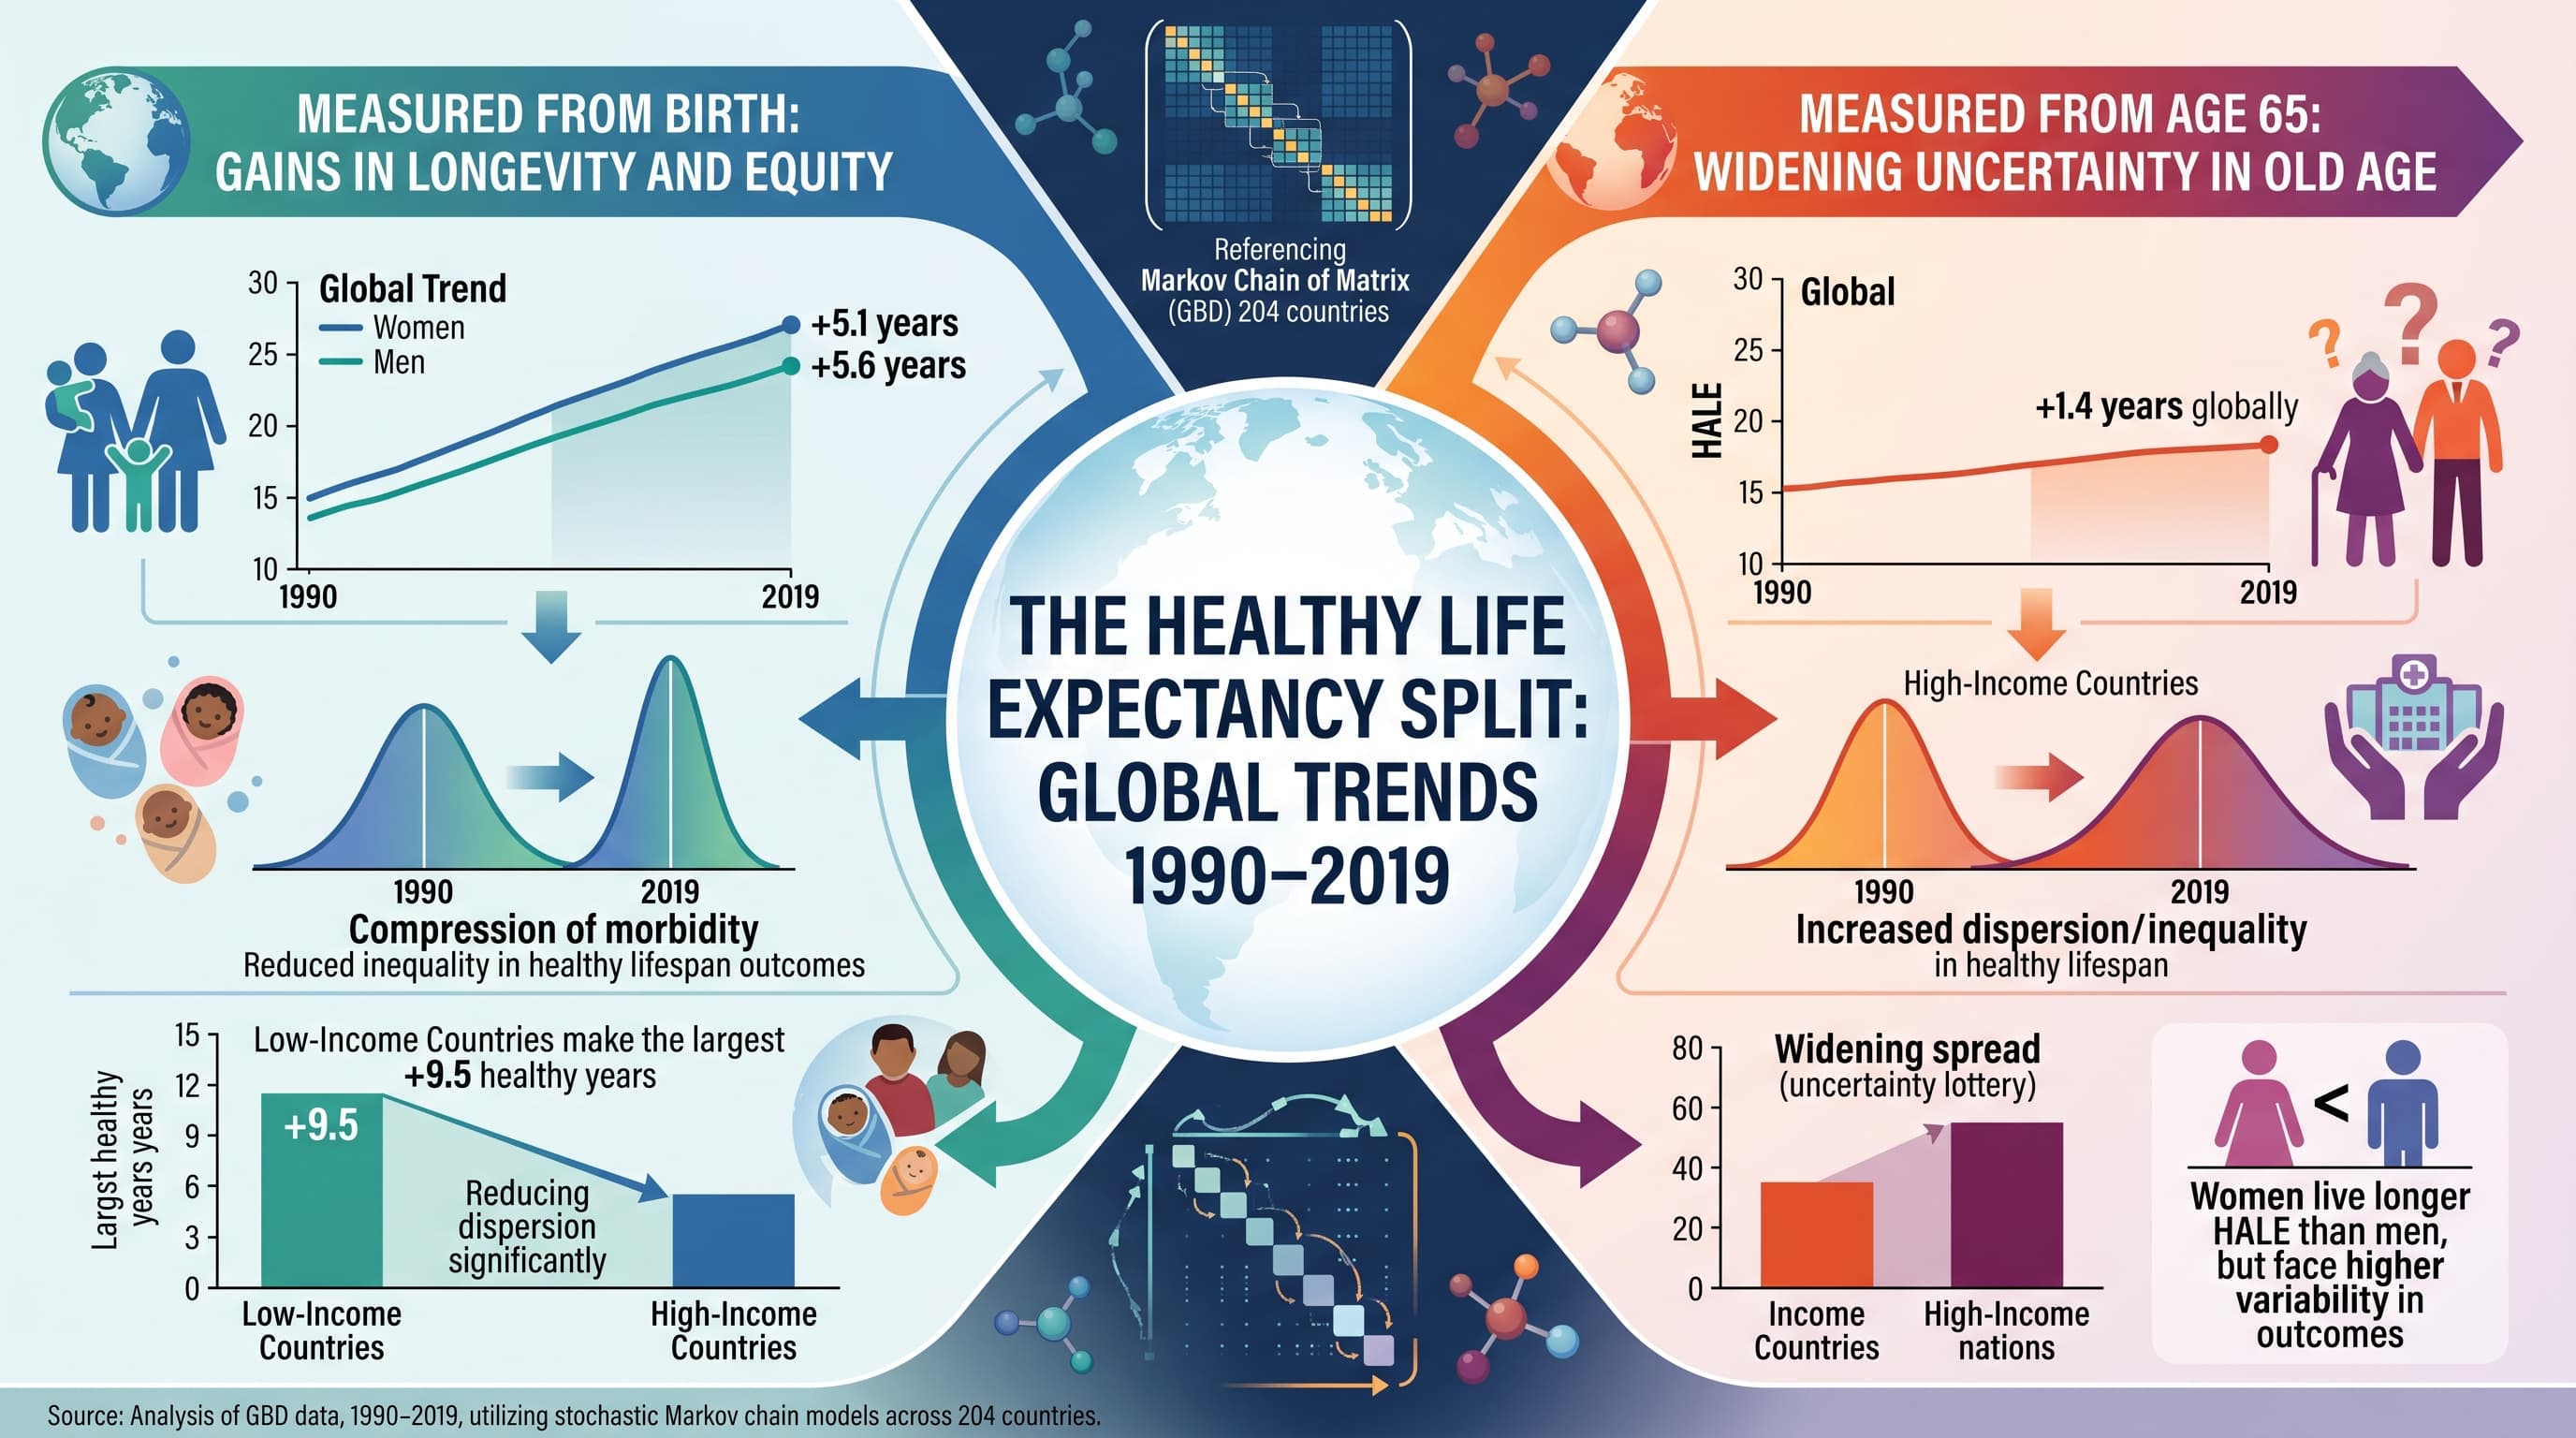
Two demographers applied a stochastic Markov chain model to Global Burden of Disease data covering 204 countries from 1990 to 2019, asking a question that average statistics cannot answer: as healthy life expectancy rises, is the good health being shared out more evenly, or is it pooling in fewer hands? Their answer is split by age. At birth, healthy lifespan got both longer and more predictable, and the gains were largest in the poorest countries, which closed roughly a third of their gap with rich ones. From age 50 onward the pattern reverses. Older people in high-income countries gained healthy years, but the spread of outcomes around that average widened, meaning old age is becoming a more uncertain lottery precisely where health systems are strongest.
For most of the last century, the story of human health has been told with a single number: life expectancy, or its more demanding cousin, healthy life expectancy. Both went up. Both are averages, and averages are silent about the thing people actually care about, which is whether their own outcome will land anywhere near the middle.
Virginia Zarulli at the University of Padova and Hal Caswell at the University of Amsterdam set out to put a number on that silence. Using a modelling technique borrowed from operations research, a Markov chain with rewards, they treated each year of good health as a payout collected by an individual walking a random path through life. Every year survived in full health earns a reward of one. Death, or the loss of good health, ends the walk. Run the model against real mortality and morbidity schedules and you recover not just the mean, which is exactly healthy life expectancy, but the variance around it. They call the square root of that variance SDHL, the standard deviation of healthy longevity.
Applied to Global Burden of Disease estimates for 204 countries between 1990 and 2019, the results split neatly along an age fault line. Measured from birth, healthy life expectancy rose about 5.1 years for women and 5.6 for men globally, and the spread of outcomes shrank by roughly 2.1 years for both. Low-income countries drove nearly all of it, gaining about 9.5 healthy years while cutting their dispersion by more than 3 years, five times the compression seen in rich countries.
Measured from age 65, the picture inverts. Healthy years rose only modestly, about 1.4 years for both sexes, and the spread widened. In high-income countries the widening was largest. Women, who consistently enjoy longer healthy lifespans than men, also carry consistently higher variability in them, an asymmetry that becomes more pronounced with age.
The blunt implication is that the compression of morbidity story, so often told as a uniform victory, is only true at the start of life. At the far end, longer healthy old age is arriving unevenly, and the model says a large share of that unevenness is simple chance rather than anything an individual controls.
Insights
The one genuinely useful number is a comparison. In 2019, a woman born in a high-income country could expect about 69.7 healthy years; a woman born in a low-income country, about 57.5. That is a gap of roughly 12.2 years. Expressed as a standardized effect size, dividing the gap by the typical spread of outcomes within those populations, this works out to a Cohen’s d of roughly 0.6, which counts as a medium to large effect. For scale, essentially no supplement, drug, or lifestyle intervention in the human longevity literature has a demonstrated effect anywhere near that size. Where you are born still dominates everything you can buy.
The second takeaway is about planning rather than physiology. Global healthy life expectancy at 65 is around 13 years for women and 11.4 for men, and the spread around those numbers is widening, not narrowing, in wealthy countries. Retirement, insurance, and care planning built on the average will be wrong for a growing fraction of people in both directions.
Context and Source
- Open Access Paper: Longer healthy life, but for how many? A stochastic analysis of healthy lifespan inequality
- Institutions: Department of Statistical Sciences, University of Padova, Italy; Institute for Biodiversity and Ecosystem Dynamics, University of Amsterdam, The Netherlands
- Journal: Annals of Operations Research (Springer), published online 12 August 2024
- Impact evaluation: The impact score of this journal is 4.1 (2025 Journal Impact Factor; 5-year JIF 4.9; Scopus CiteScore 13.4 for 2025), evaluated against a typical high-end range of 0 to 60+ for top general science, therefore this is a Medium impact journal.