My guess is that a rather small percentage of the ODs can be chalked up to experimentation, but mostly it’s because for a huge percentage of the population life sucks in the USA, and drug use is a escape from malaise and sorrow engendered in and by the difficulty of life in this society. I see it daily in the major US city I live in.
3 Likes
The same reason people still drink and drive. It won’t happen to me.
![]()
Because Purdue Pharma marketed their opioids as non addictive pain killers so a lot of people got it from their doctors for pain treatment and got hooked.
From BBC: Why opioids are such an American problem
3 Likes
Honestly, I am assuming a large proportion of the ODs could be due to fentanyl. It’s amazingly addictive, deadly and drug dealers usually lace normal drugs with it to increase sales. Fentanyl is horrible.
3 Likes
It seems to be a fairly “US centric” problem. Hong Kong, where DeStrider is from, and much of East Asian, seemingly doesn’t have many overdoses. I would guess that’s from a policy of extremely strict drug laws which are very strongly enforced at every level. Japan, Singapore, Taiwan, South Korea - all have extremely harsh penalties for drug offences and very tight border controls.
And culturally, I reckon the population is much less open minded to using drugs in the first place. There is strong stigmatism against drug users. The societies in general are less “me me me”. You don’t have rappers and celebrities etc on TV boasting and glamourising drug use. And I have to wonder whether population education levels have something to do with it, but that’s pure speculation.
I do agree, but I don’t think that’s US-specific. Millions of people across Asian countries are packed into tiny apartments, with crushing working hours, low salaries and almost no time off. Plus a shitload of cultural and societal pressures.
3 Likes
Yes, drug offences are very serious in Hong Kong. It may be even worse in places like Singapore.
Any person who has in his possession; or smokes, inhales, ingest or injects a dangerous drug, shall be liable upon conviction to a fine USD$ 125,000 and imprisonment for 7 years.
That’s enough to deter me, not that I’d ever want to touch the stuff. The prisons here are full of unwitting mules and drug traffickers.
In 2023, there were 105,007 drug overdose deaths in the United States, a nearly 3% decline from 2022.
In 2021, there were 36 drug overdose and poisonings in Hong Kong
Since the USA is 50X larger, adjuster per capita, that would be about 1,800 ODs in Hong Kong. However, that figure also includes all other poisonings including suicides (drinking floor cleaner is a popular suicide method and would be counted). Either way, it’s a big difference!
4 Likes
CDC: Life Expectancy Increased in Most States in 2022
Their latest report. However, as their 2019 visualization shows, life expectancy still hadn’t caught up to pre-pandemic levels:
https://www.cdc.gov/nchs/data-visualization/state-life-expectancy/index_2019.htm
3 Likes
Yes there is.
1 Like
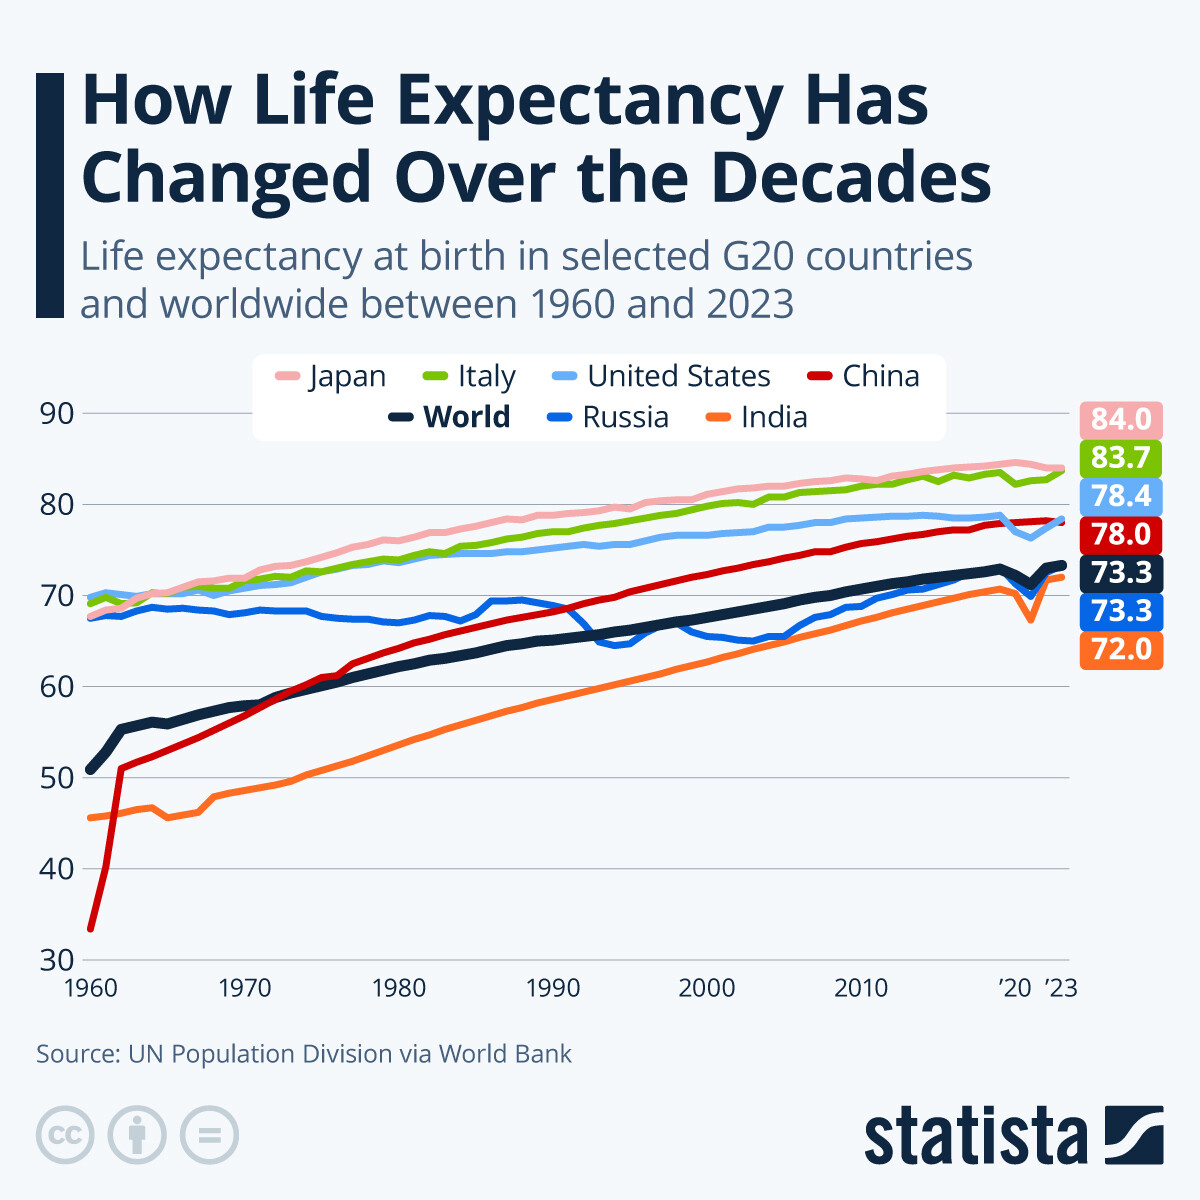
A really good overview of life expectancy trends around the world, and how to understand what is going on. I wonder what the impact of AI will be on these trends…:

I. Executive Summary
The “Death of Despair” Hypothesis is Dead; Enter “Deaths of Dislocation.”
Current life expectancy data reveals a K-shaped divergence masked by mean statistics. While the top 5% of US earners now outlive peers in Norway and the UK, the bottom 5% have suffered a catastrophic loss of approximately 15 years of life expectancy. This decline is not driven by metabolic disease (CVD, cancer) but by “external causes”: substance abuse and suicide. Crucially, the prevailing “Deaths of Despair” narrative (Case & Deaton) is statistically inferior to a “Deaths of Dislocation” model.
Recent longitudinal data (Glei et al., 2024) demonstrates that subjective feelings of despair (depression, distress) are weak predictors of mortality compared to objective structural factors: labor force detachment and social isolation. The mechanism of mortality is not purely psychological anguish but the kinetic availability of lethal means (e.g., fentanyl, pesticides) combined with the loss of “communal utility” (employment). Interventions focusing on individual therapy or financial compensation (UBI) without restoring social function are projected to fail. Effective protocols must be structural (means restriction) and communal (group-based labor), not clinical or pharmaceutical.
II. Insight Bullets
- The Mean is meaningless: Aggregate life expectancy stagnation hides a massive divergence; the top 5% are gaining years while the bottom 5% are collapsing.
- US Elite Health Paradox: The top 5% of Americans have superior longevity compared to the average citizen in “healthier” social democracies like Norway or Denmark.
- Mortality inversion: For adults under 55, “external causes” (suicide, overdose) have surpassed cardiovascular disease and cancer as the leading cause of death.
- Despair is a symptom, not the cause: “Despair” (self-reported misery) increases mortality risk by ~50%, whereas unemployment and isolation increase it by significantly higher margins.
- Dislocation > Depression: A depressed person with a job and community is statistically safer than a happy person with neither.
- Supply-side suicide: Suicide rates are often driven by the availability of lethal means (e.g., toxic pesticides in Sri Lanka) rather than fluctuations in population mental health.
- Cohort Scarring: Drug death data reveals “diagonal” cohort effects (specific generations damaged by economic shocks) rather than “vertical” period effects (general availability of drugs).
- The “Men’s Shed” Effect: Group-based, labor-oriented interventions show higher efficacy for isolated men than individual therapy or solitary exercise.
- Digital failure: Digital interventions (apps, chatbots) generally fail to mitigate isolation unless they facilitate synchronous, group-based interaction (e.g., social gaming).
- Anglophone fragility: Unemployment in English-speaking countries carries a higher “social death” penalty than in other cultures, leading to sharper mortality spikes.
- Manufacturing vs. Cyclical: Job losses in manufacturing (total industry erasure) cause deep cohort scarring; cyclical unemployment does not have the same lethal long-term tail.
- UBI Insufficiency: Financial restitution alone (UBI) cannot mitigate the mortality risk of unemployment because it fails to replace the “social container” of the workplace.
- Fentanyl Waves: The opioid crisis follows “epidemic wave” dynamics (East to West) largely independent of state-level policy interventions.
- Medicalization Limits: Safe supply/medicalization strategies work for containment (low prevalence) but fail during high-prevalence, widespread epidemics (fentanyl).
- Social Isolation Toxicity: Isolation operates as a distinct biological risk factor, functionally separate from and more lethal than subjective loneliness.
III. Adversarial Claims & Evidence Table
| Claim from Video | Speaker’s Evidence | Scientific Reality (Current Data) | Evidence Grade | Verdict |
|---|---|---|---|---|
| Unemployment/Isolation is a stronger predictor of death than “Despair” | Longitudinal analysis of “thousands of Americans” (2023/24). | Confirmed. Glei et al. (2024) found labor force detachment and low social integration were strongly associated with drug/suicide mortality, while distress measures were not. | Level B (Longitudinal Cohort) | Strong Support Source |
| Suicide rates are driven by “ease of means” (e.g., Pesticides) | Sri Lanka agricultural revolution and subsequent bans. | Confirmed. Pesticide bans in Sri Lanka reduced suicide rates by ~70% (1995-2005) without changes in mental health prevalence. | Level C (Ecological / Natural Experiment) | Strong Support Source |
| “Men’s Sheds” improve health outcomes for isolated men | Anecdotal success in Australia/Ireland; comparison to individual exercise. | Mixed/Plausible. Systematic reviews show high qualitative value (social connection) but “small” or “unclear” quantitative effects on physical biomarkers. | Level C (Observational/Qualitative) | Experimental / Plausible Source |
| Substance abuse/suicide kills more under-55s than CVD/Cancer | Aggregate mortality trends for bottom 5%. | Confirmed. CDC data (2021) shows “Unintentional Injuries” (inc. overdose) is the #1 cause of death for ages 1-44, surpassing cancer/heart disease. | Level A (Epidemiological Data) | Strong Support Source |
IV. Actionable Protocol (Prioritized)
High Confidence Tier (Level A/B Evidence)
-
Protocol 1: Means Restriction (Suicide Prevention).
-
Action: Physical removal of high-lethality agents (firearms, toxic chemical concentrates) from the immediate environment of at-risk individuals.
-
Rationale: Suicide is often impulsive; increasing the “kinetic friction” of the act significantly lowers completion rates (Sri Lanka data).
-
Protocol 2: Social Integration via Employment.
-
Action: Prioritize retention of employment or immediate placement in “communal labor” over passive financial assistance (disability/welfare) for capable individuals.
-
Rationale: Labor force detachment is a verified mortality multiplier independent of income (Glei et al., 2024).
Experimental Tier (Level C Evidence)
-
Protocol 3: “Men’s Sheds” / Task-Oriented Socialization.
-
Action: Engage isolated males in side-by-side cooperative tasks (woodwork, repair, team sports) rather than face-to-face therapy.
-
Rationale: Observational data suggests high adherence and reduced isolation for men in task-based groups, mitigating the “Anglophone isolation” risk.
-
Protocol 4: Social Gaming as Digital Intervention.
-
Action: If digital interaction is necessary, utilize platforms requiring synchronous voice/team cooperation (e.g., MMOs, squad-based games) rather than passive social media or text-chat.
Red Flag Zone (Safety Warnings)
- Solitary Digital Interventions: AI chatbots or “mental health apps” used in isolation may exacerbate disconnection. (Source: Speaker warning/Lack of efficacy data).
- Pure Financial Compensation: UBI or severance packages provided without a mechanism for social re-integration (job placement) leave the mortality risk of “dislocation” untreated.
V. Technical Mechanism Breakdown
Pathology: The “Cohort Scarring” & Dislocation Model
The transcript rejects a purely biochemical model of depression in favor of a Sociogenic/Structural model of mortality.
- Cohort Scarring (The Diagonal Vector):
- Standard disease models operate on Period Effects (vertical line on a graph: a virus arrives, everyone gets sick).
- The drug/suicide crisis operates on Cohort Effects (diagonal line: a specific age group is traumatized by an economic shock, e.g., de-industrialization).
- Mechanism: The “scar” is not just economic but identity-based. The loss of the “provider” role or “craftsman” identity during critical developmental windows creates a permanent vulnerability to external soothing agents (opioids/alcohol).
- Kinetic Availability (The Activation Energy of Suicide):
- Suicidal ideation is often transient. The transition from ideation to action is gated by the Activation Energy required to procure lethal means.
- Pesticide/Gun Mechanism: High-lethality, low-friction means allow transient despair to become permanent death.
- Means Restriction: Increases the activation energy, allowing the “despair wave” to pass without a fatal event.
- Social Allostasis (Isolation vs. Despair):
- Despair is a subjective emotional state (cortical).
- Isolation/Dislocation is a survival threat (sub-cortical/evolutionary).
- Mechanism: Evolutionarily, separation from the tribe is a death sentence. It triggers chronic hyper-vigilance and inflammatory cascades (allostatic load) that are distinct from “sadness.” This explains why employment (tribal utility) is protective even if the individual reports low mood.
1 Like
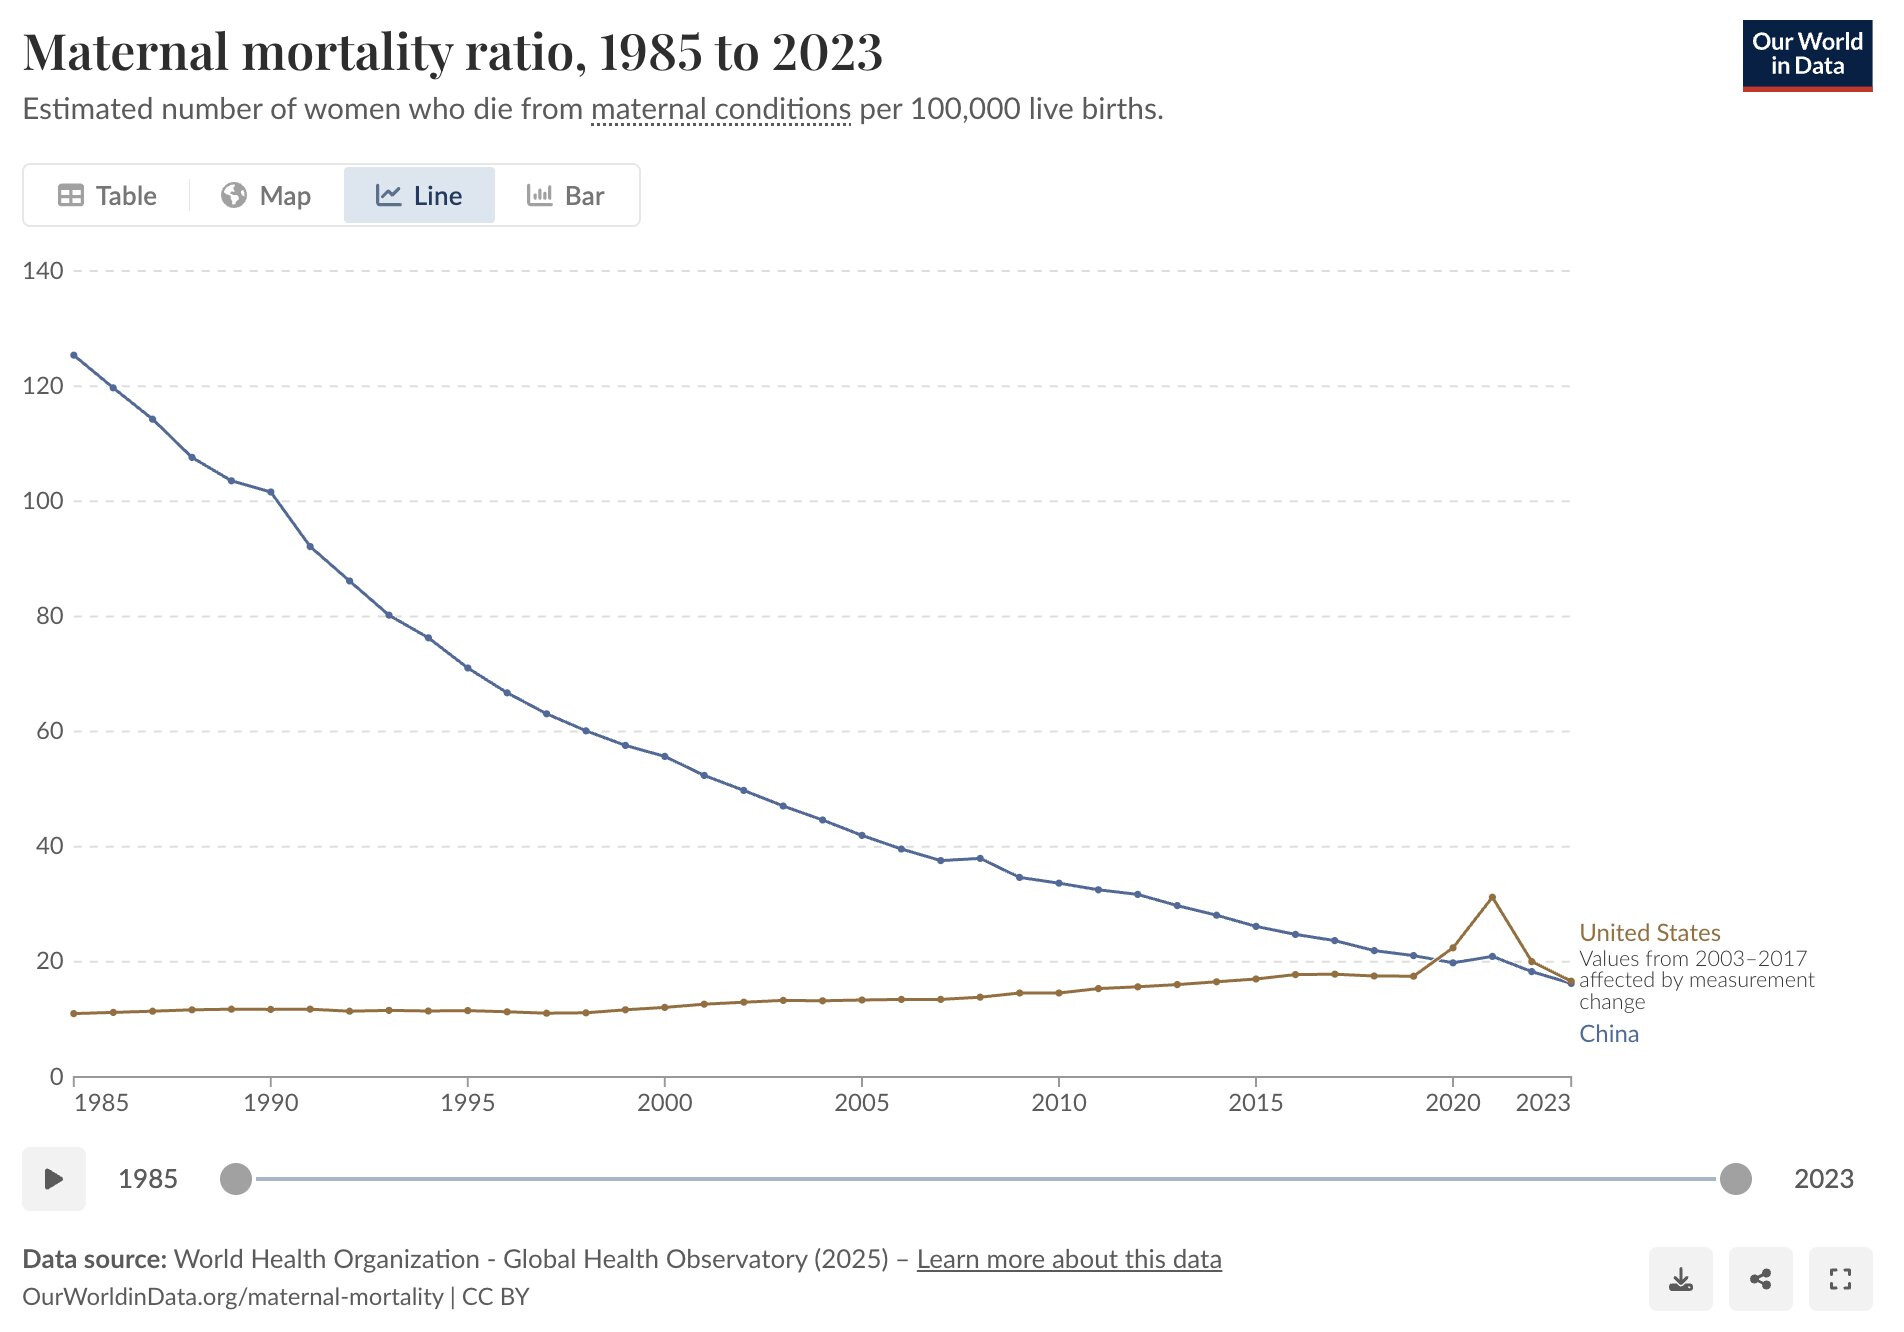
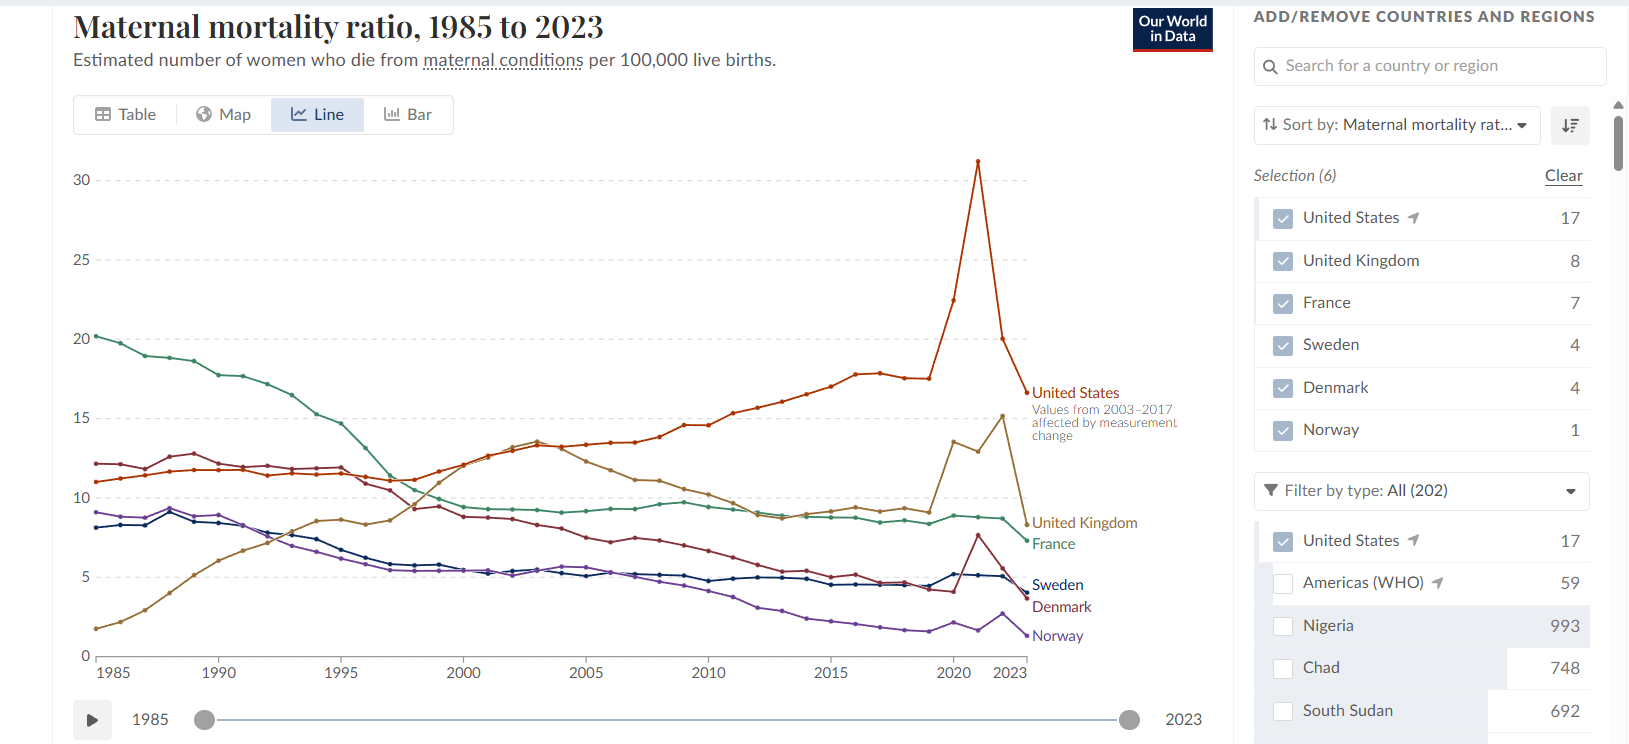
Related: maternal mortality ratio is getting worse each year in the US. Now so bad that it’s worse than China.
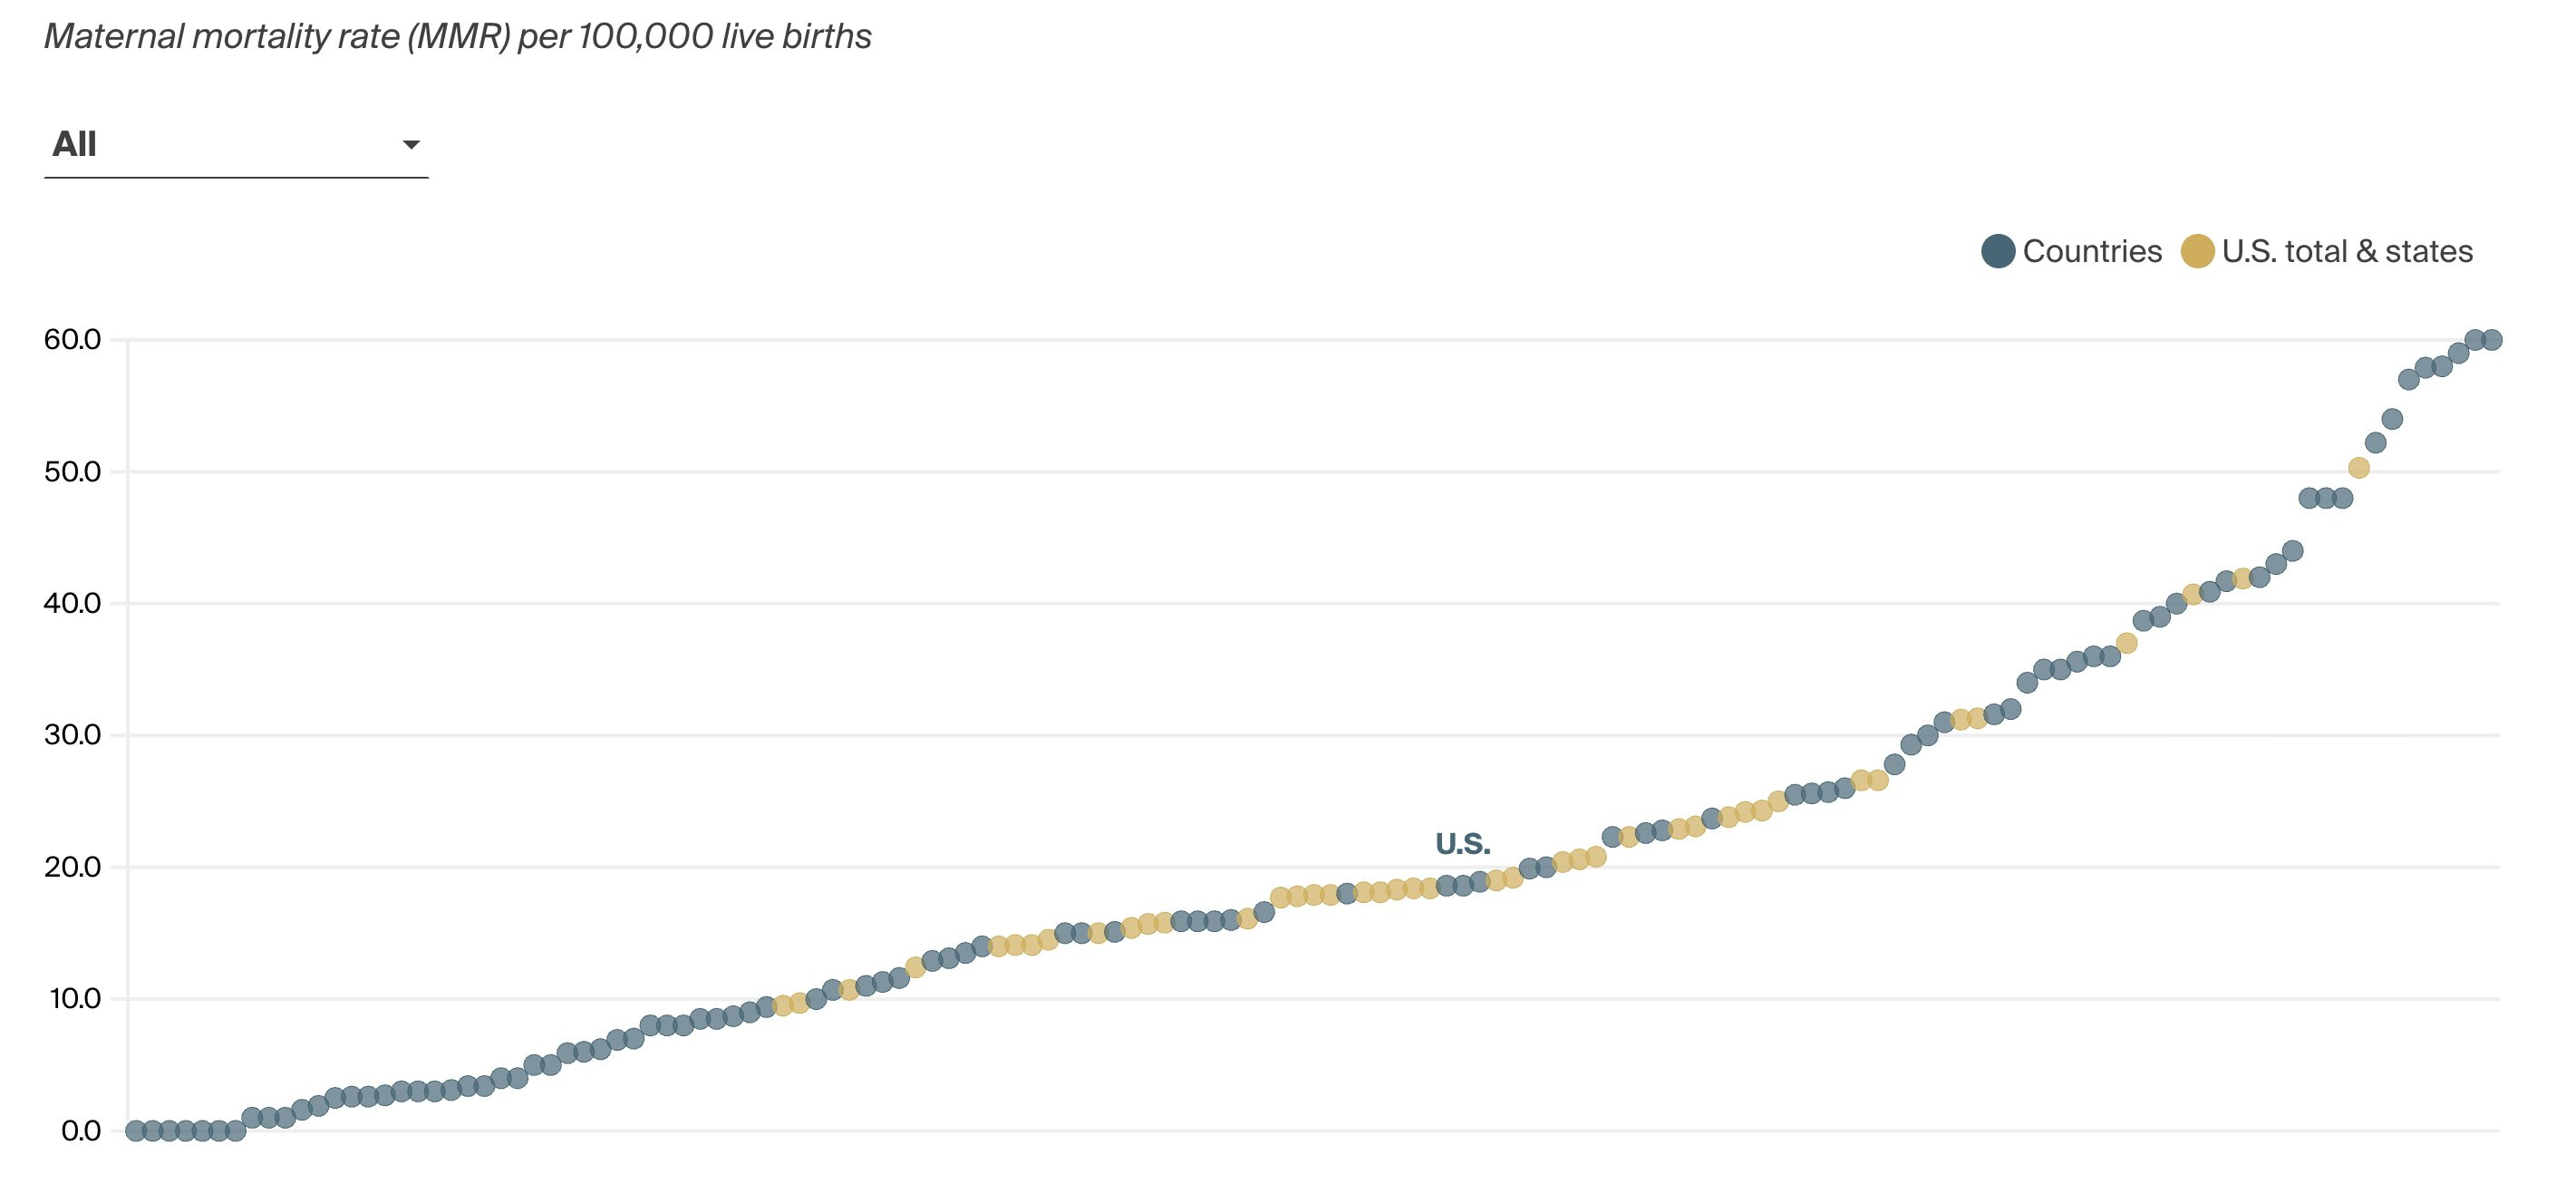
Some states are doing better, but even the best states (California and Washington) are performing like Kazakhstan and Turkey:
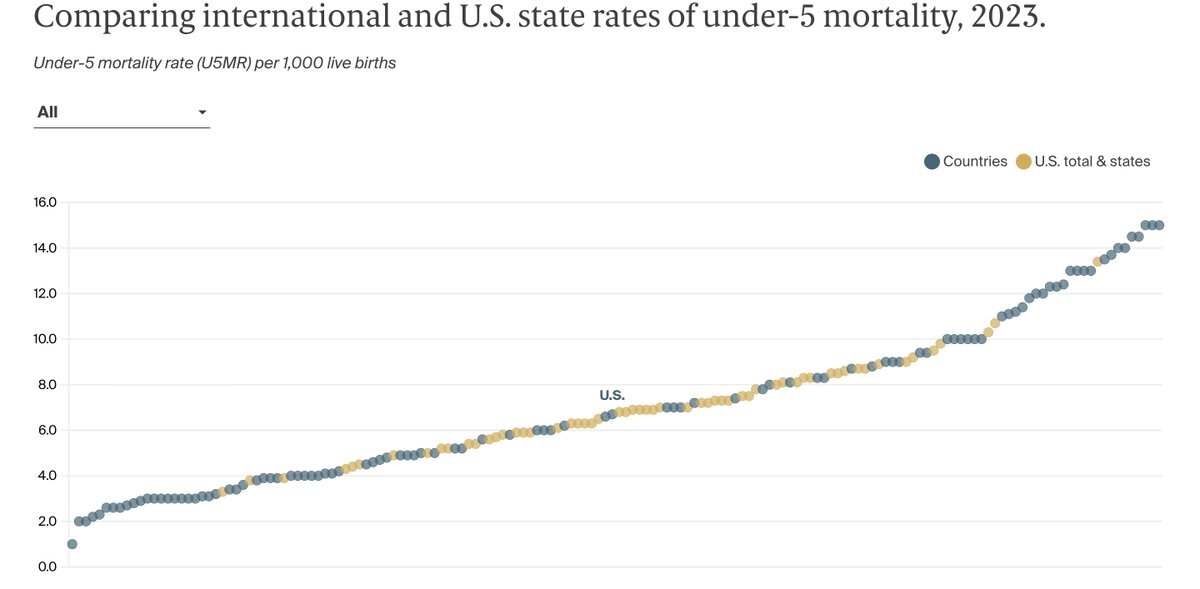
Similar picture for child mortality:
3 Likes
Thanks. But mortality increased by +21% between 1985 and 2003, then +34% between 2003 and 2017 then -7% between 2017 and 2023. And ChatGPT says that the UK, France, Italy, and Nordics (among others) are like the US in terms of reporting. So that doesn’t explain the US under performance. Although it might explain the Chinese overperformance (but probably not the overall improving trend).
1 Like
And to refine a bit further, it was flat from 1985 to 1998, then all that increase you noted came in the last five years.
Plotting the actual data you mentioned:
The US was literally murdering mothers during covid.
And look what Thatcher and Major did to the 80s-90s UK numbers! Thank god Blair got a grip on things.
1 Like
USC (University of Southern California):
Why do some people age faster than others? USC President Kim and global aging expert Eileen Crimmins – the Professor of Gerontology at USCLeonardDavis. Explore the science behind healthspan, longevity, and the limits of biohacking.

I. Executive Summary
This transcript details a high-level population health and gerontological analysis by Dr. Eileen Crimmins, focusing on the epidemiological realities of human aging, demographic disparities, and the biological validation of social determinants of health. The core thesis rejects the fragmented approach to age-related disease (e.g., treating cardiovascular disease and cancer as distinct entities) in favor of targeting a universal set of molecular and cellular changes—the hallmarks of aging—that underlie all late-life morbidity.
Crimmins presents a stark critique of the current state of consumer longevity interventions (“biohacking”). She identifies a massive translational gap between population-level epigenetic research and individualized, direct-to-consumer anti-aging protocols. Notably, she warns that single-individual longitudinal tracking using current epigenetic clocks yields unacceptable noise levels—fluctuating by 8 to 10 years within a single subject over mere months—rendering short-term clinical decision-making based on these commercial tests scientifically invalid.
A significant portion of the analysis focuses on the macroscopic failure of the United States healthcare system to optimize healthspan. While the US excels at catastrophic care and extending the lives of older adults with established pathologies, it fails fundamentally at primary prevention. Consequently, the US has engineered an “expansion of morbidity,” where lifespan is artificially propped up by medical technology, but healthspan remains stagnant or degrades. US life expectancy peaked in 2014 and currently ranks in the 60s globally, trailing behind nations like South Korea, Singapore, and Japan. Crimmins argues that the most potent levers for biological aging are not found in isolated molecular interventions deployed in late adulthood, but rather in the mitigation of early-life social stressors, childhood infectious burdens, and persistent behavioral liabilities (obesity, physical inactivity, and substance abuse) that hardwire accelerated epigenetic aging long before clinical symptoms manifest.
II. Insight Bullets
- Unified Disease Origin: Age-related pathologies (cognitive decline, cardiovascular disease, cancer) share a common origin rooted in a specific set of molecular and cellular degradations, rather than operating as independent systemic failures.
- Epigenetic vs. Chronological Age: There is a proven, quantifiable divergence between chronological age and biological age, verifiable across large human population samples.
- Epigenetic Clock Volatility: Commercial epigenetic age testing is highly unstable for individual longitudinal tracking; daily measurements in a single subject can yield a variance of 8 to 10 years.
- Biomarker Correlation: Traditional biological age indices (composites of 12+ clinical organ-system markers) correlate strongly (r 0.65 to 0.70) with modern epigenetic clocks.
- Social Determinants as Biological Drivers: Poverty, minority status, and lack of healthcare access translate directly into accelerated molecular aging, visible in epigenetic markers by a subject’s late 20s.
- Early-Life Critical Windows: Epigenetic trajectories are heavily influenced by childhood conditions, and potentially by intergenerational stressors (e.g., maternal/grandmother environments).
- The Cohort Morbidity Phenotype: Historical increases in late-life survival were heavily driven by the reduction of childhood infectious disease exposure, yielding stronger adult cohorts.
- US Life Expectancy Stagnation: US life expectancy peaked in 2014, experiencing a lost decade of progress, and now ranks in the 60s globally.
- The Lifespan/Healthspan Divergence: The US healthcare system efficiently extends the lifespan of older, diseased populations, but fails to prevent the onset of disease, leading to an expanded period of multi-morbidity.
- Demographic Reversals: South Korea, Hong Kong, and Singapore have rapidly outpaced the US in longevity, exceeding US life expectancy by approximately five years.
- Behavioral Liabilities: The unique US longevity deficit is heavily mediated by high caloric intake, low physical activity, and middle-age mortality shocks from the opioid/drug epidemic.
- Gender Parity in Morbidity: As global social gender equality increases, behavioral risk profiles (like smoking in European women) converge, closing the health/survival gap between sexes.
III. Adversarial Claims & Evidence Table
| Claim from Video | Speaker’s Evidence | Scientific Reality (Current Data) | Evidence Grade | Verdict |
|---|---|---|---|---|
| Epigenetic age can fluctuate 8-10 years when measured daily in one person. | Recent un-cited meeting presentation. | First-generation epigenetic clocks (e.g., Horvath 2013) suffer from significant technical noise. Next-generation principal component (PC) clocks and rate-of-aging clocks (DunedinPACE) have reduced this variance, but technical and biological noise in consumer tests remains a major barrier to individual tracking. | Level B | Plausible |
| Traditional clinical biological age correlates ~0.65-0.70 with epigenetic age. | Personal/Institutional cohort data. | Validated. Studies comparing composite clinical biomarkers (like PhenoAge) with DNA methylation clocks show moderate to strong correlations, confirming they track overlapping but distinct biological pathways. (Levine et al., 2018) | Level C | Strong Support |
| US life expectancy ranks in the 60s globally and peaked in 2014. | Demographic data. | Accurate. According to the UN Population Division and WHO, US life expectancy peaked around 2014 (78.9 years) and subsequently dropped due to cardiometabolic disease, COVID-19, and the opioid epidemic, currently ranking behind ~60 other nations. (CDC NCHS Data) | Level A | Strong Support |
| Early life infections dictate late-life mortality (Cohort Morbidity Phenotype). | Research with Caleb Finch. | Strongly supported by historical demographic data. Reduced inflammatory burden from childhood infections correlates with reduced cardiovascular and neurodegenerative disease decades later. (Finch & Crimmins, 2004) | Level C | Strong Support |
| Silicon Valley “biohacking” substances lack proof for delaying human aging. | Expert opinion/observational critique. | Accurate. While pre-clinical models show lifespan extension via rapamycin, senolytics, and NAD+ precursors, there are zero completed human RCTs proving lifespan extension or definitive epigenetic reversal in healthy populations. | Level A (Absence of Data) | Strong Support |
| Social hardships in childhood accelerate epigenetic aging by the late 20s. | Cohort studies (e.g., Health and Retirement Study). | Early-life socioeconomic disadvantage, trauma, and systemic discrimination are robustly associated with accelerated DNA methylation aging and telomere attrition in young adulthood. (Simons et al., 2021) | Level C | Strong Support |
IV. Actionable Protocol (Prioritized)
Because this transcript originates from a population health demographer rather than a clinical trialist, the “protocol” shifts from acute pharmacological interventions to systemic and environmental risk mitigation.
High Confidence Tier (Protocols backed by robust longitudinal data)
- Prioritize Standard Clinical Biomarkers over Epigenetic Clocks: Do not alter clinical protocols based on short-term changes in direct-to-consumer epigenetic age tests due to unacceptable standard deviations (8-10 year noise margins). Rely on composite, traditional physiological systems testing (e.g., advanced lipid panels, HbA1c, renal/hepatic function, VO2 max) to assess biological aging.
- Aggressive Early-Life/Adolescent Optimization: Interventions to maximize healthspan must be front-loaded. Mitigating chronic inflammation, securing metabolic health, and optimizing sleep/stress in the 20s and 30s dictates the epigenetic trajectory for the 70s.
- Behavioral Basics as Primary Biohacks: The data clearly indicates that the US longevity deficit is driven by fundamental metabolic and behavioral failures. Absolute priority must be given to matching caloric intake with daily energy expenditure (physical activity) to avoid the uniquely American obesity-driven morbidity expansion.
Experimental Tier (Mechanistically plausible but requiring long-term human validation)
- Pharmacological Biohacking: The use of targeted molecular therapies (mTOR inhibitors, senolytics) remains experimental. While they target the “hallmarks of aging” mentioned in the transcript, their deployment in healthy human populations lacks the safety and efficacy endpoints established by Level A/B evidence.
Red Flag Zone (Claims debunked or lacking safety/efficacy data)
- Short-term Epigenetic Tracking: Testing epigenetic age daily, weekly, or monthly to validate a new supplement or diet. The technical noise completely obscures the biological signal.
- Relying on Late-Life Medical Rescue: Planning to utilize the US healthcare system to preserve healthspan in late adulthood. The system is designed to extend lifespan post-disease onset, resulting in a prolonged state of morbidity rather than an extended healthspan.
V. Technical Mechanism Breakdown
- Epigenetic Age (DNA Methylation Clocks): The transcript heavily references epigenetic aging. This refers to the addition of methyl groups (CH3) to cytosine bases in the DNA sequence, specifically at CpG dinucleotides. These methylation patterns dictate gene expression (turning genes on or off) without altering the underlying genetic code. As organisms age, highly predictable shifts in methylation occur (hypermethylation of tumor suppressor genes, global hypomethylation). Clocks developed by Steve Horvath and others use machine learning to correlate these methylation patterns with chronological age and mortality risk.
- Expansion of Morbidity vs. Compression of Morbidity: The transcript outlines a failure to achieve “compression of morbidity.” In an ideal gerontological scenario, human lifespan approaches its maximum limit while the onset of chronic disease is delayed until the very end of life, compressing the period of illness into a brief window. Instead, the US is experiencing “expansion of morbidity,” where medical technology (e.g., statins, advanced oncology, stents) artificially suppresses the mortality rate of chronic diseases without addressing the root cellular senescence. The result is a prolonged, decades-long survival phase characterized by compounding polypharmacy and multi-morbidity.
- Allostatic Load and Biological Weathering: The biological translation of the “social factors” discussed by Crimmins occurs via the HPA (hypothalamic-pituitary-adrenal) axis and sympathetic nervous system. Chronic psychological or socioeconomic stress leads to persistent cortisol elevation and systemic low-grade inflammation. This sustained “allostatic load” accelerates cellular aging mechanisms, specifically driving telomere attrition and inducing premature cellular senescence, visually quantified as advanced biological age in marginalized demographics.
1 Like
I also wonder how much maternal age plays into this. It’s well known that increased maternal age is a risk factor for more complicated pregnancies and higher rates of adverse outcomes.
For context, in the US women had their first child at 21.4 years old in 1970. Today the first birth is when the woman is 27.5, and the average for all births is 29.9. In women with a university degree, it’s 31.
In China, mothers are now an average age of 28.8, and in major cities it’s >32.
It strongly correlates with wealth and maternal education level and seems to be a global inevitability as every country gets wealthier.
Out of interest, the earliest births in the world are Bangladesh, with an average first birth at 18, and an overall average of 25.7.
I think we have to still point out that the actual rate is pretty low overall. Those are deaths per 100,000 live births, so even the worst data point is 31 per 100,000, or 0.03%. Of course every one is tragic, but maternal deaths are still thankfully rather uncommon.
- Maternal age is increasing all around the world. And yet maternal mortality is decreasing is most of the world except the US. Cannot be the explanation.
- Yes deaths are low. But deaths are just the peak of the iceberg that is unfortunately easy to see and measure. For each death there are about 100 severe maternal morbidity cases (SMM) or 70 “near-misses” and probably 1000x “lighter” complications. If MMR increases, those increase as well. It reflects lower quality of healthcare overall:
- Checking your browser - reCAPTCHA
- https://www.aamchealthjustice.org/news/viewpoint/building-trust-preventing-trauma
Given how much healthcare costs are increasing in the US, and all salaries aren’t increasing that much, it makes sense that quality is decreasing for those who are price sensitive:
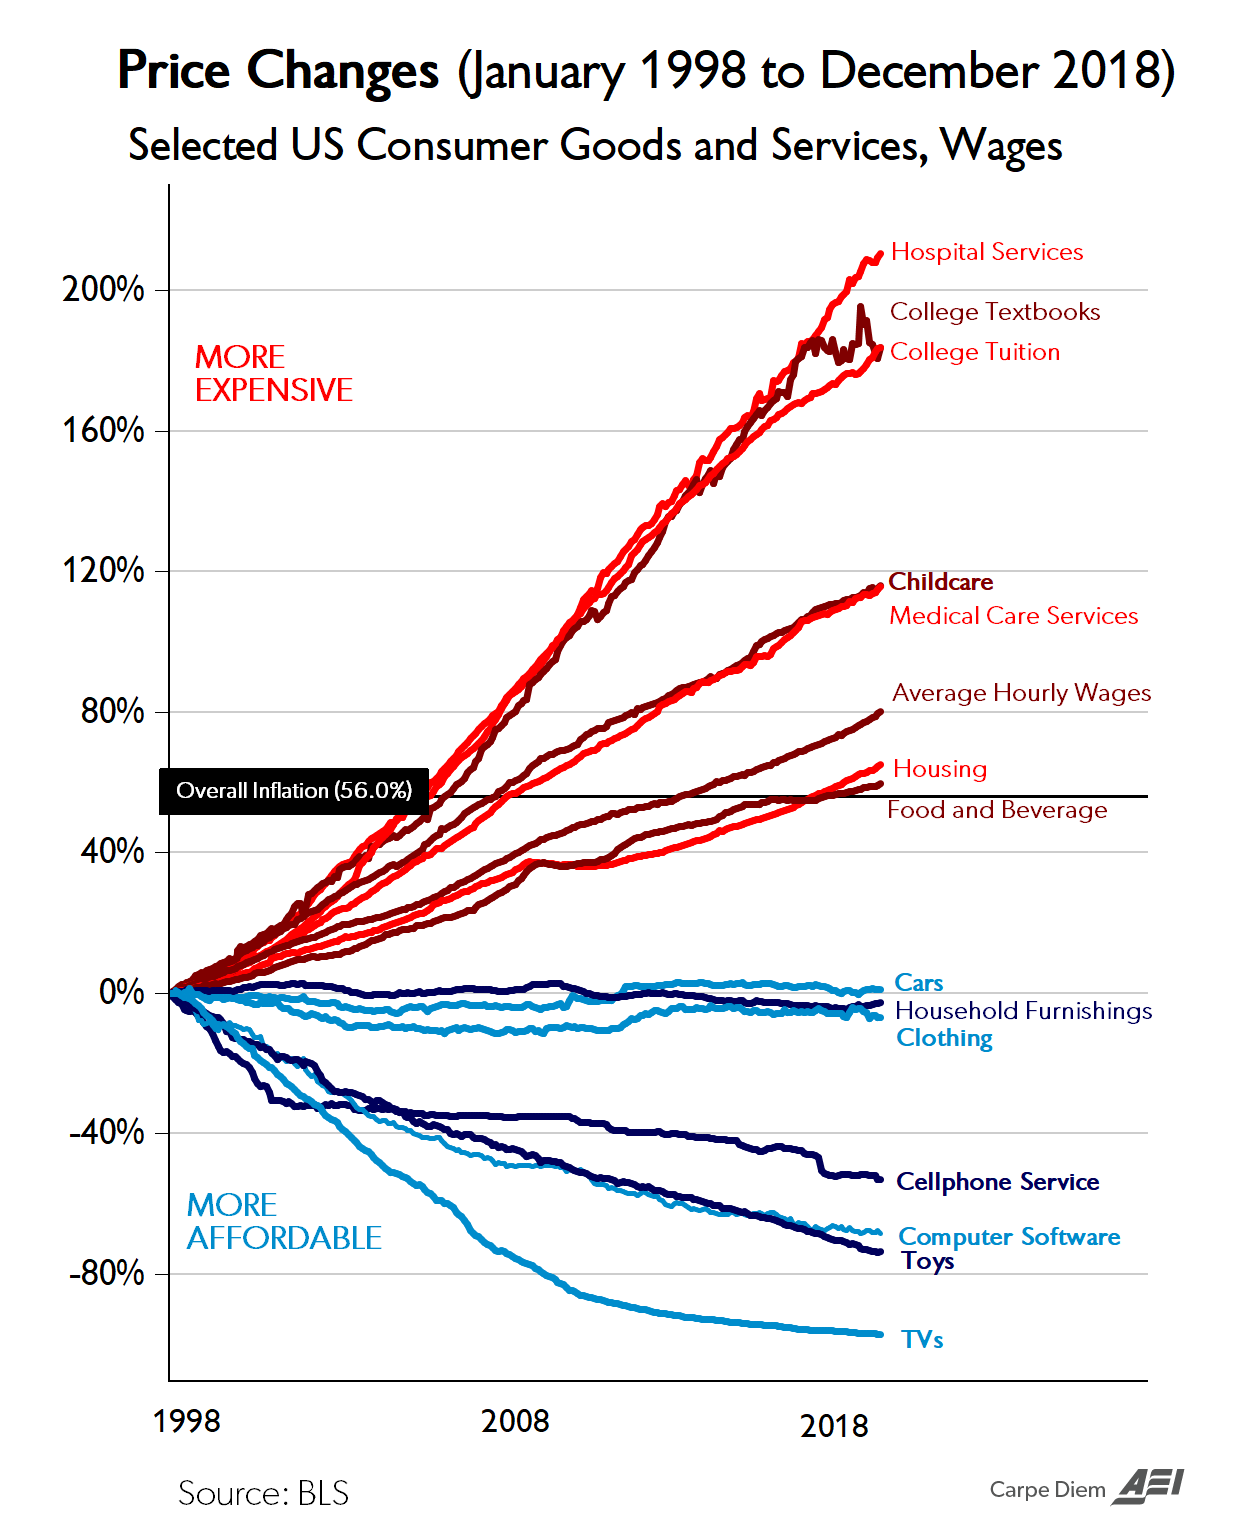
3 Likes
8 posts were merged into an existing topic: Optimal Blood Pressure we Should Target? Systolic Under 110 or 100?