Dunedinpace vs other clocks…
In a word, incomprehensible!
Maybe worthwhile for scientific people but not for the layman.
The basic age number is understandable but little beyond that for me or my doctor! He suggested I get the test - I now get the impression he won’t be suggesting anyone else get it!
Can you post the report (or some pages from it)?
17 pages of this
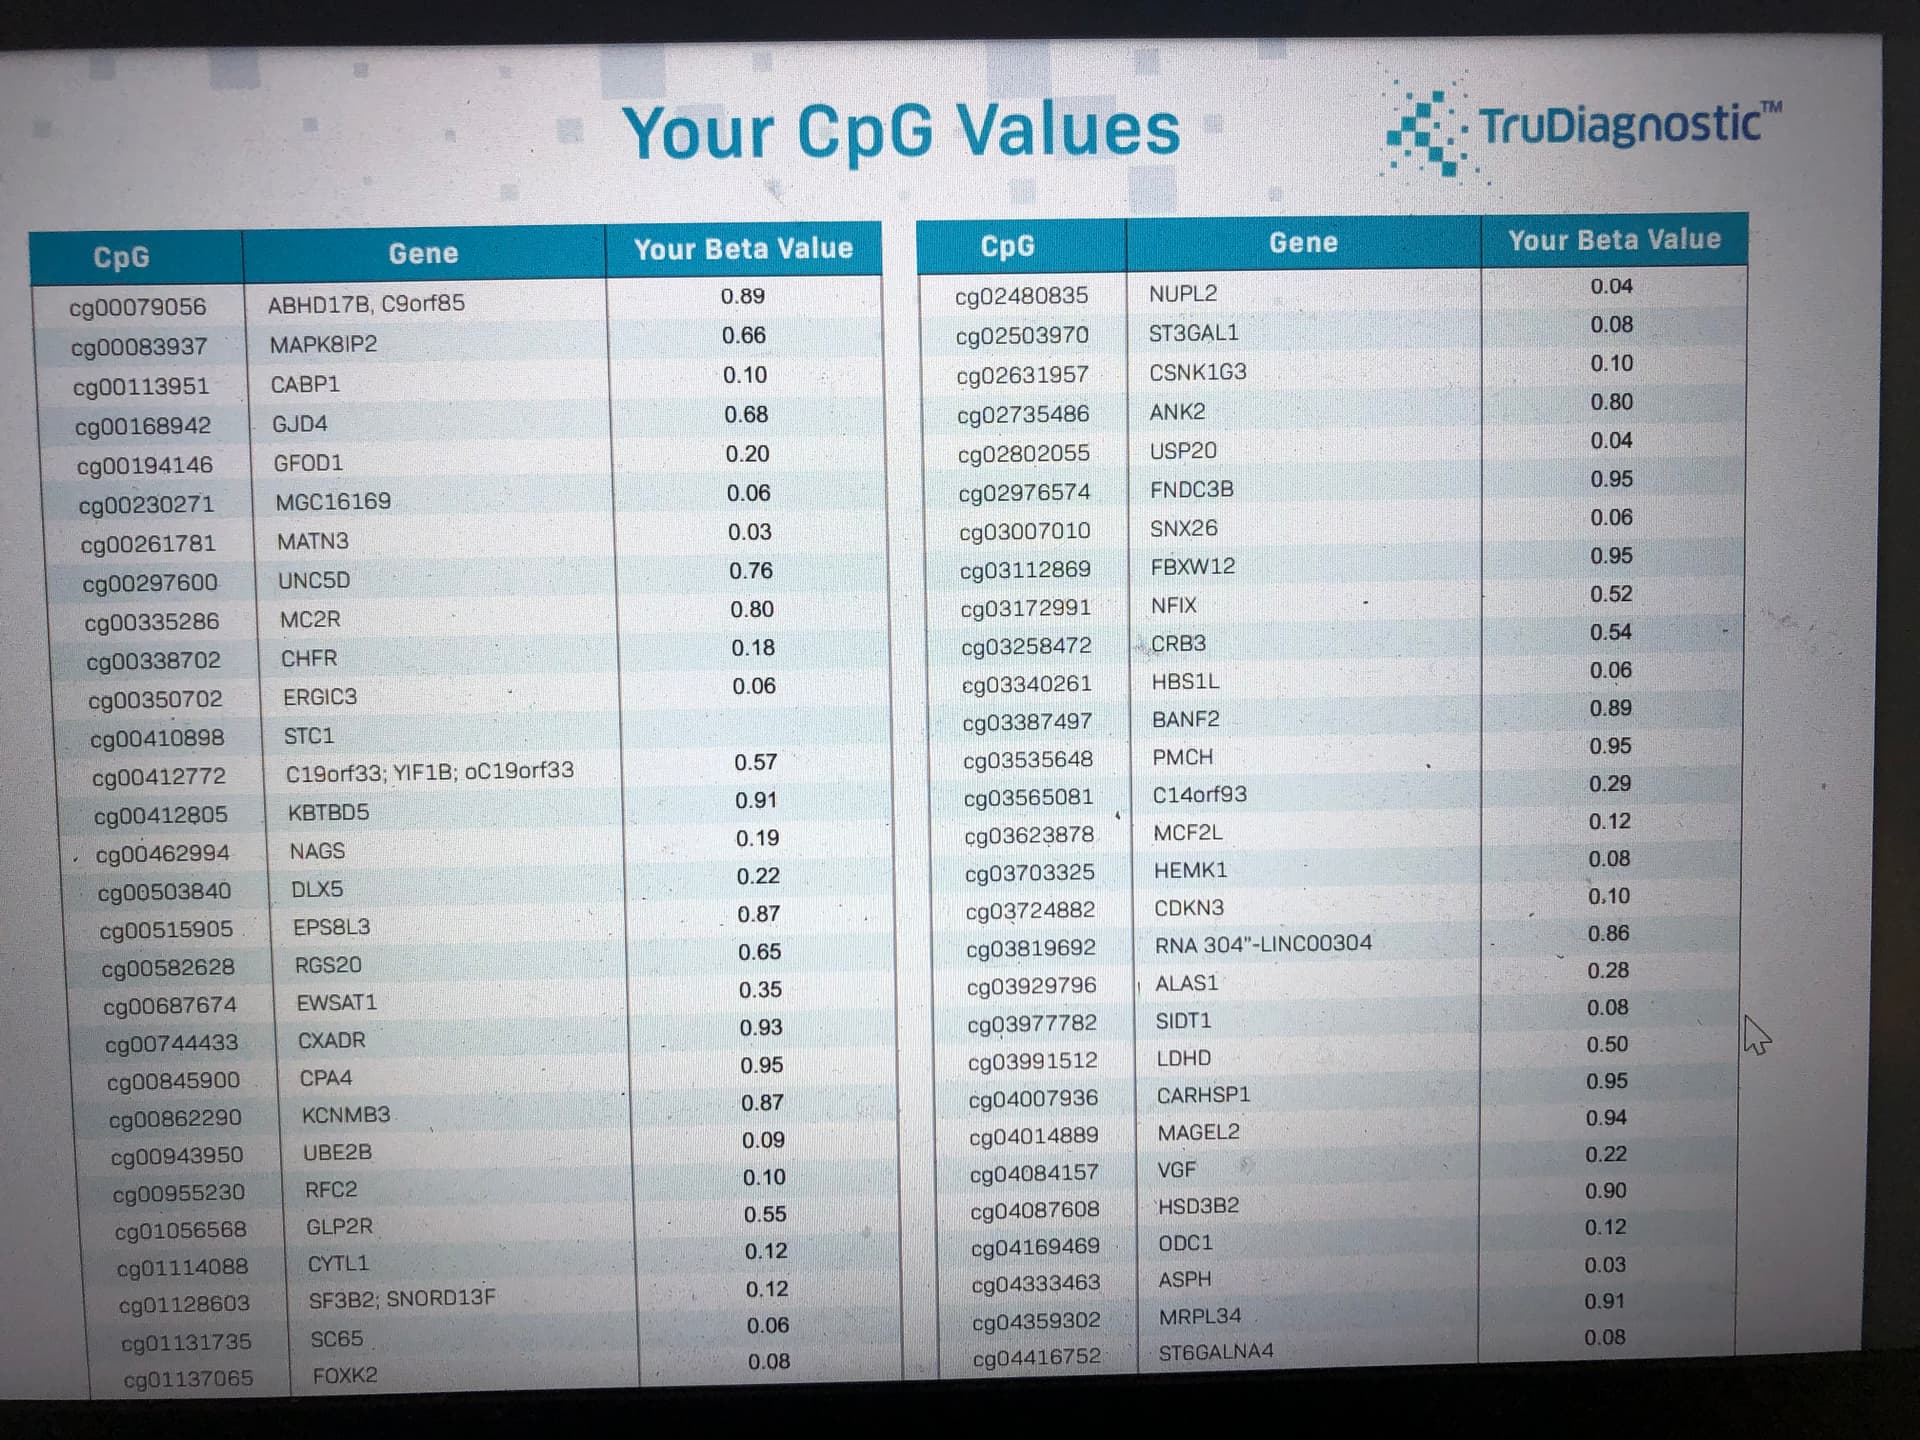
Any idea what this means ??
The rest just tells you your age and states the obvious about diet and exercise etc.
2 Likes
And they just give you a DunedinPace number that tells you how fast you were aging when you gave your sample. (I was 2/3rds the average rate (and that was before taking Rapa) but they said my overall biological age was much older than chronological so it really doesn’t stack up!!)
1 Like

1 Like
This is showing you how methylated particular CpG cites are. Some of these cites get predictably hypermethylated with age (so this value goes up) while others get predictably hypomethylated with age (so this value goes down). If you’re curious to do a “before and after” some intervention, these are some key CpG cites and the genes they’re associated with that reliably get hypermethylated with age (and so you want these to go down):
cg16867657 (ELOVL2)
cg06639320 (FHL2)
cg16419235 (PENK)
cg17861230 (PDE4C)
cg07553761 (TR1M59)
cg25410668 (RPA2)
Conversely, these CpG cites get consistently hypomethylated with age, so you want these to go up:
cg02228185 (ASPA)
cg25809905 (ITGA2B)
cg16054275 (F5)
cg06874016 (NK1RAS2)
3 Likes
That is very useful to know, thanks very much.
I will be taking another test around 9 months after starting Rapamycin so it will be interesting to see what happens to the particular ones you highlight.
Are there more hypermethylated sites than hypomethylated sites? Are hypomethylated sites more likely to be spread out throughout the genome (and at more sparsely-populated CpG sites) than hypermethylated ones? This could have implications for those who supplement with methyl donors or TET-enzyme-enhancers like folate
you want tumor suppressors to NOT be hypermethylated, and oncogenes to be hypermethylated.
Also REST to NOT be hypermethylated
IDK what their strengths are here, the strongest age-associated methylation marks are still in the strangest places whose biological value is unknown.
for more reference see https://twitter.com/sproul_lab and
RPS wrote: I was 2/3rds the average rate (and that was before taking Rapa) but they said my overall biological age was much older than chronological so it really doesn’t stack up!!)
Exactly… I am 65 chronological now and they rated me 67 biological… in spite of DEXA… no fat… great bone density, Coronary Calcium Scan of zero… Blood panel excellent. And on rapamycin where my physician says its obviously improving you in many ways. Trudiagnostic I think has it very wrong.
2 Likes
I now have my third report. All are this year:
I must admit I am not really clear on it. For those that don’t know, I am 63. I give the three readings:
OmicAge 64.098, 58.432, 58.362
PaceOfAging 0.78, 0.82, 1.051
Fitness Age x,x,46.55
Intrinsic Epigenetic Age: 62.94, 59.28, 53.38
Extrinsic Epigenetic Age: 47.25, 45.8, 36.59
This is where I get really confused in that my epigenetic ages are going down, but the rate of aging is going up.
I may do this again, but I must admit I prefer the blood biomarkers because I can understand what they mean.
3 Likes
Here are all of my reports, after one year of rapamycin. I don’t have any other tests to compare.
Summary
2024 Jan Summary Report.pdf (3.2 MB)
OMICmAge, which is said to be most accurate (relative to Intrinsic and Extrinsic):
2024 Jan OMICmAGE Report.pdf (8.0 MB)
DunedinPACE, relative pace of aging:
2024 Jan DunedinPoAmTruReport_149167_2A8BFWJ.pdf (2.0 MB)
Teleomere Length:
2024 Jan TelomereLengthReport_149167_2A8BFWJ.pdf (477.0 KB)
Physical Fitness:
2024 Jan Physical Fitness Report.pdf (2.6 MB)
Weight Loss:
2024 Jan WeightLossReport_149167_2A8BFWJ.pdf (481.0 KB)
This video, mentioned in another thread, gives useful insight to some of the above.

I have some comments I will add in additional posts.
3 Likes
Thanks for sharing! This is really interesting.
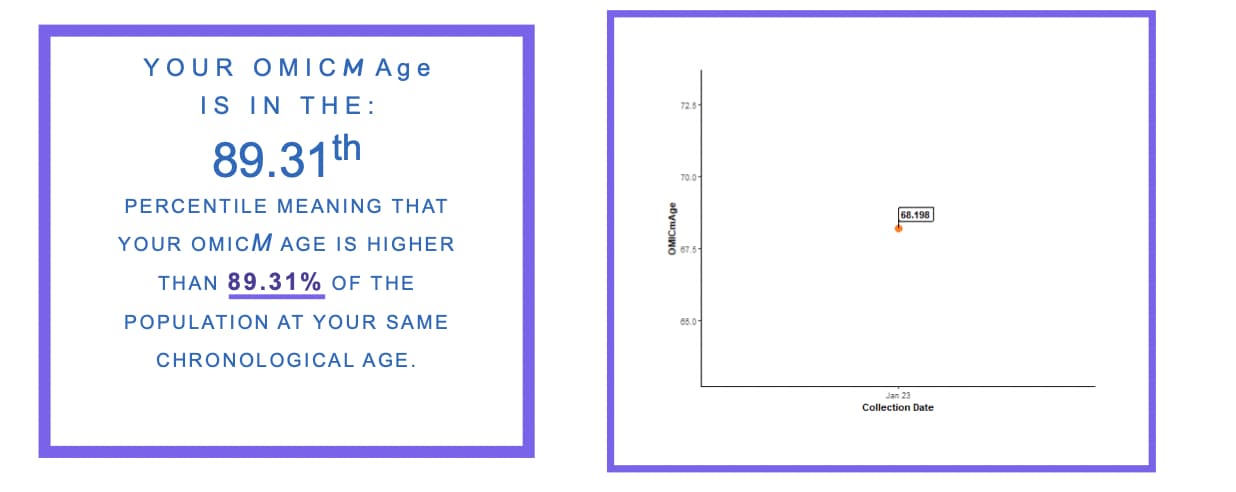
Looking on the first page of the first report, Given that they report your biological age is less than your chronological age (by 3 years), I’m confused by this statement, that your “omicM Age is in the 89th percentile”. Given your bio age is less than your chron. age, it seems that you’re in a better state than most people. But perhaps I guess the way to interpret this is that the people using this test tend to be significantly healthier (lower biological age) than most of the population. Is that how you interpret this?
1 Like
Yes, I think the comparison population is largely other test takers.
They’re all Lake Woebegone High School graduates. Well above the general population average in terms of health.
Will have to confirm.
2 Likes
2/15/23 Update:
OK Len, do you not understand what the word ‘proxy’ means?
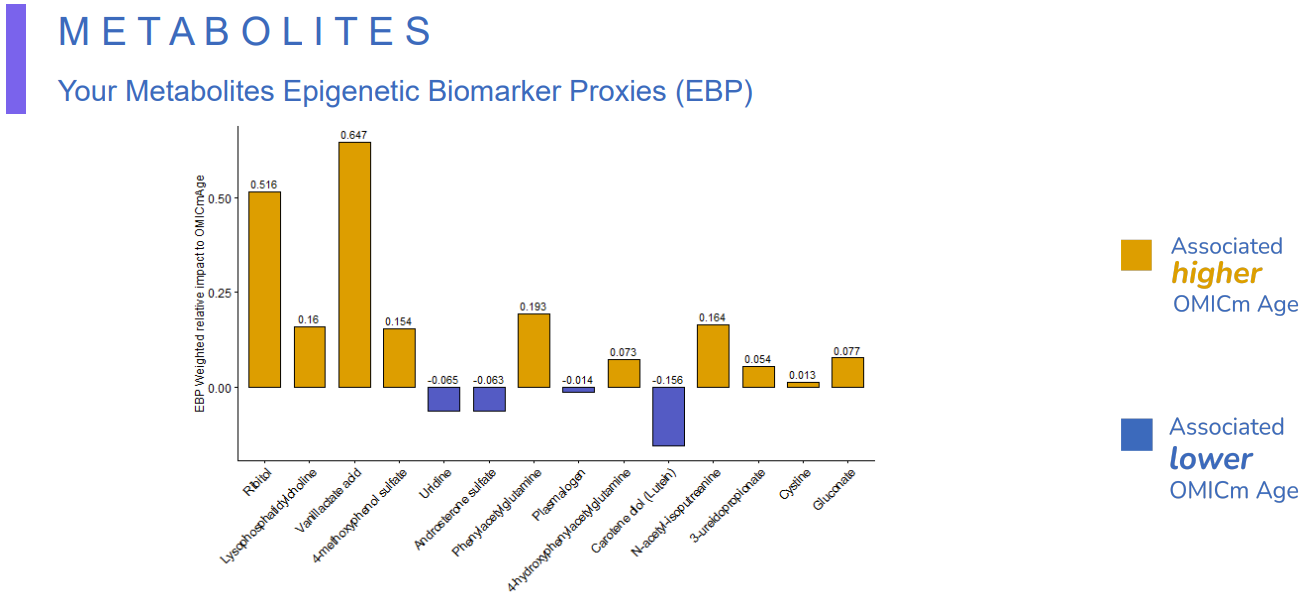
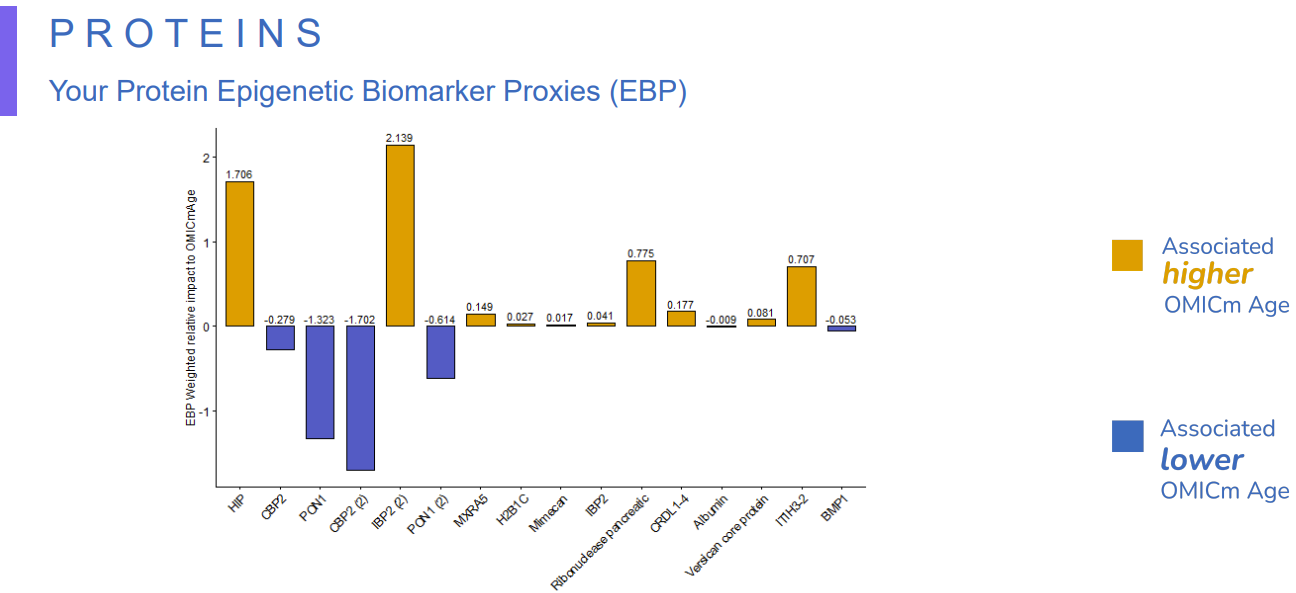
Need to keep reminding myself that the below items are not direct measurements. I guess my methylation status is consistent with their psuedo-direct imputed values.
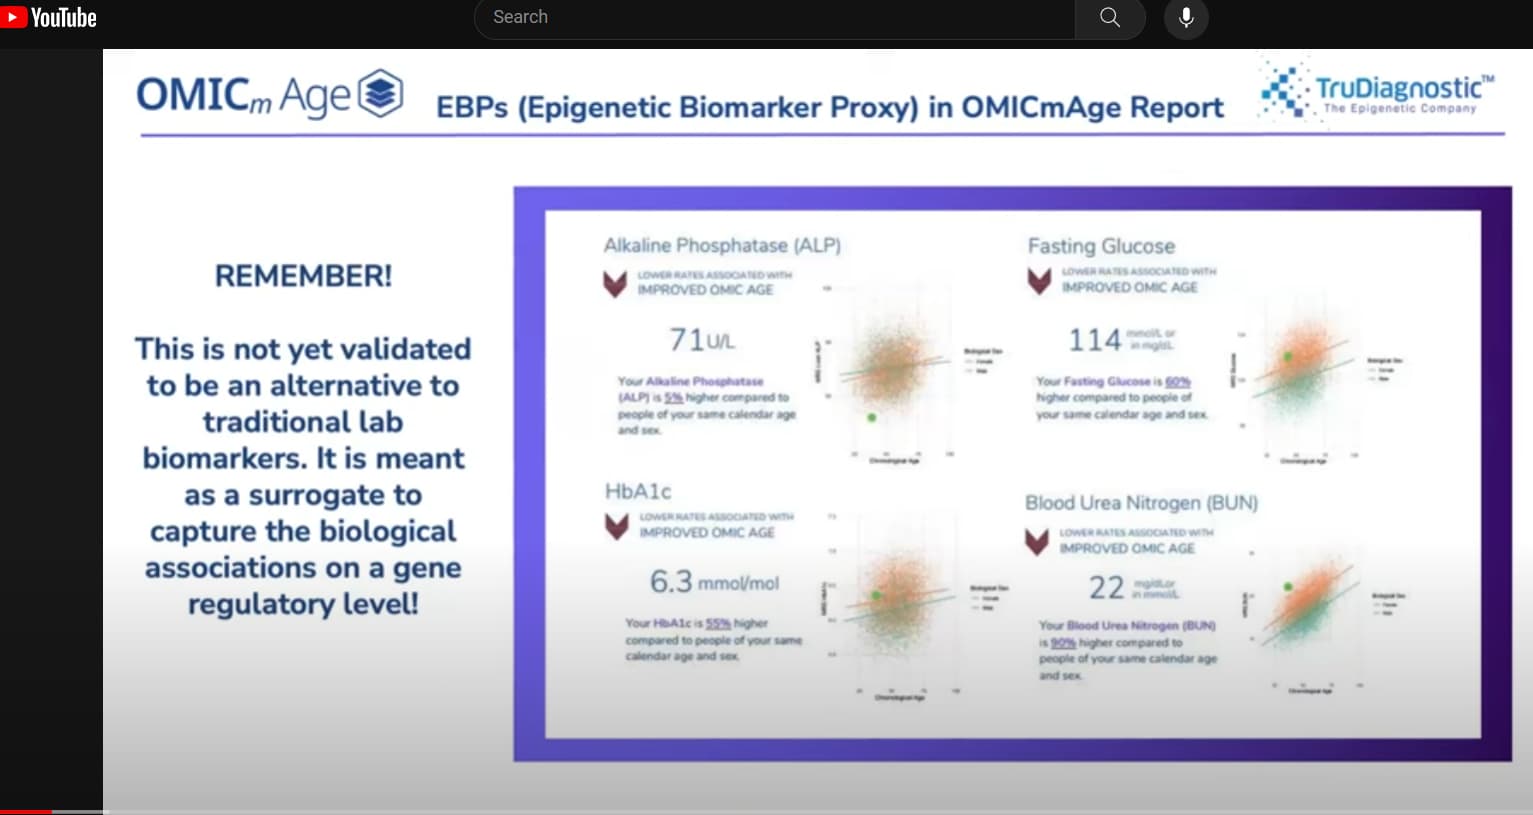
Above is from another useful video about interpreting your results. And it has a transcript link in the description. (The title shown in the preview is not indicative of the content.)

In the above, it is mentioned that the proxy value for the heavily-weighted RDW may not entirely align with what is indicated by ‘real’ RDW. Their proxy value is more reflective of inflammation. (Or so I think I heard.) Perhaps having osteoarthritis and cardio disease, among other things, contributes to my inflated RDW proxy.
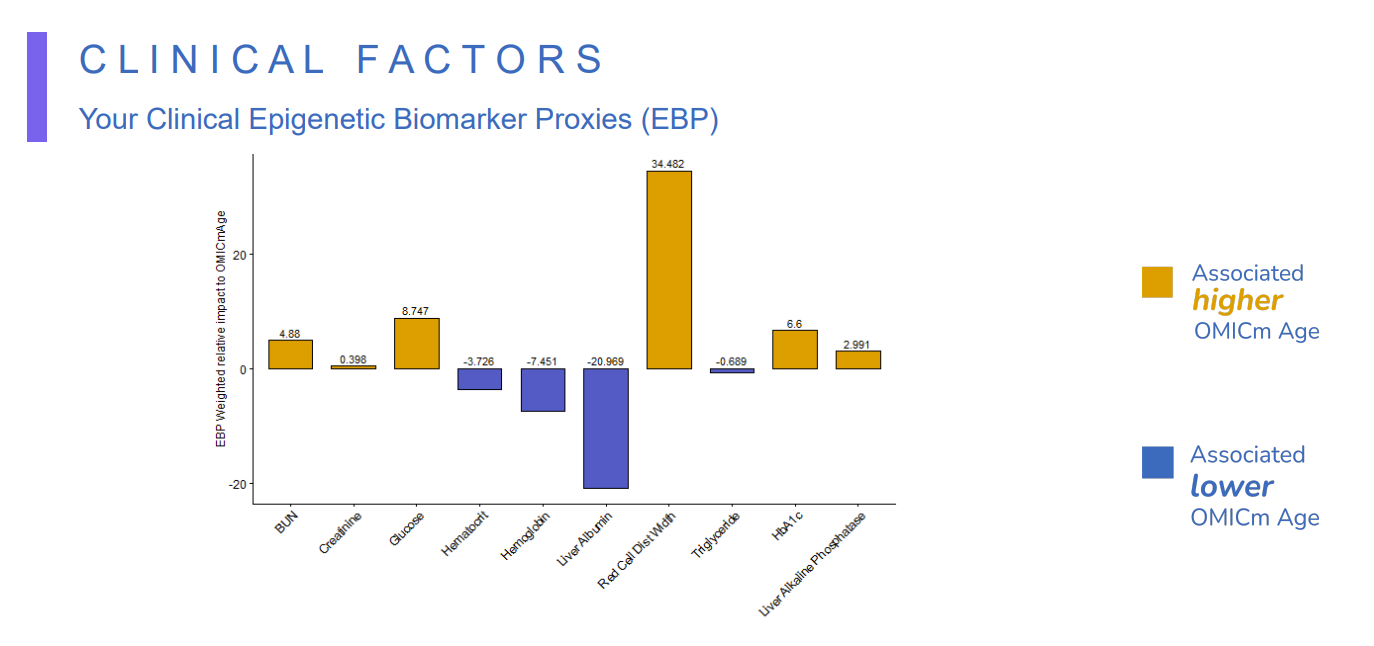
Here is a compilation of the epigenetic biomarker proxies, what they predict, and suggestions as to how to improve.
Original post:
I think the calculation of my OMICMage has, at least partially, a ‘garbage in’ problem.
Here are some key measures from the report:
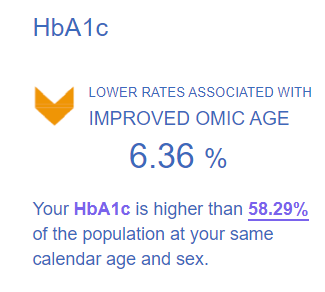
6.36 would likely put me in the diabetic camp.
Now here are my LabCorp test results for the last year. The result furthest left (5.1) is from February 2. (It seems the akkermansia and other treatments are having an effect.) (The Tru blood sample is from January 23, so about ten days earlier.) The highest reading I had at any time in 2023 is 5.6.
So how on earth could they come up with 6.4, when only a few days later, LabCorp reported 5.1? The Tru result is not credible.
Labcorp for the last year:
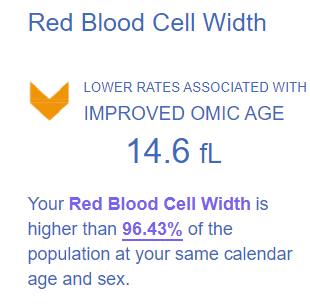
Again, the 12.2 LabCorp reading is from February 2, and and the one next to it (12.0) is from January 5. The 14.6 Tru result falls between those to results. So, 12.0 ->14.6->12.2. Not credible.
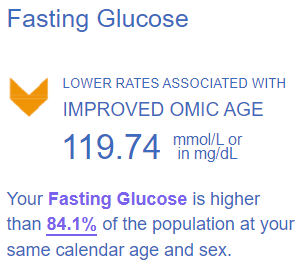
I think the above number is likely mg/dL. I don’t recall any instructions to be fasting when taking the blood sample. I sure as hell don’t have a fasting glucose of 120, again, that sounds like diabetes territory. 86 was the February 2 reading. It’s usually in the mid to high 80’s.
Creatinine - They report my highest number ever, 1.7. My January and February numbers were 1.5. Possible, maybe, but probable, I don’t think so.
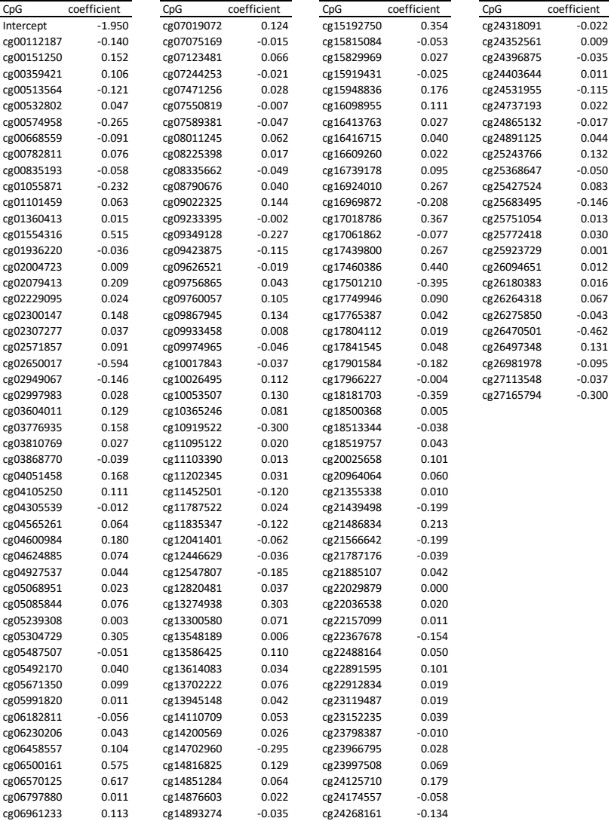
The other standard blood markers look plausible. But the above line items I’m questioning have considerable weighting in the age calculation. Look at the weightings below for RDW, glucose, and A1c. My guess is that, if valid values were included in my calculation, my ‘age’ would be at least a couple years younger.
I thought I was going to get some feedback on the above by emailing Tru support, but I’m being told to get all my questions together, and arrange a paid consult. I’m going to try emailing the head honcho and see if I get a credible answer.
2 Likes
Ok, here’s another item of potential interest. ‘CD4/CD8 T Cell Ratio’.
Apparently I have an ‘inverted’ (less than 1) ratio, which is a potential signal of trouble.
But of note to rapamycin users, the test says that via the results here, they have been able to identify ‘.…individuals taking rapamycin at too high of a dose’. Just how one make this determination is not explained. I think we’d all like to know.
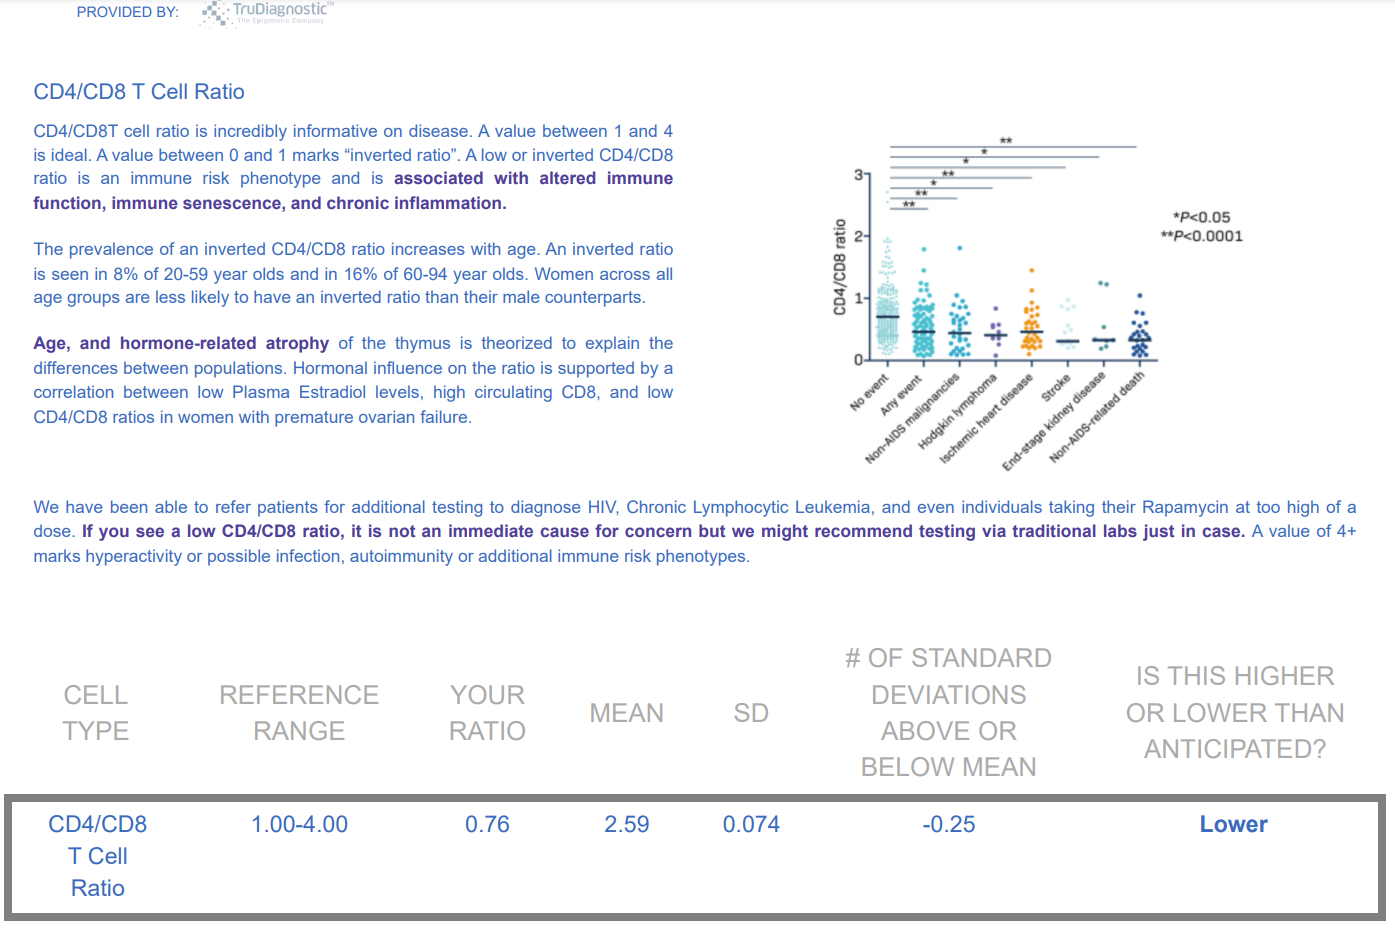
Also detailed in the ‘Immune Health’ section of my reports is the fact that I have a percentage of ‘natural killer’ cells 7 standard deviations above the norm. Whether this reflects lack of other immune cells, or my cup runneth over with NKs, I dunno.
3 Likes
That sounds like it may be a reference to @Agetron and his testing experience… but maybe I’m getting “TruAge / TruMe” and “trudiagnostics” confused… More Rapamycin Might Not Be Better
2 Likes
I got a response from Brian. He didn’t think rapa had anything to do with my immune health result. But he didn’t explain the ‘too high a dose’ detection comment.
His contact info actually includes a link to schedule a 30 minute call with him. Not sure if it’s meant for the great unwashed, but I may try to set one up after further study.
I also updated the earlier post about the ‘weird’ biomarkers they came up with. In essence, I was forgetting they’re proxies, not the real thing. I also added links to additional sources of info that are very useful in interpreting the omicmage reports.
1 Like