One very interesting topic which @Joseph_Lavelle, I and others have tried to get a grip of is if there is some kind of warning signs, biomarkers or something else which indicate that we push ourself too much when practicing different longevity interventions.Because too much of a good thing can be detrimental as the researcher Pankaj Kapahi has said.
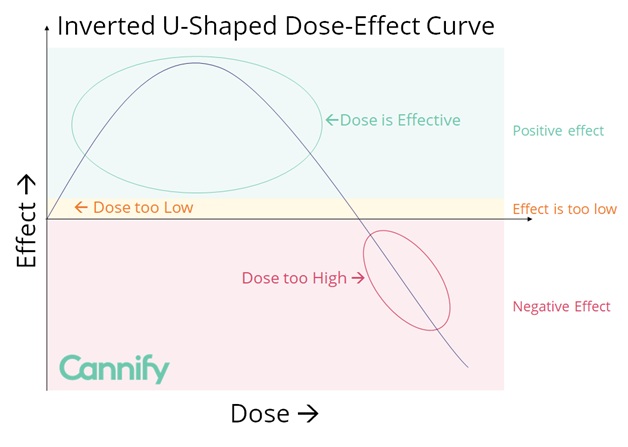
The below image is little bit simplified but I think it shows quite good where we want to be when it comes to the total “dose” of all our longevity interventions combined. We don’t want to be too scared and passive and have a too low dose with no or very low effects. But we don’t either want too be too aggressive and have a too high dose so it backfires and leads to detrimental longevity effects. We want to be in the longevity zone and find the right optimal dose.
So how can we achieve this? One first thing that comes to my mind which most likely would help to answer this question easier is to start with listing what potential negative effects that can occure. When we know that then we could see if can map that negative effect to a biomaker or something else. After that we can track multiple biomarkers or another things as a whole to get a feeling if we are pushing us too much and need to take a step back or not.
Here are some potential negative effects. Lets try to create a list. Any suggestions?
Negative effect
Measurement/s
Underweight
Body fat percentage (< 6% males, < 16% females) Waist-to-height ratio (< 0.4) BMI (< 18.5 males and females)
Undermuscled
Muscle percentage Grip strength Max pushups
Overmuscled
Muscle percentage Body fat percentage BMI (> 30)
Fatigue
Subjective rating
Immunosuppression
Colds per year Sick days per year
Inflammation
CRP high sensitive (> 3 mg/L) Subjective pain rating
I did a review of the cellular response to hypoxia and there clearly are there initial responses which are positive (once the stimulus has an effect), but as the effect gets bigger the cellular response starts moving into other pathways.
The pathways are HIF 1 alpha, NRF2 and NF kappa B.
This is a great topic. Perhaps we should separate the discussion into buckets:
(1) overlapping interventions. List interventions (rapa, metformin, spermadine, acarbose, etc) by effect on hallmarks of aging to identify where there is overlap (see chart from autophagy video)
(2) better or worse? Monitor improvements vs. degradation of function (strength, endurance, pain, etc.), general health (BMI/body fatness, bon density, RHR, BP, a1c, apoB, etc) and biological age (factors in Levine or Aging.ai?). Which markers point to which hallmark of aging…to point the finger at where the overlap of interventions needs attention.
What else?
@John_Hemming
Those are inflammation markers? Should we add Inflammation as a negative effect? Also add including those biomarkes “CRP high sensitive”?
@arugula Yes, it’s very tricky this to get some kind of general thing. BMI is also not a great marker but it can have a value if it’s combined with other markers. What is the BMI recommendation in Asia for male and females?
I like the overlapping longevity intervention matrix That can give an nice hint on how to combine the longevity interventions in a better way. Important though is that the matrix is guess work so we should not believe blindly that everything is like that. I think the overlapping matrix could be the next step in this discussion or could you create a new discussion thread on that and we focus in this thread on listing the negative effects and how to monitor them in a good way?
“Dosis sola facit venenum - It’s the dose makes the poison” - Paracelsus (1493-1541). They still taught that in med school in my days. Things might have changed since then but I am not that old and still believe it’s true
Because it’s generally a good enough predictor and the people complaining about it are usually not 6’6 olympic weight lifters but morbidly obese women.
A couple of thoughts (mostly on the weight parameter):
BMI is a terrible and often wrong indicator of healthy body mass. It is especially weighted to grossly mischaracterize muscle as fat and categorize healthy weight athletes as overweight.
Body mass and body weight (ie, whatever underweight or overweight points to) is age-correlated. It’s nonsensical to suggest that underweight is the same at age 25 as 75. Muscle mass, bone density and musculature are hugely different and will directly affect the BMI calculation.
I would think that some of the top risk factors for heart disease and stroke ought to be in a calculus like this. Blood pressure for example. Before you even bother taking blood samples, hypertension would be a strong signal that something has gone awry; likewise with significant hypotension.
Is there any evidence than an excessive amount of muscle mass extends life? I think not. Excess muscle might be less metabolically unhealthy than excess fat but it is probably less healthy than enough muscle mass. That should shift the debate to what constitutes “enough.”
True, but calculated BMI is cheap and convenient, and it is probably as good as most other individual measurements we use. It certainly is a common enough indicator and still shows up near the top of the list on most doctors’ office and hospital intake forms:
Height, weight, BMI, blood pressure, pulse rate, temperature, and oxygen saturation.
There are rare exceptions but the vast majority of the people who are obese by BMI standards are indeed fat and should lose weight. I am particularly skeptical that older people whose BMI indicates they are “obese” are actually overmuscled athletes. Nonetheless if one is in doubt then one can get body composition (percent fat) evaluated.
I think people with the best practical knowledge (from lifespan increasing interventions) for that would be:
Matt Kaeberlein (Wormbot)
Richard A Miller (NIA ITP)
Jan Gruber (Wormbot)
Brian Kennedy
The longest lived mice ever didn’t get any of their biomarkers checked - in some studies, mice had “better” biomarkers from some supplements and still didn’t live any longer.
With Rapamycin, they had “worse” biomarkers (glucose, cholesterol) and still lived longer