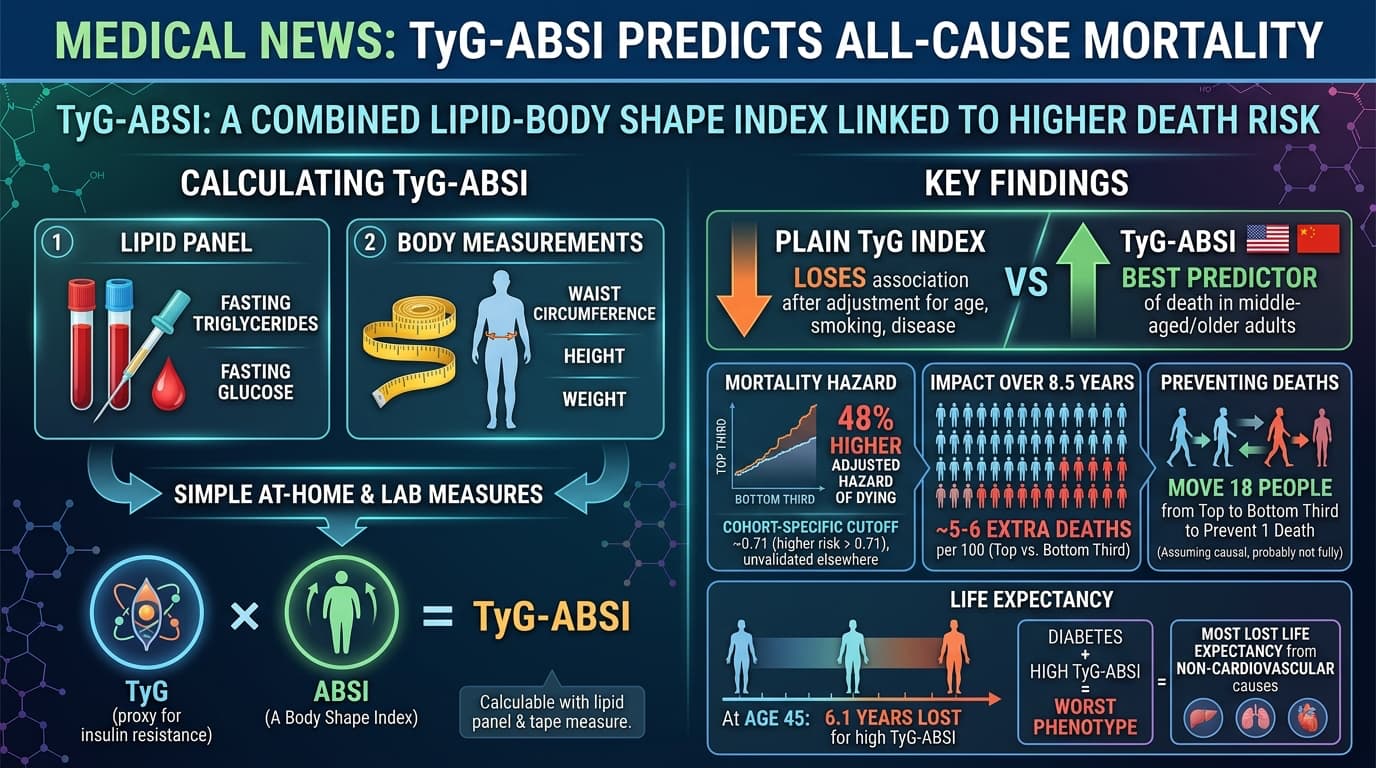
Chinese researchers ran a head-to-head contest between nine variations of the triglyceride-glucose (TyG) index, a cheap blood-based proxy for insulin resistance, to see which one best predicts death in middle-aged and older adults. Using 11,787 US adults from NHANES with mortality follow-up through 2019, plus an independent Chinese cohort of 12,915 people, they found that the plain TyG index lost its association with all-cause mortality once age, smoking, and existing disease were accounted for. The winner was TyG-ABSI, which multiplies TyG by A Body Shape Index, a measure of waist circumference adjusted for height and weight. People in the top third of TyG-ABSI had roughly 48% higher adjusted mortality hazard than those in the bottom third, and life-table modelling put the gap in remaining life expectancy at age 45 at about 6.1 years. The combination of diabetes plus high TyG-ABSI was the worst phenotype. Notably, most of the lost life expectancy came from non-cardiovascular causes.
For about a decade the triglyceride-glucose index has been sold as the poor man’s insulin clamp. Multiply your fasting triglycerides by your fasting glucose, take a logarithm, and you get a number that tracks insulin resistance well enough to be useful without the cost and hassle of a proper metabolic study. It appears in thousands of papers. It correlates with heart attacks, strokes, and fatty liver. Clinics have started quoting it back to patients.
This study asks a blunter question. Does it predict whether you die?
The research team pooled ten survey cycles of NHANES, the long-running US health survey, and followed 11,787 adults aged 45 and over for an average of about eight and a half years. In that time 2,604 died, 830 of them from cardiovascular causes. They then built nine different versions of the TyG index, each one pairing the blood chemistry with a different body measurement: body mass index, waist circumference, waist-to-height ratio, body roundness, conicity, relative fat mass, and so on. All nine went into the same statistical models, in the same population, at the same time. That comparison had not been done before.
The plain TyG index did not survive. Once the models accounted for age, sex, education, income, smoking, drinking, blood pressure medication, and a list of existing conditions, TyG on its own showed no relationship with dying from any cause. Its link to cardiovascular death was weak and disappeared entirely when people were sorted into thirds.
What survived was body shape. The version combining TyG with A Body Shape Index, a formula that isolates how much waist you carry relative to what your height and weight would predict, held up across every group tested. So did versions built on weight-adjusted waist index and conicity index. The versions built on BMI did the opposite of what you would expect, with higher scores predicting lower mortality, a pattern the authors attribute to the obesity paradox and which is more likely a signasl that sick elderly people lose weight before they die.
The size of the gap is the part worth sitting with. Using period life tables, the researchers estimated remaining life expectancy at age 45 for people in the top and bottom thirds of each index. For TyG-ABSI the difference was 6.15 years. For plain TyG it was 3.3 years. Among people with diabetes and a high score, the gap widened to about 5.1 years within that group alone.
Then comes a result the authors underplay. When they decomposed the life expectancy gap by cause of death, cardiovascular disease accounted for only 27.7% of it. The remaining 72.3% came from everything else, principally cancer and other non-cardiac causes. A marker built out of triglycerides, glucose, and waist size is apparently tracking something broader than heart disease.
The authors are careful about what this does not show. Nobody has demonstrated that lowering TyG-ABSI extends anyone’s life. The study measured no biology at all: no mitochondrial function, no inflammatory cytokines, no oxidative stress. It is a risk marker that performed well in a bake-off against eight competitors, validated in a second country, and nothing more than that yet.
Actionable Insights
The practical message is about where fat sits, not how much you weigh.
TyG-ABSI is calculable at home from a lipid panel and a tape measure. You need fasting triglycerides, fasting glucose, waist circumference, height, and weight. In this cohort the cutoff separating higher from lower risk landed around 0.71, though that number was derived from the data itself and has not been validated elsewhere.
How large is the effect? People in the top third of TyG-ABSI had a 48% higher adjusted hazard of dying than those in the bottom third. Translated into people rather than ratios, that works out to roughly 5 to 6 extra deaths per 100 people over about eight and a half years, meaning you would need to move about 18 people from the top third to the bottom third to prevent one death, assuming the relationship is causal. It probably is not fully causal. The life expectancy gap at age 45 was 6.1 years.
For scale, the standardised difference in TyG-ABSI between those who died and those who lived was a Cohen’s d of 0.41, a small-to-moderate separation. Age had a d of 1.11 in the same table. Your birthday still predicts your death far better than your waist does.
What is modifiable here: fasting triglycerides, fasting glucose, and visceral fat. All three respond to the usual interventions.
Context and Source
- Open Access Paper: Nine anthropometric insulin resistance indices predict mortality and life expectancy across glucose states
- Institutions: Anhui Medical University (Department of Neurology, Hefei), with Nanjing Medical University, Nanjing University Medical School, Harbin Medical University, Anhui Normal University, Anhui Provincial Hospital, and Fuwai Hospital (Chinese Academy of Medical Sciences and Peking Union Medical College)
- Country: China (data sources: United States via NHANES, China via CHARLS)
-
Journal: iScience (Cell Press / Elsevier), accepted 14 August 2026.
Impact evaluation: iScience carries a 2025 Journal Impact Factor of 4.5 and a CiteScore of 7.4, ranked Q1 in Multidisciplinary Sciences. The impact score of this journal is 4.5, evaluated against a typical high-end range of 0 to 60+ for top general science journals, therefore this is a Medium impact journal.