Agreed about epigenetic tests. This was cristslized for me in the latest Attia roundtable : if I compare the results of a complete metabolic panel with an epigenetic test, which one is more actionable? At least from a clinical POV, these tests are like setting money on fire.
4 Likes
These clocks are all for the most part useless. Give it up gang.
6 Likes
The people on the leaderboard of Rejuvenation Olympics avoiding taking the tests on bad days is all I need to know about the validity of the current tests.
4 Likes
DNA methylation is just one measure of epigenetic age, and there’s no reason to think it’s the ‘best’ one. Even if rapamycin doesn’t appreciably change the dynamics of DNA methylation (still an assumption, as this might only be the case in blood, for example), it might alter epigenetic age according to some other measure (e.g histone modifications, occupancy of nucleosomes or transcription factors, how ‘open’ certain regions of chromatin are, etc).
That said, this is still an area of basic research and acting like the consumer DNA methylation tests have clinical validity is ridiculous.
4 Likes
I tried Rapamycin at a low weekly dose. After using 100mgs of it I stopped it because of bad side effects and lipid tests that were not good. I see that Bryan Johnson has stopped taking it. I think that on balance it is harmful and does not slow aging in humans.
I would not necessarily follow what Bryan Johnson does, there are many problems with his rational for stopping rapamycin. I recommend you review this thread… Bryan Johnson stops rapamycin
3 Likes
Its an easy question.
1st table is for a seriously ill persons. Fast and reliable effect. Even Unicaria Tomentosa (Cat’s claws or smthng) is a very potent immunomodulator. Not to mention anti-arthritis or metformin for diabetics.
2nd column, opposite, makes benefits for relatively healthy persons, with relatively mild or non-existent (comparatively-to-life-long-short-statistically-speaking). So it hadn’t shown great impact inside any 1-2-3 year’s long researches.
Really, Omega - it can give benefits if taken decades…
1 Like
And one more thing…
Mathematically, you MUST measure only lifespan if you want to measure some lifespan.
Its not as ridiculous as in sounds.
Just pretend that you made a drug, which immediately after first dosage put your pulse to 150, BP to 200/120 - but you will live 300 years. (for modelling purposes always beneficial to imagine something beyond limitations)
Will it be any sense to measure blood pressure as a “biomarker” then?
Doesn’t matter what numbers are telling opposite to real life of mormosettes.
Give them anti-arthritis therapy and show us +15% increase of the lifespan. Then thoroughly tune your epiclocks to this result.
1 Like
https://www.nature.com/articles/s41591-026-04562-9
There also a linked commentary behind a paywall from Steve Horvath
https://www.nature.com/articles/s41591-026-04524-1
chatGPT(5.6paid):
Overall assessment
This is a valuable large-scale benchmarking study of how DNA-methylation biomarkers respond to putative longevity interventions. Its chief contribution is not evidence that any particular intervention slows ageing, but the creation and standardized analysis of TranslAGE: 51 longitudinal studies, 3,128 blood samples, 16 major epigenetic clocks and 94 additional methylation-derived biomarkers.
The most defensible conclusion is:
Some second-generation, technically reliable methylation biomarkers—particularly DunedinPACE and PCGrimAge—change more consistently after interventions than first-generation chronological-age clocks.
The paper does not establish that those changes represent slowed ageing, improved healthspan or extended lifespan.
1. Summary
Study objective
Epigenetic clocks are frequently proposed as short-term surrogate endpoints for longevity trials. But a biomarker must do more than predict mortality: it must also respond reproducibly when an intervention changes the underlying ageing process.
The authors therefore asked:
- Which epigenetic clocks are most responsive to interventions?
- Which types of intervention produce the largest methylation changes?
- Are responses reproducible across related studies and clocks?
- Do population characteristics affect responsiveness?
- Can “explainable” or system-specific biomarkers indicate what biology is changing?
Dataset and analysis
The authors assembled 51 longitudinal intervention datasets containing pre- and post-intervention blood methylation measurements. These included:
- lifestyle interventions, such as diets and exercise;
- pharmacological interventions, including metformin, anti-TNF treatment, rapamycin, semaglutide and ketamine;
- supplements;
- medical procedures, including transplantation and hyperbaric oxygen.
They calculated more than 110 methylation biomarkers with a consistent computational pipeline. Sixteen broadly applicable ageing clocks were used for the principal comparisons.
Biomarker values were:
- residualized against chronological age;
- divided by an external reference standard deviation to produce standardized effect sizes;
- compared before and after treatment using paired tests.
Principal findings
Second-generation reliable clocks were most responsive
Mortality- and pace-of-ageing clocks generally changed more consistently than first-generation chronological-age clocks.
The strongest performers were:
- DunedinPACE: the broadest apparent sensitivity and the largest average response;
- PCGrimAge: the strongest overall statistical evidence;
- GrimAgeV2, PCPhenoAge and SystemsAge: also relatively responsive.
DunedinPACE decreased significantly in 16 interventions and increased in only one. It also never significantly disagreed in direction with the other clocks, although in some studies it was the only significant clock.
By contrast, Horvath, Hannum and related first-generation clocks showed sporadic increases and decreases without a consistent overall pattern. The principal-component versions of several clocks were generally more consistent than the original versions, supporting the importance of technical reliability.
Pharmacological interventions produced the largest average changes
Pharmacological interventions produced larger standardized reductions than lifestyle, supplement or procedural categories. Lifestyle interventions also produced an average reduction, but of smaller magnitude.
Anti-TNF treatment and metformin generated some of the strongest patterns. Mediterranean-diet studies showed comparatively consistent changes across studies.
However, the authors appropriately state that this comparison concerns biomarker responsiveness, not comparative clinical efficacy.
Nineteen interventions produced aggregate decreases
Across the 16 clocks:
- 19 interventions produced nominally significant aggregate decreases;
- 13 remained significant after the authors’ multiple-testing correction;
- 5 produced increases, of which 3 survived correction;
- 26 produced no significant aggregate effect.
The paper does not provide grounds for interpreting every significant reduction as rejuvenation.
Health status strongly affected responsiveness
Clocks generally changed more in populations with diagnosed disease than in healthier populations.
PCPhenoAge, SystemsAge, GrimAgeV2 and PCGrimAge showed particularly large responses in disease cohorts. DunedinPACE was unusual in responding comparatively similarly in healthy and disease populations.
This could reflect:
- more biological dysfunction available to reverse;
- regression to the mean;
- treatment of an active disease process;
- the populations and outcomes used to train the clocks.
Different clocks responded to different intervention classes
DunedinPACE was particularly responsive to lifestyle interventions, whereas GrimAgeV2 and PCGrimAge were more responsive to pharmacological interventions.
This argues against treating all clocks as interchangeable measures of a single latent “biological age”.
Explainable biomarkers offered apparent biological specificity
SystemsAge, OMICmAge and their component measures indicated system-specific responses. Examples included:
- smoking cessation → strongest apparent lung response;
- metformin → inflammatory, metabolic and brain components;
- gastric bypass → metabolic component;
- vegan diet → inflammatory and musculoskeletal components.
Across seven dietary interventions, musculoskeletal SystemsAge declined in all seven, while inflammation and metabolic components responded in six. Methylation proxies for triglycerides were responsive in six diets.
Structured versus stochastic methylation change
First-generation Horvath age changes correlated with their estimated stochastic component, whereas PhenoAge changes showed little relationship to its stochastic component.
The authors interpret this as evidence that second-generation biomarkers preferentially capture structured, biologically directed changes rather than random methylation drift.
That is an interesting observation, but “nonstochastic” does not necessarily mean “causal ageing”.
2. What is genuinely novel?
The main novelty: standardized cross-study recalculation
Previous intervention papers generally selected their own preferred clocks. This creates a fragmented and publication-biased literature in which one cannot tell whether discordant results arise from the intervention, the population or selective biomarker reporting.
The authors instead recalculate the same large biomarker panel across all accessible datasets. This permits something close to a head-to-head comparison of clocks.
That is the paper’s strongest and most useful innovation.
TranslAGE as an infrastructure contribution
The harmonized TranslAGE database is itself an important research product. If maintained and expanded, it could support:
- prospective biomarker selection;
- power calculations;
- replication analysis;
- comparison of newly developed clocks;
- eventual validation against clinical outcomes.
Joint analysis of responsiveness, reliability and concordance
The paper distinguishes three properties that are often conflated:
- whether a biomarker changes;
- whether it changes consistently with other biomarkers;
- whether technically more reliable versions behave better.
The finding that principal-component and updated clocks generally outperform their originals provides useful empirical guidance for trial design.
Intervention-dependent biomarker selection
The demonstration that lifestyle and pharmacological interventions are optimally detected by somewhat different clocks is novel and practically important. It challenges the idea that one universal clock should serve every intervention.
Incorporation of explainable component scores
The systematic comparison of whole-body clocks with organ-, pathway-, protein- and metabolite-related methylation scores is more informative than reporting a single number called biological age.
It suggests a possible future trial architecture:
- one robust global ageing measure;
- several intervention-relevant system scores;
- conventional biochemical and functional outcomes.
Population health as an explicit effect modifier
The systematic demonstration that diseased cohorts yield larger clock responses is important. It implies that a clock’s apparent responsiveness cannot be separated from the population in which it is tested.
3. Critique
A. Responsiveness is not surrogate validity
This is the central conceptual limitation.
A useful surrogate must satisfy at least three distinct conditions:
- it predicts a clinically meaningful outcome;
- an intervention changes it;
- the intervention-induced change predicts the intervention’s effect on that clinical outcome.
This paper primarily tests condition 2. It does not demonstrate condition 3.
A clock might fall after treatment because it detects:
- reduced inflammation;
- altered blood-cell composition;
- improved glucose or lipid metabolism;
- reversal of a disease state;
- a direct pharmacological effect on methylation;
- a technical or sampling effect.
None of these necessarily means that the rate of organismal ageing has slowed.
The correct description is therefore responsive biomarker, not validated surrogate endpoint.
B. The study largely treats pre–post change as the intervention effect
The analysis uses paired pre- versus post-intervention comparisons, even though some source studies apparently contained control groups.
A pre–post difference can be caused by:
- secular change;
- seasonal variation;
- acute illness or recovery;
- altered medication;
- regression to the mean;
- repeated sampling or batch effects;
- natural ageing during follow-up.
For randomized studies, the appropriate causal estimand is normally the difference in change between intervention and control groups, preferably with baseline adjustment—not whether the intervention arm alone changed significantly.
This is probably the paper’s most important statistical weakness. A reanalysis restricted to randomized controlled trials, using treatment-by-time effects, would be much more persuasive.
C. Correlated clocks are repeatedly treated as observations
Several analyses test whether the collection of 16 clock effect sizes for one intervention differs from zero. But those clocks are strongly correlated, share CpGs, share training outcomes and sometimes derive from one another.
Consequently, the effective sample size is much smaller than 16. Treating clock values as if they were independent can generate overly small P values.
The paper acknowledges correlation when discussing multiple testing, but that does not fully solve the deeper problem of pseudoreplication. A hierarchical model should explicitly represent:
- participants nested within studies;
- clocks nested within biomarker families;
- interventions nested within categories;
- covariance among clocks.
D. Pooling selected “longevity” interventions creates directional circularity
The database includes interventions because they have been hypothesized to improve longevity or healthspan. The authors then ask whether, pooled together, their clocks tend to decrease.
That selection makes an average downward direction less surprising. It does not independently validate either the interventions or the clocks.
A stronger design would include:
- treatments known to improve health but not ageing;
- biologically neutral interventions;
- harmful exposures;
- treatments producing acute inflammation;
- interventions with known long-term mortality effects in opposite directions.
The paper includes some controls and “pro-ageing events”, which is helpful, but the overall intervention set remains selected around a presumed anti-ageing direction.
E. Intervention-category comparisons are heavily confounded
The claim that pharmacological interventions produce larger responses does not establish that drugs are intrinsically more geroprotective.
The pharmacological group disproportionately includes:
- patients with active disease;
- interventions treating inflammation or metabolic dysregulation;
- populations with high baseline abnormality;
- potentially different study durations and sample-processing practices.
Because diseased populations themselves show larger clock responses, the pharmacological advantage may partly reflect population composition rather than intervention class.
The authors use univariate study-level regressions, but these cannot adequately disentangle correlated study characteristics. With only 51 heterogeneous studies—and only 10 disease studies—multivariable conclusions remain fragile.
F. Disease improvement may be mistaken for ageing reversal
Anti-TNF treatment provides the clearest example. Reducing systemic inflammation in inflammatory bowel disease or arthritis will predictably alter:
- leukocyte populations;
- CRP-associated biology;
- methylation proxies trained on inflammatory and mortality-related variables.
A fall in GrimAgeV2 or SystemsAge could therefore mean “less active inflammatory disease”, which is clinically beneficial, without demonstrating a change in the fundamental rate of ageing.
Indeed, the strong responsiveness of generation-2 clocks may arise precisely because they contain proxies for modifiable risk factors. That makes them sensitive clinical-state markers, but not necessarily deeper measures of ageing.
G. Blood-cell composition remains a difficult confounder
The authors report that responsiveness largely persisted after regression of methylation-inferred cell fractions. This is reassuring but not decisive.
Inferred fractions:
- are themselves calculated from methylation;
- incompletely represent immune-cell subtypes and activation states;
- may remove genuine biology or fail to remove compositional confounding;
- cannot substitute for measured flow-cytometric counts.
This is particularly important for anti-inflammatory drugs, transplantation, smoking cessation and disease recovery.
H. “Explainable” does not necessarily mean mechanistic
A methylation score trained to predict a protein, metabolite or organ-related phenotype is not a direct measurement of that molecule or organ.
For example, a methylation-derived “brain” or “kidney” score measured in blood could reflect systemic correlates of those systems rather than biological change inside the brain or kidney.
Thus the organ-system results are best described as hypothesis-generating signatures, not evidence that metformin rejuvenated the brain or hyperbaric oxygen rejuvenated the lung.
They require validation against:
- measured metabolites and proteins;
- organ function;
- imaging;
- tissue-specific molecular assays;
- clinical outcomes.
I. Significance and concordance are partly circular
The authors regard agreement among clocks as evidence that a finding is bona fide. But related clocks may agree because they share:
- CpGs;
- training datasets;
- mortality-related inputs;
- immune and inflammatory signals.
Agreement among correlated instruments is not equivalent to independent replication.
Conversely, disagreement need not mean that one result is false: two clocks may genuinely measure different biological constructs. The paper partly recognizes this, particularly in the intervention-category analysis, but its “rules” for bona fide effects sometimes overstate what concordance can establish.
J. The stochastic/causal terminology is stronger than the evidence
A reproducible, structured methylation change is not automatically causal in ageing. It may be:
- downstream of disease;
- compensatory;
- environmentally induced;
- a stable correlate of another process.
Similarly, DamAge and AdaptAge are model-derived constructs, not experimental demonstrations that particular methylation sites cause damage or adaptation. The paper’s longitudinal results support differential responsiveness of these components, but not their causal interpretation.
K. Multiple testing remains debatable
The authors estimate an effective number of independent tests using PCA and argue that conventional correction would be excessively conservative.
That can be reasonable, but concerns remain:
- numerous related analyses and subgroup comparisons are performed;
- the effective-test framework does not eliminate researcher degrees of freedom;
- nominal results are discussed even when they fail correction;
- normality is assumed for one-sample tests over sometimes small and heterogeneous sets of study effects.
A permutation framework or hierarchical false-discovery model would be more convincing.
L. Reproducibility is incomplete
The open MethylCIPHER code and TranslAGE resource are strengths. However:
- some private TruDiagnostic datasets require controlled access;
- OMICmAge and DNAmEMRAge calculation involves restricted/request-based components;
- several investigators have financial or intellectual-property relationships involving TruDiagnostic or SystemsAge.
These interests do not invalidate the findings, but independent replication using fully public datasets and independently implemented clocks is especially important.
4. What the paper establishes—and what it does not
| Reasonably supported | Not established |
|---|---|
| Reliable second-generation clocks are more responsive than first-generation clocks | That lowering a clock slows ageing |
| DunedinPACE and PCGrimAge are promising trial biomarkers | That either is a validated surrogate endpoint |
| Different interventions affect different methylation constructs | That one intervention is superior for longevity |
| Disease status strongly modifies measured responsiveness | That large responses in disease represent rejuvenation |
| Component scores can generate mechanistic hypotheses | That blood-derived organ scores measure rejuvenation within those organs |
| Anti-TNF and Mediterranean-diet effects show useful reproducibility | That these methylation changes mediate healthspan or lifespan benefits |
Bottom line
This is an important biomarker-comparison and research-infrastructure paper, rather than a validation of epigenetic clocks as measures of rejuvenation.
Its most useful practical recommendation is to avoid old chronological-age clocks as primary endpoints and instead use a prespecified portfolio containing:
- DunedinPACE or PCGrimAge;
- an intervention-relevant explainable/system score;
- measured physiological and functional outcomes;
- a randomized control group.
The decisive next study would test whether randomized treatment-induced clock changes predict subsequent changes in multimorbidity, frailty, function or mortality—and whether they statistically mediate the treatment’s clinical benefit. Until that is shown, these clocks should be treated as responsive molecular indicators, not as proof that biological ageing has been reversed.
what does it say about rapamycin
The paper includes rapamycin as one of the pharmacological interventions, but it does not present rapamycin as one of its strongest or most convincing findings.
What it reports is essentially that:
- Rapamycin was included among the 51 longitudinal interventions analysed.
- Its effects were assessed across the same panel of 16 principal epigenetic clocks.
- It produced changes in some methylation biomarkers, but the response was not as broad or consistent as that seen with anti-TNF therapy or metformin.
- The authors therefore do not single out rapamycin as an intervention with a clearly reproducible epigenetic “rejuvenation” effect.
- Rapamycin contributes to the general finding that pharmacological interventions, taken as a category, produced larger methylation changes than lifestyle, supplement or procedural interventions.
Importantly, the paper is not testing whether rapamycin improves healthspan clinically. It is testing whether methylation clocks change after intervention. Therefore, even if individual rapamycin-associated clocks decreased, this would show only biomarker responsiveness—not that rapamycin reversed ageing.
The paper’s broader message is especially relevant to rapamycin trials: the result depends heavily on which clock is selected. A rapamycin study reporting one favourable clock while other reliable second-generation clocks remain unchanged would be weak evidence and could represent a chance or clock-specific effect. A stronger future rapamycin trial should prespecify DunedinPACE, PCGrimAge and relevant system-specific biomarkers, while also measuring function, inflammation, metabolism and adverse effects against a randomized control group.
I have not checked this response as I don’t myself worry too much about epigenetic clock results, but I uploaded the supplementary tables and asked:
given the supplementary tables what is the detailed result on rapamycin by dose
The supplementary tables show an unfavourable dose-related pattern: “rapamycin dose 1” produced no overall change, whereas “rapamycin dose 3” significantly increased—rather than decreased—the aggregate epigenetic-age signal.
Results by dose
Positive effect sizes mean movement towards greater epigenetic age; negative values mean apparent age reduction.
| Clock | Dose 1 | Dose 3 |
|---|---|---|
| Horvath1 | +0.064 | −0.090 |
| Horvath2 | +0.210 | +0.178 |
| Hannum | +0.005 | +0.251 |
| PC-Horvath1 | −0.009 | +0.045 |
| PC-Horvath2 | −0.081 | −0.002 |
| PC-Hannum | −0.004 | +0.125 |
| DNAmEMRAge | +0.240* | +0.006 |
| OMICmAge | +0.080 | +0.018 |
| PhenoAge | +0.040 | −0.009 |
| GrimAgeV1 | −0.046 | +0.229* |
| GrimAgeV2 | −0.040 | +0.218* |
| PC-PhenoAge | −0.009 | +0.115 |
| PC-GrimAge | −0.098 | +0.044 |
| SystemsAge | −0.016 | +0.037 |
| DunedinPoAm38 | −0.006 | +0.137 |
| DunedinPACE | +0.059 | +0.109 |
| Mean across 16 clocks | +0.0243 | +0.0883 |
| One-sample test | P = 0.3088 | P = 0.0026 |
| 95% CI | −0.0249 to +0.0736 | +0.0362 to +0.1404 |
*Nominally significant individual pre–post result according to Supplementary Table 4; the supplied table does not give its exact individual P value.
Dose 1
The aggregate result was:
- mean standardized change: +0.0243;
- 95% CI: −0.0249 to +0.0736;
- (t(15)=1.054);
- P = 0.3088.
Therefore, dose 1 produced no statistically detectable overall change across the 16 clocks.
There was one nominally significant individual result:
- DNAmEMRAge increased by +0.240.
All other clocks were nonsignificant. Several reliable second-generation clocks moved slightly favourably—PCGrimAge −0.098, PC-Horvath2 −0.081 and GrimAgeV2 −0.040—but none was individually significant.
This is therefore best interpreted as a null result with one isolated adverse signal, not evidence of epigenetic rejuvenation.
Dose 3
The aggregate result was:
- mean standardized change: +0.0883;
- 95% CI: +0.0362 to +0.1404;
- (t(15)=3.610);
- P = 0.0026;
- partial (\eta^2=0.465).
Thus, the set of clocks shifted significantly in the direction labelled by the paper as epigenetic-age acceleration.
Two individual clocks were nominally significant:
- GrimAgeV1: +0.229
- GrimAgeV2: +0.218
This is more concerning than an isolated first-generation-clock result because GrimAgeV2 is one of the reliable second-generation mortality-risk clocks that the paper otherwise recommends. In addition:
- DunedinPACE increased by +0.109;
- DunedinPoAm38 increased by +0.137;
- PCPhenoAge increased by +0.115;
- Hannum increased by +0.251;
- Horvath2 increased by +0.178.
These were not individually significant, but their broadly positive direction explains the significant aggregate result. Only Horvath1, PC-Horvath2 and PhenoAge moved slightly downwards.
What are “dose 1” and “dose 3” in milligrams?
A major reporting problem is that neither the supplied supplementary tables nor the main paper translates these coded labels into milligrams. They should not automatically be equated with the PEARL trial’s 5 mg and 10 mg arms.
The TranslAGE metadata identify them as small private retrospective datasets:
- dose 1: TruD29, nine individuals;
- dose 3: TruD31, seven individuals;
- weekly compounded rapamycin over approximately one year.
The current TranslAGE database also lists a “dose 2” dataset, TruD30 with eight individuals, but it is absent from the paper’s supplied effect-size tables. TranslAGE dataset explorer
That means the apparent dose response rests on extremely small samples, and the exact dose coding needs confirmation from the authors or underlying TruDiagnostic metadata.
Important statistical qualification
The aggregate P value is obtained by treating the 16 correlated clocks as the 16 observations in a one-sample t-test. It is not a participant-level dose-response test.
This is problematic because the clocks:
- are calculated from the same seven or nine people;
- share methylation sites and biological inputs;
- are strongly correlated;
- therefore do not constitute 16 independent replications.
Nor does the analysis appear to compare each dose with a contemporaneous placebo group. These are pre–post retrospective cohorts. Consequently, it cannot establish that rapamycin caused the increase, or that dose 3 was significantly worse than dose 1. A formal dose-by-time interaction was not reported.
Bottom line
Within these supplementary data:
- Dose 1: essentially neutral; no evidence of epigenetic age reduction.
- Dose 3: a statistically significant aggregate shift in the adverse direction, with significant increases in GrimAgeV1 and GrimAgeV2.
- Dose-response conclusion: suggestive of a higher-dose adverse signal, but not proven because the cohorts are tiny, non-randomized, apparently lack placebo comparisons, use undisclosed dose coding and were not directly compared statistically.
So the detailed result is not that rapamycin improved epigenetic ageing. If anything, the higher coded dose generated one of the paper’s adverse biomarker signals—but the analysis is too weak to infer that higher-dose rapamycin biologically accelerates ageing.
https://www.nature.com/articles/s41591-026-04562-9
(1) significantly decreasing epigenetic age in only a handful of generation 2 reliable clocks (smoking cessation—SystemsAge; umbilical cord blood transfusion—DunedinPACE and GrimAgeV2; metformin—SystemsAge, PCGrimAge and PCPhenoAge; hyperbaric oxygen therapy—DunedinPACE; Vegan Diet—DunedinPACE and SystemsAge; TruLacta supplement—DunedinPACE) or (2) not significantly decreasing epigenetic age in any generation 2 reliable clocks (gastric bypass) (Fig. 6b and Supplementary Table 18). The sporadic responsiveness of clocks to the first category of interventions may suggest they are false positives, whereas the lack of responsiveness in the second category may suggest they do not modify epigenetic age. However, we considered the possibility that these interventions simply had very specific effects that may not be detectable using a general aging clock. Accordingly, the SystemsAge components suggested these interventions may be impacting different systems (Fig. 6c, Extended Data Fig. 2 and Supplementary Table 18). For example, the two interventions that did not modify any general Gen 2 reliable clock do show significant decreases in epigenetic age of specific systems (gastric bypass decreases metabolic score with effect size 0.43). Other interventions include smoking cessation seeing maximal decrease in lung (0.20), umbilical cord transfusion in musculoskeletal (0.13) and hyperbaric oxygen therapy in lung (0.27). Although other systems saw multi-system decreases such as metformin with inflammation (0.80), brain (0.70) and metabolic (0.70) decreasing the most. In the vegan diet, the largest decrease was seen in inflammation (0.23) and musculoskeletal (0.17
examined how much of the change in each clock could be attributed to stochastic versus nonstochastic components. For example, we found that Horvath1 was strongly correlated with its stochastic component (R = 0.50), whereas PhenoAge showed almost no correlation with its own stochastic component (R = −0.06), suggesting that PhenoAge reflects more structured biological aging (Fig. 6f,g).
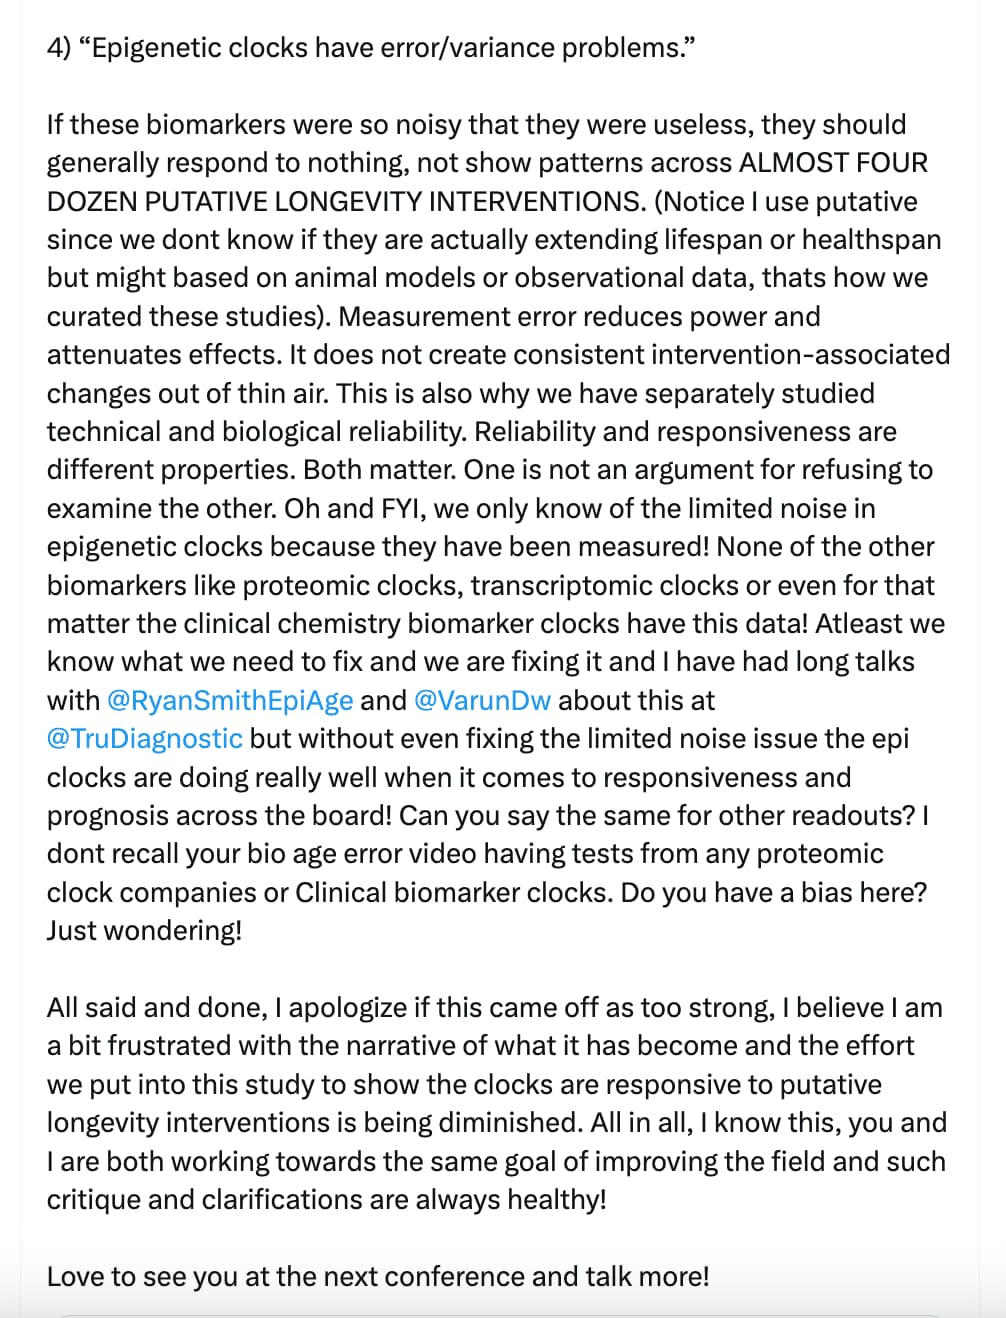
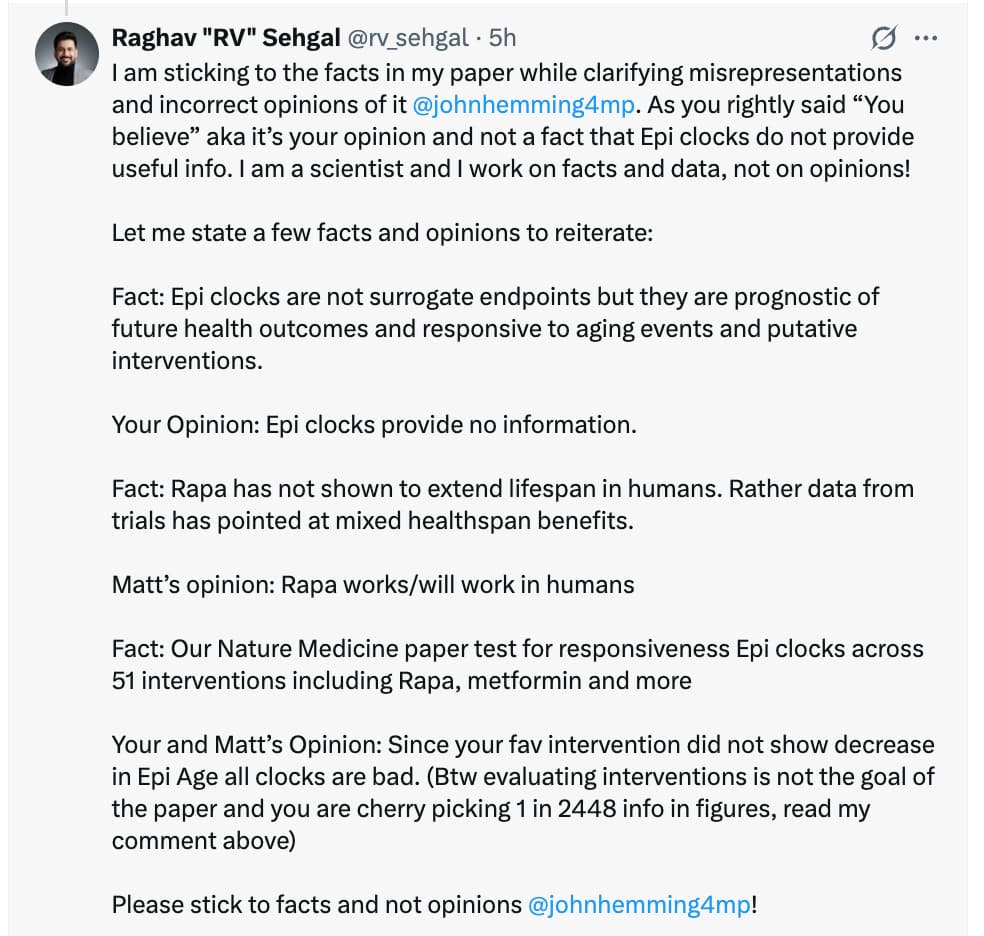
There has been a lot of discussion on X about this follow-on paper to the original BioRxiv pre-published paper. Much of the discussion earlier on the prepub paper still apply. Here are some of the recent comments:

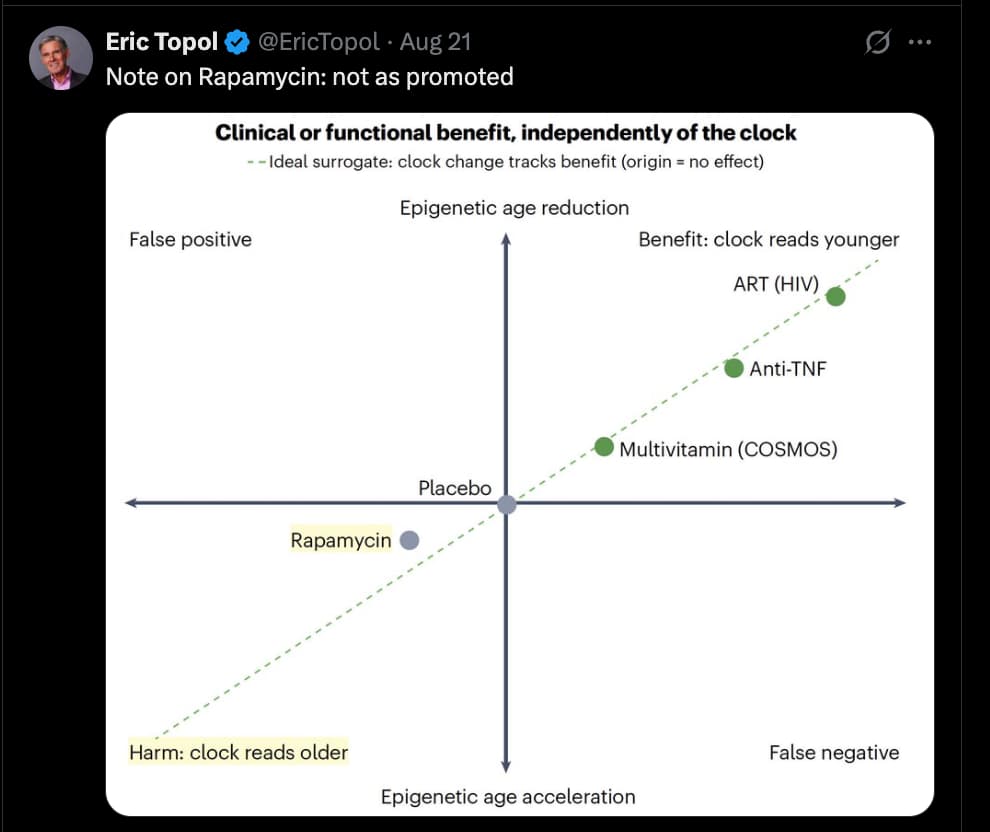

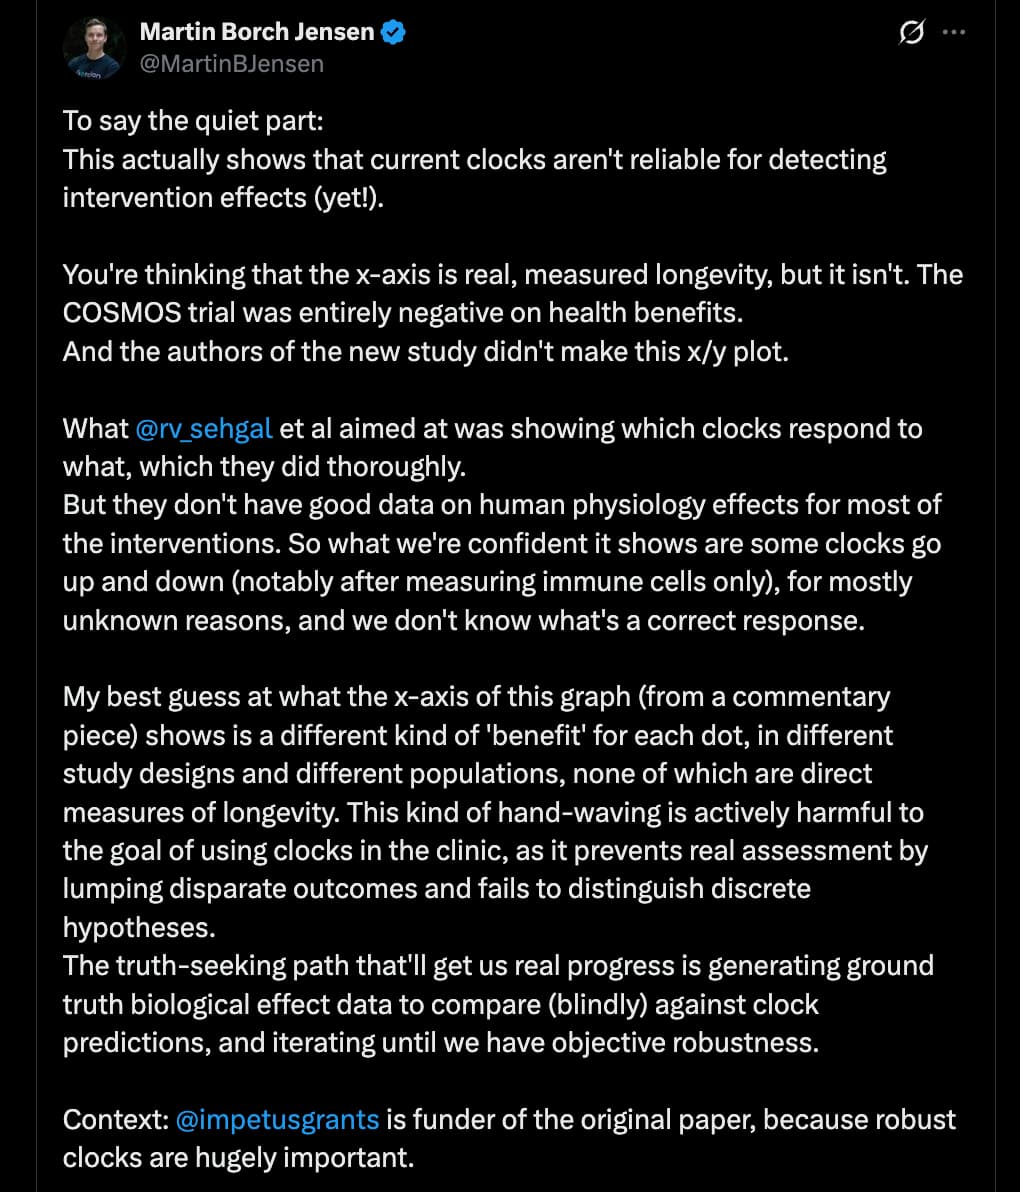
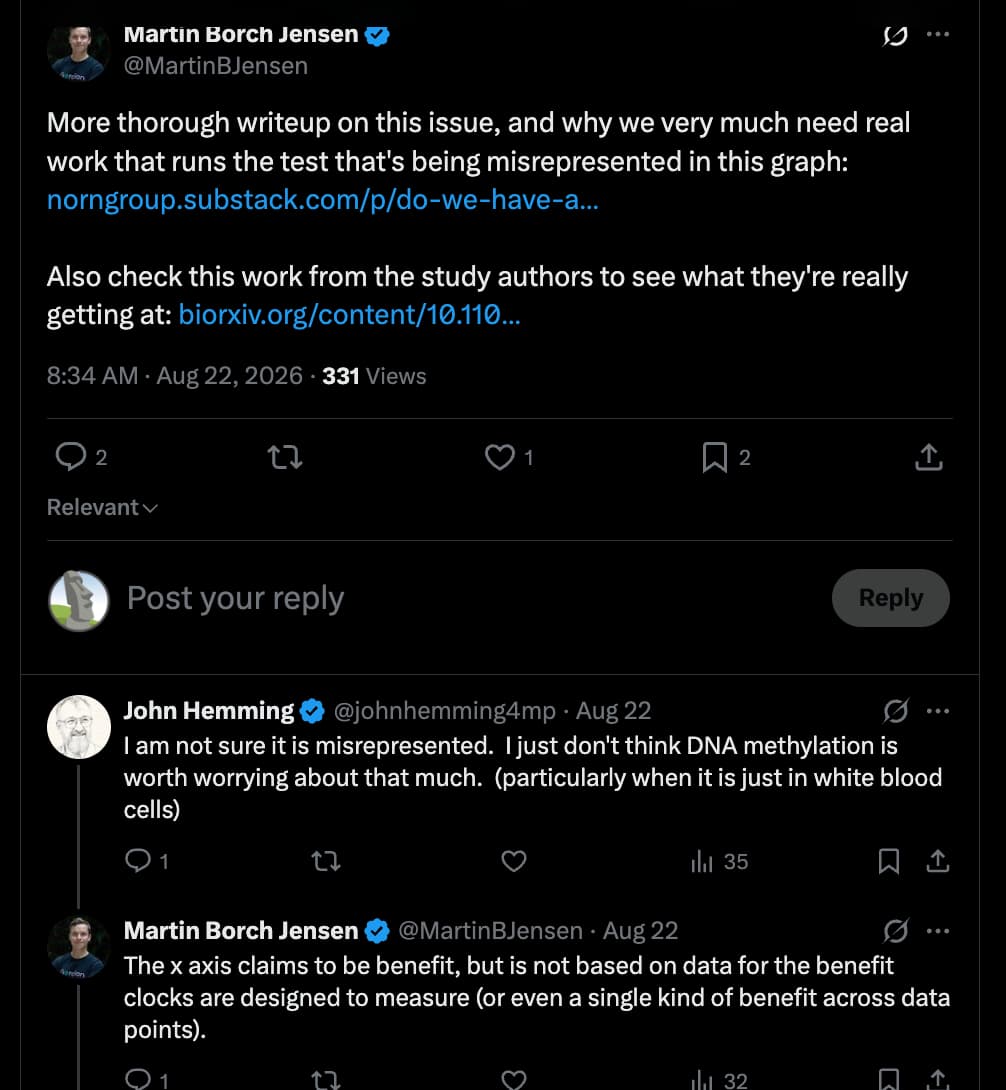
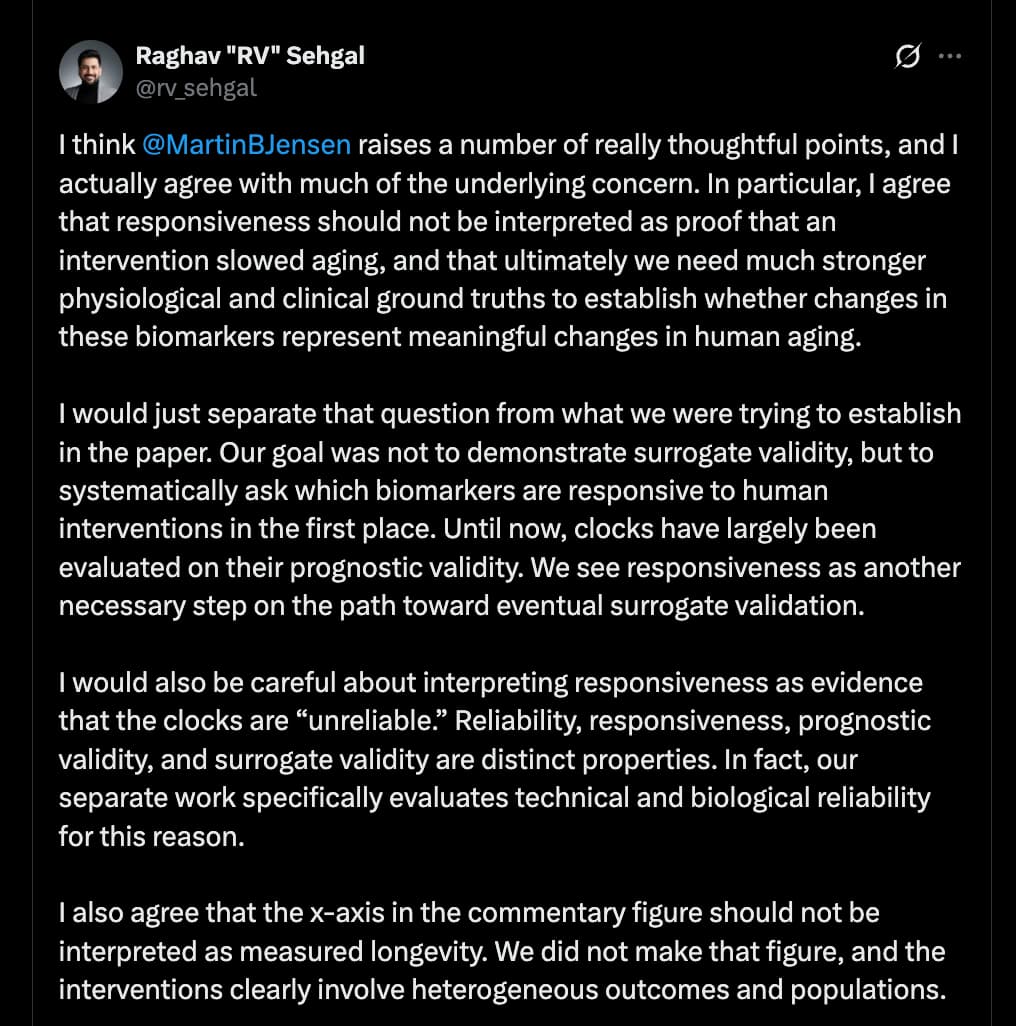
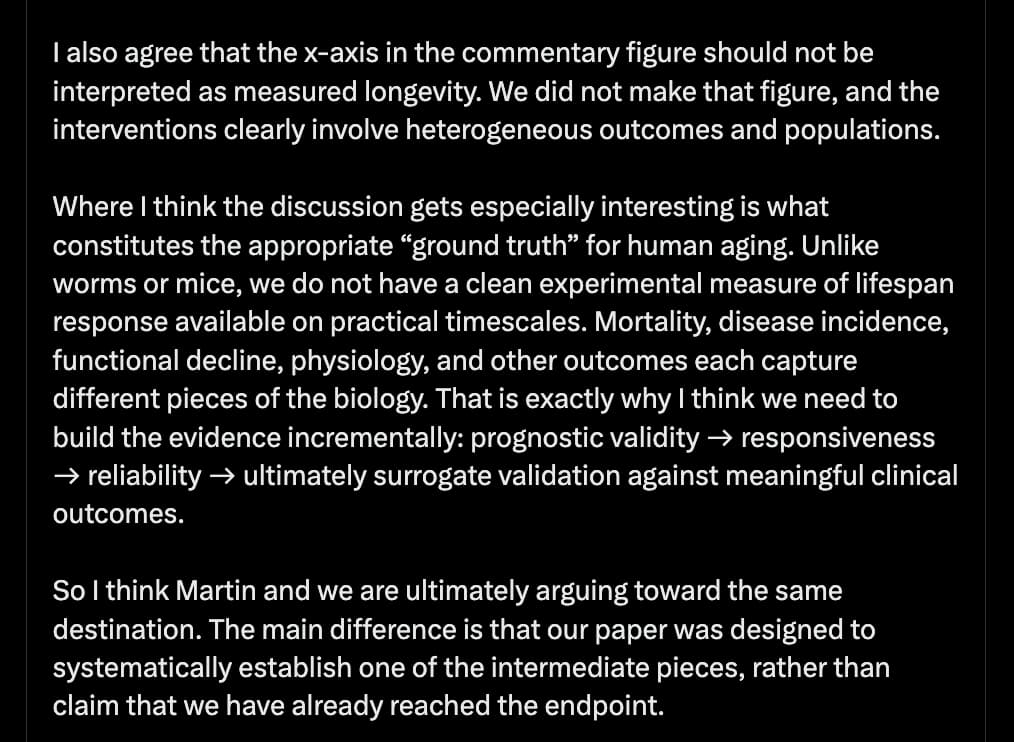
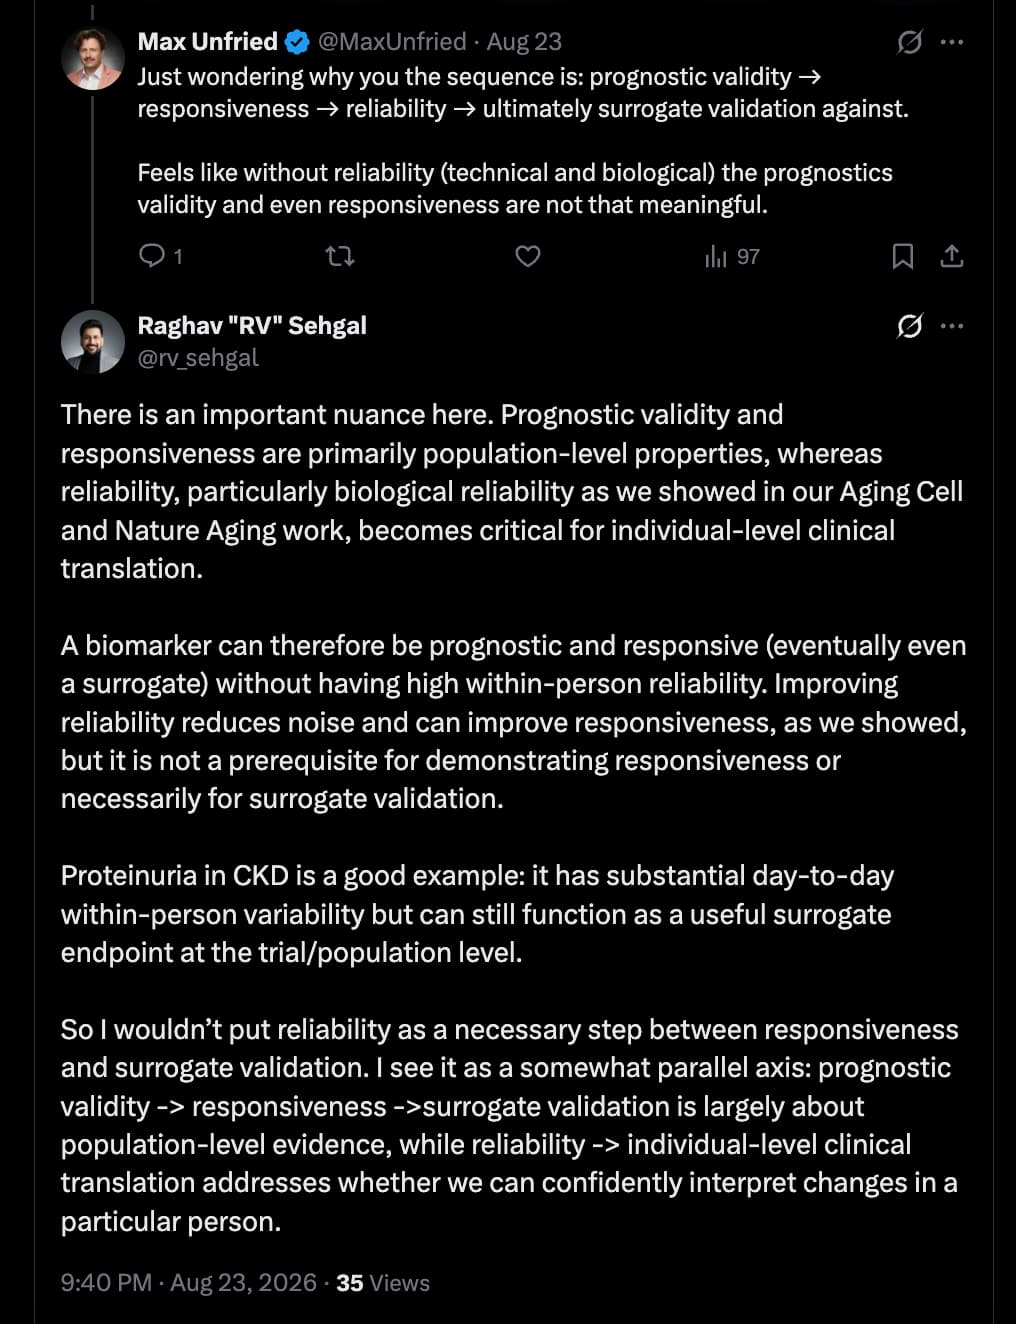
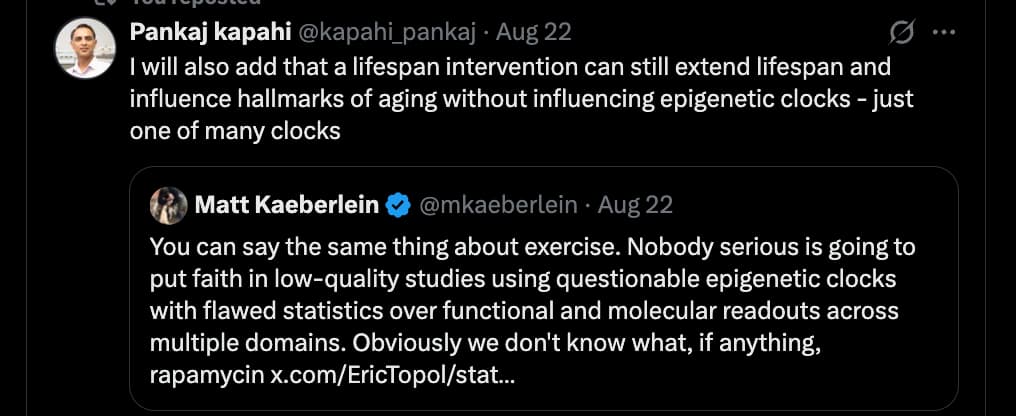
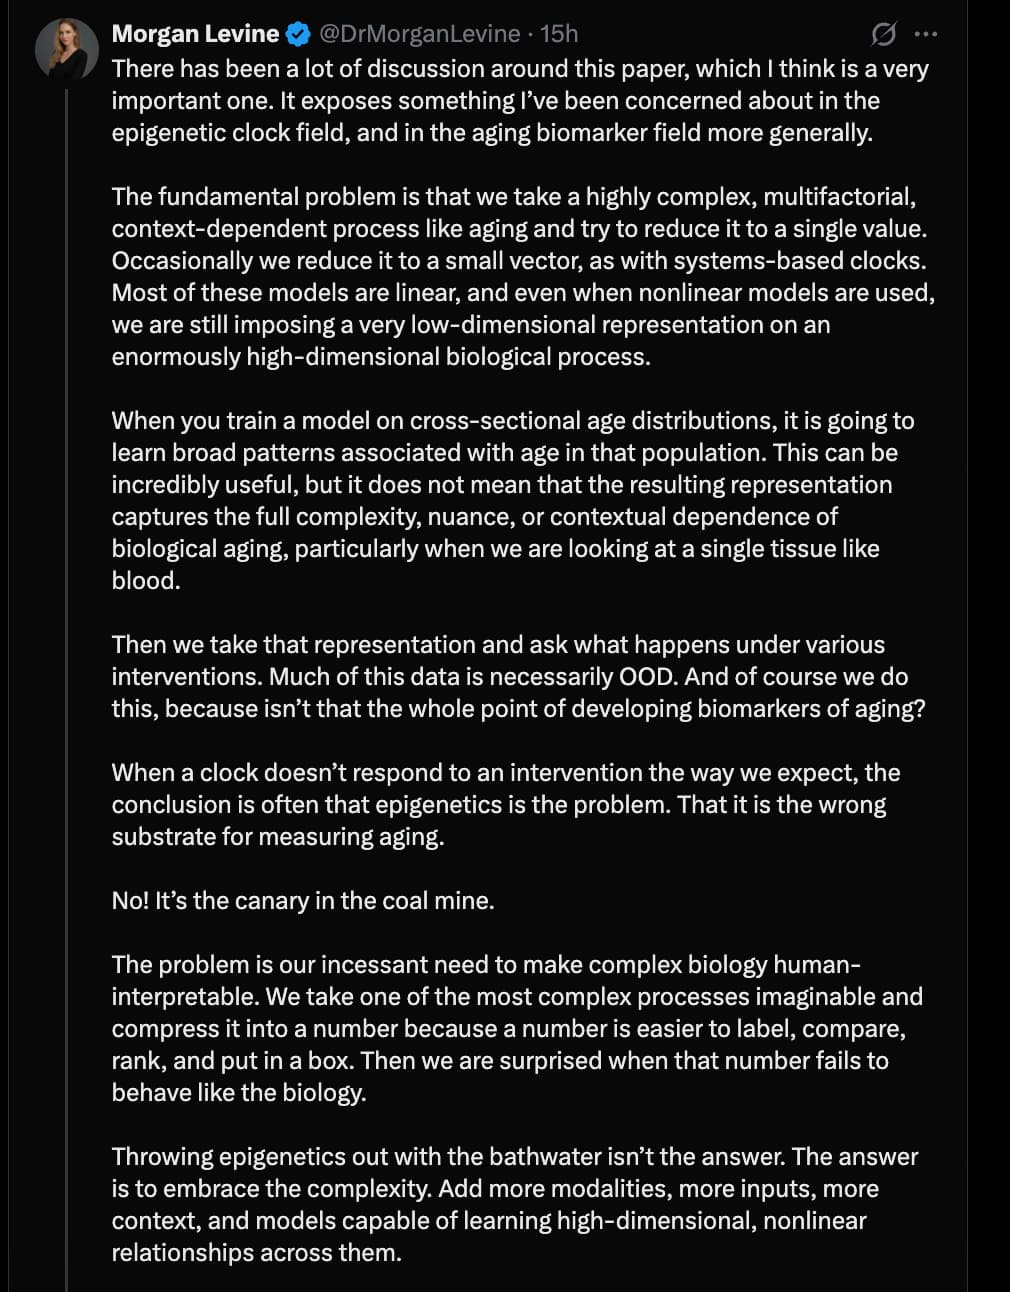

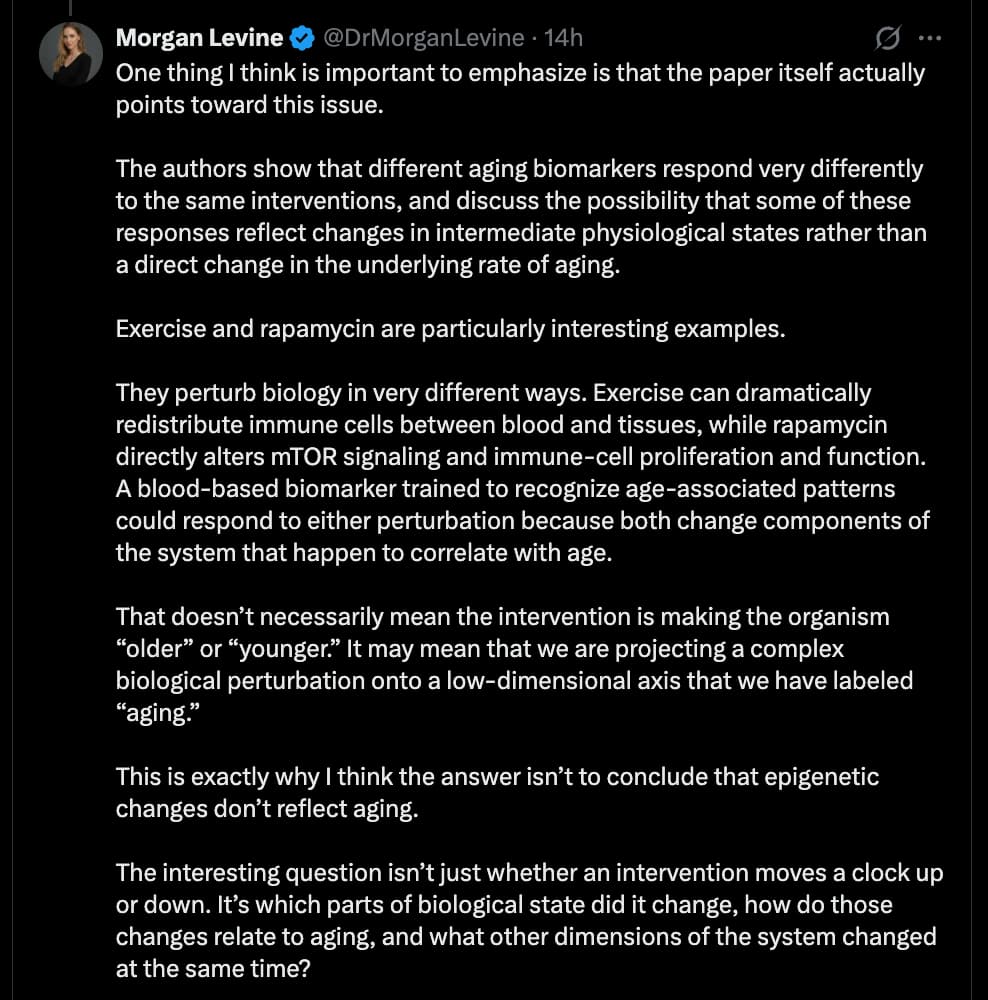
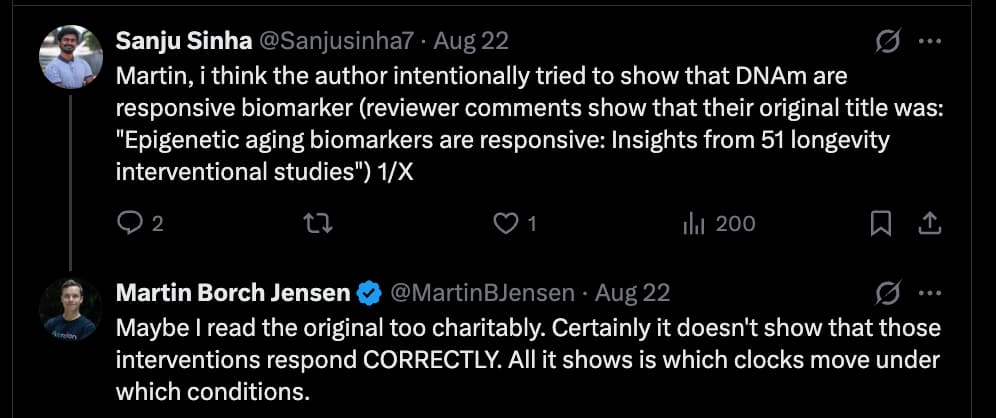
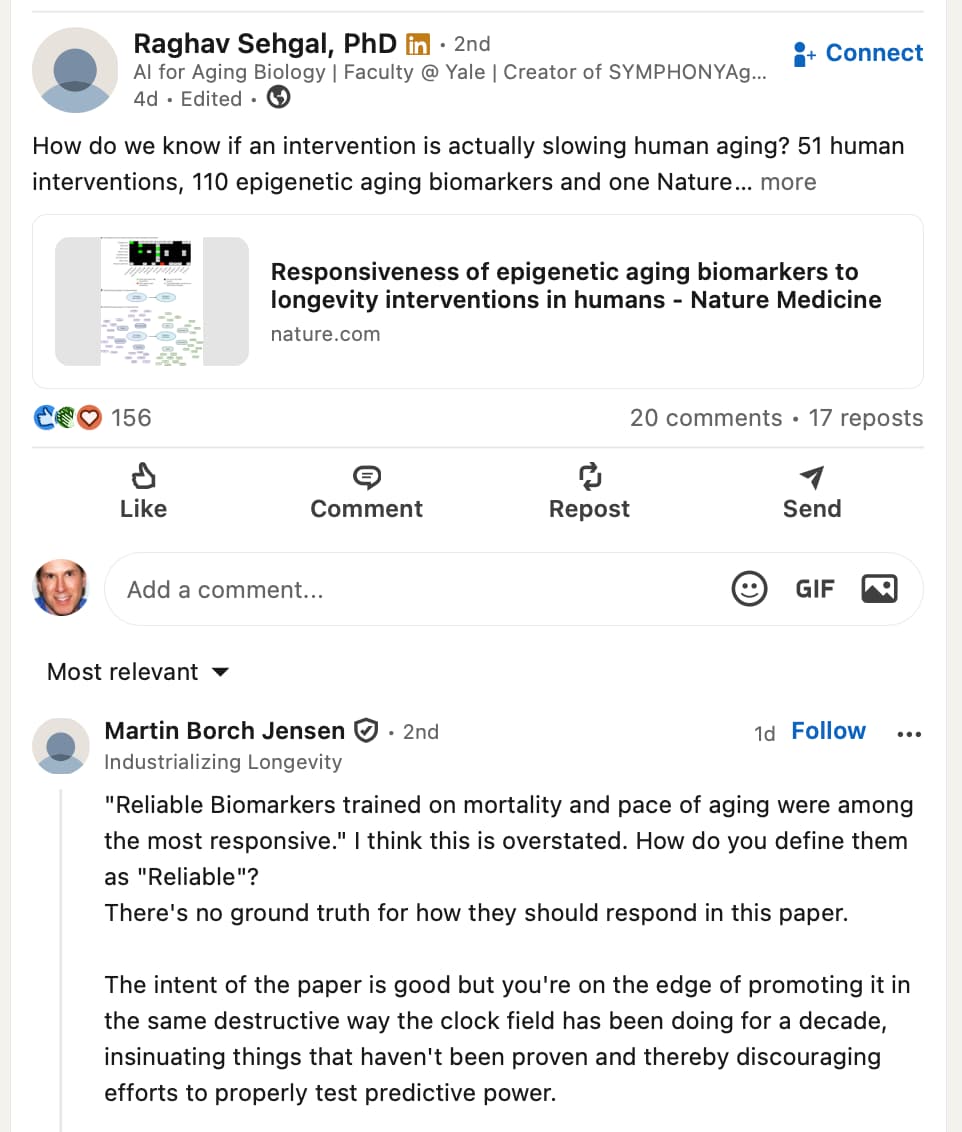
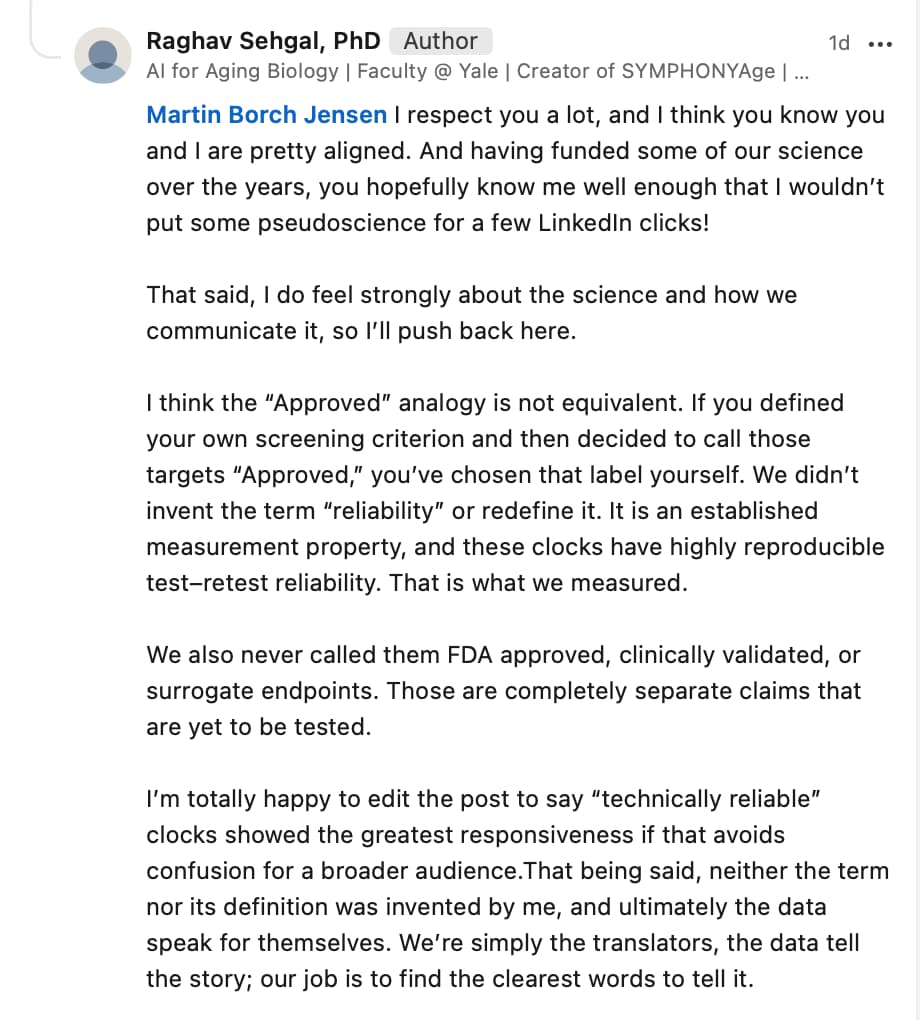
I think we are at a stage of scientific understanding here that’s equivalent to reading tea leaves. At best, it’s five blind people each running their hands over different parts of an elephant and opining about the shape of this animal.
I am not about to waste time on something this early and rudimentary. I’ll wait for some real progress before even looking at these “clocks”. Right now it makes as much sense as examining badger entrails to predict the stock market. YMMV.
3 Likes
In the end the technical paper drives a pretty big hole into the idea that we can use DNA methylation clocks for anything more than entertainment.
3 Likes
I wouldnt over interpret the negative result of rapamycin… we already knew it.
My idea is to combine both compound and strategy that can decrease pace of aging in clocks and rapamycin. Rapamycin is connected to tgfb: negative impact on cpg clock. Also it does perform bad on glucose and cholesterol and also maybe on HRV… Mike lustgarden tried it and also said his results did go in the wrong direction.
Personally I use rapamycin once a month max in order to let my thymus regrow 
1 Like
Ongoing discussion on this topic.
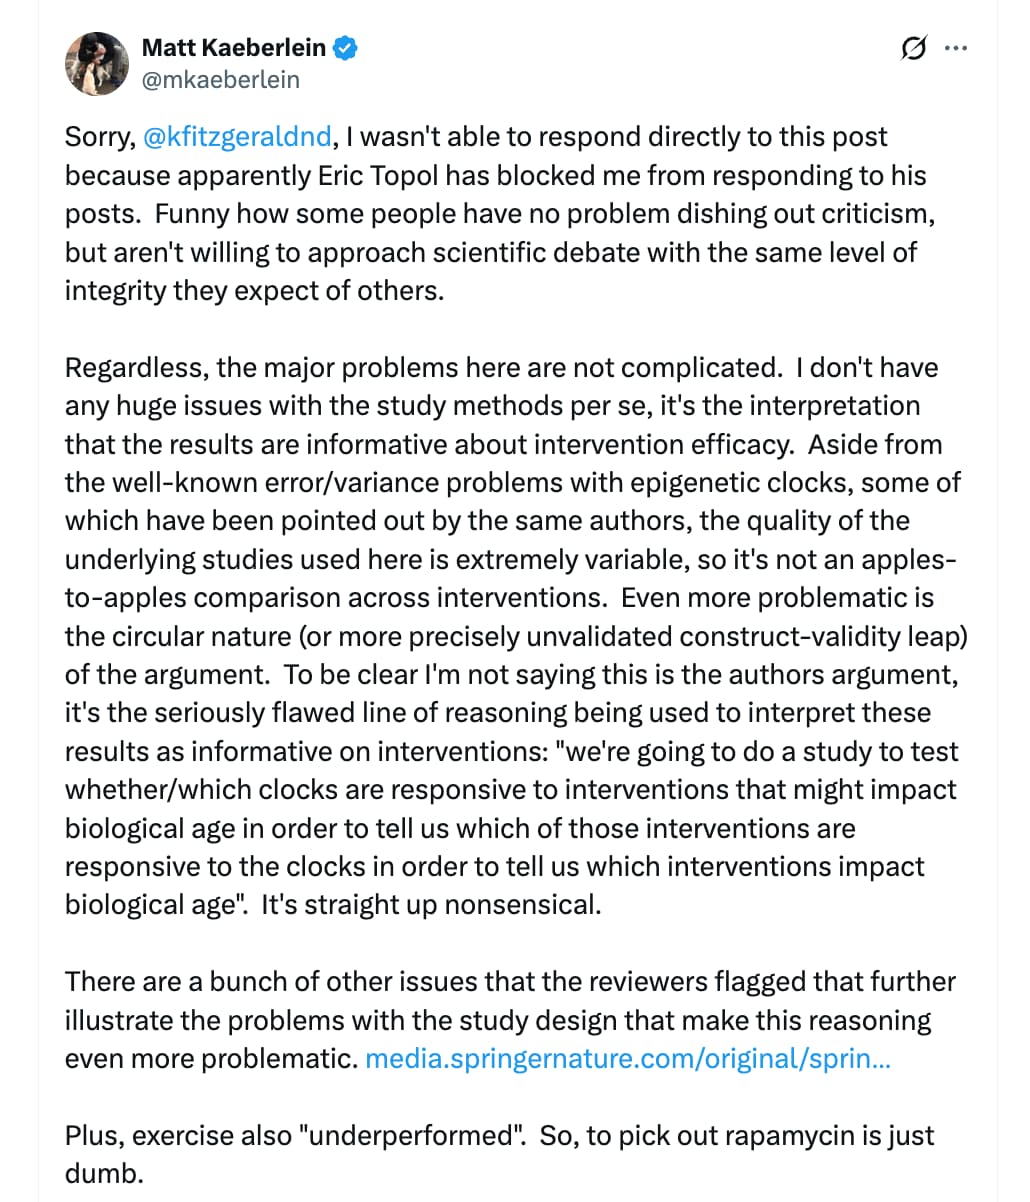
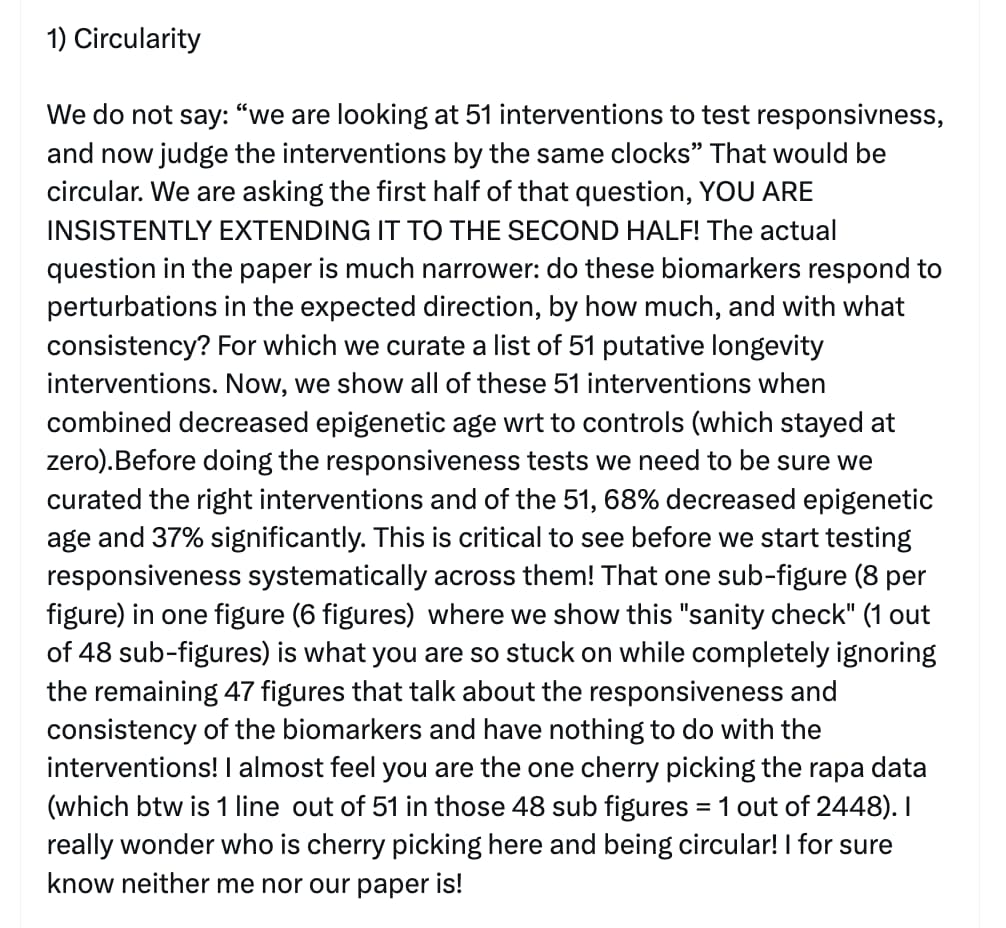
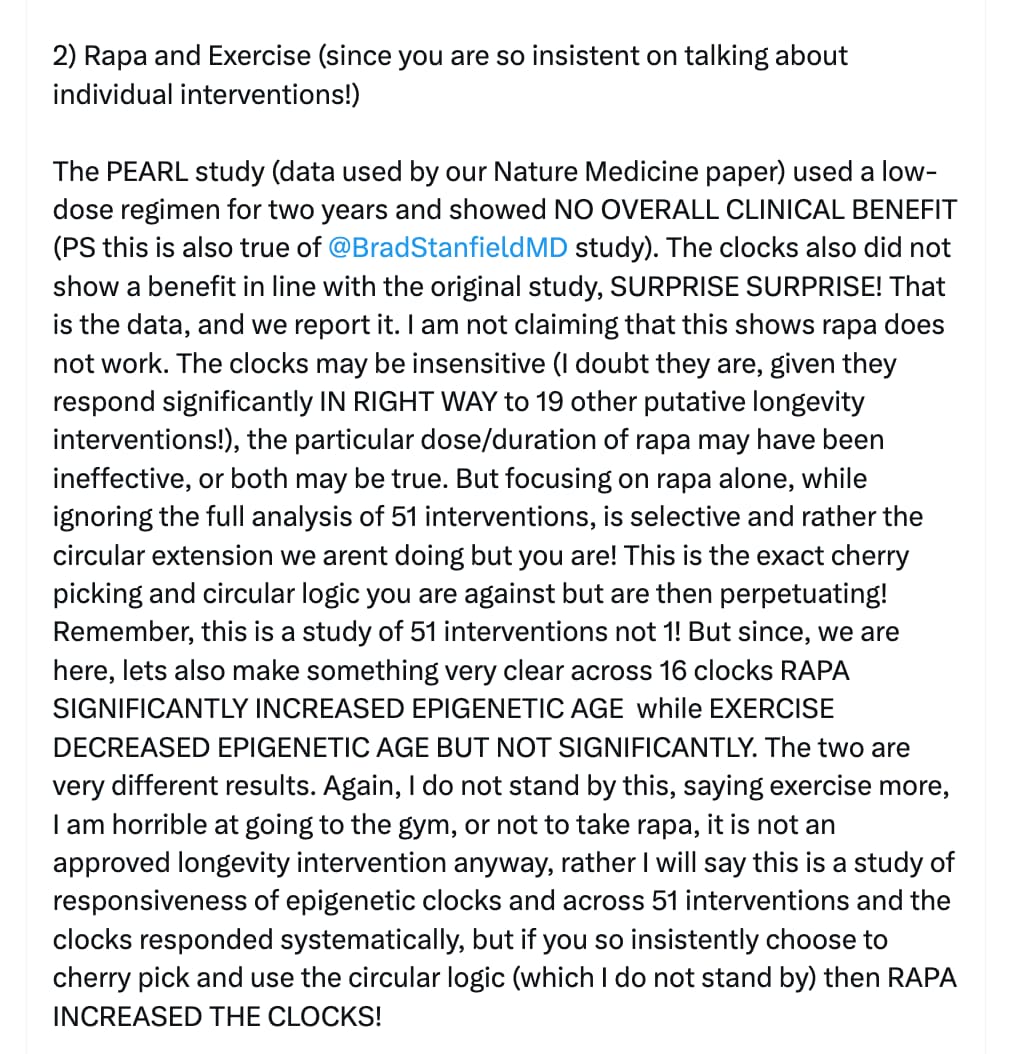
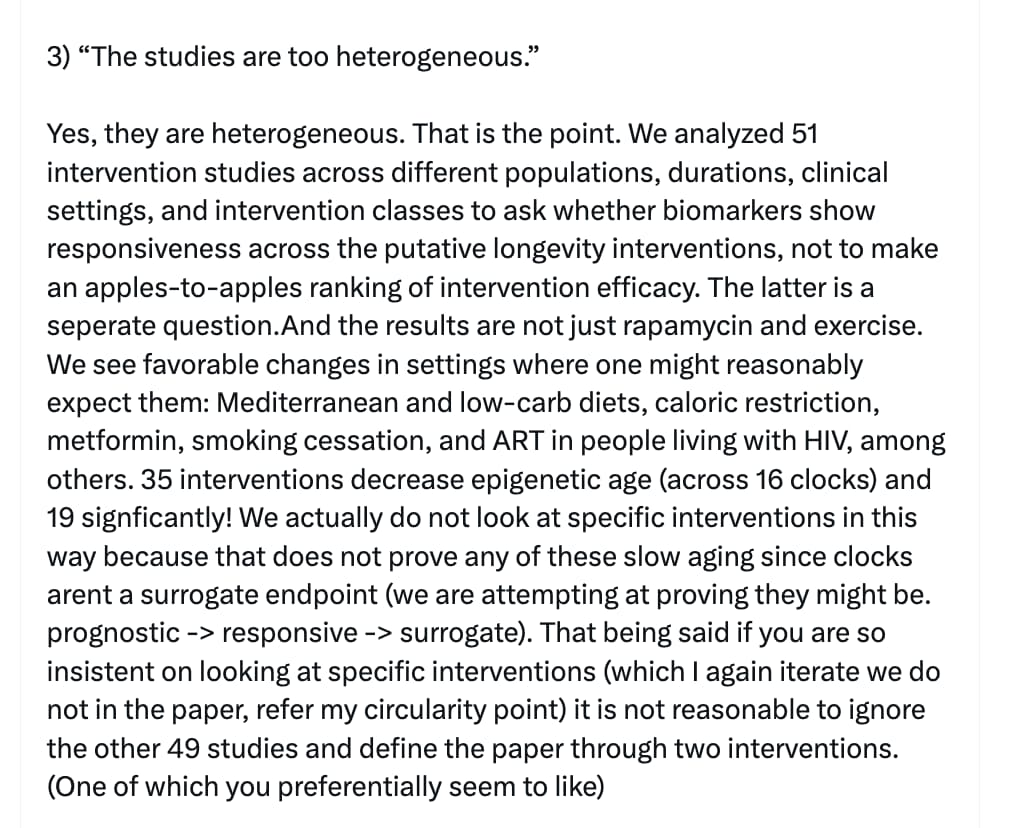
It sounds like they only looked at two papers on rapamycin - the original PEARL study (under dosed by 60% due to mistake in using powdered / encapsulated rapamycin) and the Stanfield study - very much underpowered and looked at very simple / few endpoints. The larger rapamycin studies will be most interesting, when they are completed. It is interesting that rapamycin for some reason doesn’t show impact on epigenetic clocks…


1 Like
I pointed Claude at the research papers mentioned in this thread and asked it to try to explain the possible reasons why rapamycin is not showing the positive movement in epigenetic clocks that we would expect from a validated life extension agent like rapamycin. Here is the response:
Why Rapamycin Does Not Move the Epigenetic Clocks
Brief Summary
Epigenetic clocks are algorithms that read DNA methylation patterns in blood and return a number meant to represent biological rather than chronological age. They are being promoted as the short-cut endpoint for longevity trials, because nobody wants to run a fifty-year survival study. The TranslAGE-Response analysis pooled 51 human intervention studies across sixteen clocks and found that, on average, the clocks do move, but by a very small amount, and the largest movements came from sick populations receiving disease treatment rather than from healthy people taking geroprotectors. Rapamycin, the single best validated pharmacological lifespan extender in mammals, produced no statistically significant clock reduction. That combination is the problem. Either the clocks are not measuring the axis of aging that rapamycin acts on, or the human trials are far too small and far too short to see it, or rapamycin’s human benefit is much smaller than the mouse data imply. The three possibilities are not mutually exclusive, and the field currently cannot distinguish between them, which is precisely why a $300,000 competition now exists to find a better biomarker.
The Core Arithmetic Problem
Before any biology, the numbers need stating plainly.
In the ITP mouse trials, rapamycin extends median lifespan by roughly 10 to 26 percent depending on dose and sex. If a human took a drug that slowed the rate of biological aging by even 15 percent, and if DunedinPACE genuinely measured rate of aging, the pace score should fall from about 1.00 to about 0.85. The standard deviation of DunedinPACE in reference populations is roughly 0.09 to 0.10 units. A drop of 0.15 units is therefore about 1.5 standard deviations, which is an enormous effect, impossible to miss even in a small trial.
What the 51-study database actually found, averaged across every intervention tested, was a mean standardized reduction of 0.089 standard deviations for DunedinPACE, 0.089 for PCPhenoAge, 0.081 for GrimAgeV2 and 0.078 for PCGrimAge. That is roughly one seventeenth of the effect the mouse lifespan data would predict for a real 15 percent slowing of aging.
So one of the premises is wrong. Below are the candidate explanations, ordered from most to least mundane.
Category A: Statistical and Measurement Explanations
1. The human rapamycin trials are hopelessly underpowered for the effect size in question.
To detect a standardized effect of d = 0.09 at 80 percent power and p < 0.05 in a two-arm trial, each arm needs about 1,940 participants. The PEARL trial, the largest randomized human rapamycin longevity trial to date, enrolled 114 people across three arms, roughly 38 per arm. With 38 per arm, the smallest effect detectable at 80 percent power is about d = 0.64, which is seven times larger than the average clock response observed across all 51 interventions in the database. A null result under those conditions carries almost no information. It is not evidence of absence.
2. The trial duration is shorter than the signal accumulation time.
This is the most important and most overlooked point. Clocks that measure accumulated age, such as PhenoAge and GrimAge, only diverge between treated and untreated groups in proportion to elapsed time. If rapamycin slows aging by 20 percent, then after 48 weeks the treated group has banked 0.2 years of advantage. The test-retest measurement noise of first-generation clocks is on the order of 1 to 3 years. You are looking for a 2.4-month signal inside a 24-month noise band. Even the reliability-improved PC clocks cannot rescue that ratio in under a year.
3. Sixteen clocks, paired pre-post t-tests, and no multiple-comparison correction.
The analysis itself uses paired t-tests on pre and post samples with a p < 0.05 threshold and no correction across sixteen biomarkers. The authors are candid that they cannot tell whether a single-clock hit is a false positive or the most sensitive readout. This cuts both ways: it inflates the apparent responsiveness of the interventions that did hit, and it means rapamycin’s non-significance sits inside a very noisy comparison structure.
4. Aggregation across heterogeneous, mostly uncontrolled studies.
TranslAGE-Response pools published studies of wildly different design, dose, duration and population. Many are single-arm pre-post with no placebo. Regression to the mean, seasonal variation, acute illness resolution and assay batch effects all live inside those pre-post deltas.
Category B: The Clocks May Be Measuring Something Rapamycin Does Not Change
5. The clocks were trained on the wrong target.
First-generation clocks (Horvath, Hannum) were trained to predict chronological age. By construction, an algorithm optimized to predict calendar time discards exactly the residual variation that an anti-aging drug would move. Second-generation clocks (PhenoAge, GrimAge) were trained on mortality-associated clinical chemistry and plasma proteins in observational cohorts. They inherit whatever drives mortality in an untreated population, which is heavily weighted toward smoking, inflammation, metabolic disease and kidney function. Neither training target is “responsiveness to mTOR inhibition.”
6. Rapamycin pushes the input biomarkers of second-generation clocks in the wrong direction.
This is a specific and under-discussed mechanism. PhenoAge is built from albumin, creatinine, glucose, CRP, lymphocyte percentage, mean cell volume, red cell distribution width, alkaline phosphatase and white cell count. Rapamycin is well documented to raise triglycerides and LDL, to sometimes raise fasting glucose and impair insulin sensitivity via chronic mTORC2 inhibition, and to cause mild anemia, altered red cell indices and lymphocyte suppression at higher exposures. Several of these move the clock in the “older” direction. If rapamycin simultaneously slows true aging and worsens the surrogate inputs, the clock reads a wash. The clock is not measuring aging here, it is measuring metabolic side effects.
7. In mice, much of rapamycin’s lifespan gain is cancer deferral, which clocks do not index.
The dominant cause of death in laboratory mice is neoplasia. A substantial share of rapamycin’s median and maximum lifespan extension comes from delaying tumor onset. Tumor latency is not encoded in blood methylation drift. An intervention can therefore add 20 percent to lifespan while leaving the methylation trajectory of surviving normal tissue essentially untouched.
8. Clock signal may be dominated by stochastic methylation drift that mTOR inhibition does not touch.
Recent work on epigenetic disorder (Aging, 2024) shows that clock CpGs are enriched in regions that both gain and lose methylation disorder with age, and that lifespan interventions dissociate from that disorder. Caloric restriction in C57BL/6 mice reduced epigenetic age across all clock types while leaving global disorder unchanged; Snell dwarfs reduced both. If clock signal is largely a readout of cumulative stochastic drift tied to cell division history, then a drug acting on translation, autophagy and proteostasis has no obvious lever on it.
9. Tissue mismatch: we measure blood, rapamycin acts elsewhere.
The mouse data support this directly. Wang et al. (Genome Biology, 2017) found that liver epigenetic aging signatures were slowed by rapamycin, dwarfism and calorie restriction. Horvath et al. (GeroScience, 2021) found no significant effect of rapamycin on blood DNAm age in 37 common marmosets given about 1 mg/kg five days a week for two to three and a half years, despite that being a far longer and more intensive exposure than any human trial. Liver responds, blood does not. Human trials measure blood. Notably, rapamycin at 25 nM does slow the skin and blood clock in cultured keratinocytes (Aging, 2019), independently of replicative senescence and proliferation rate, which argues the drug can move methylation age when the relevant cell type is actually the one being measured.
10. Immune cell composition confounds the whole-blood signal.
Blood clocks are strongly influenced by leukocyte proportions. Rapamycin changes immune composition in complex ways, expanding naive T cells and reducing exhausted CD8+CD28- populations, which should read younger, while also suppressing overall lymphocyte counts, which reads older. Cell-composition deconvolution corrections applied by different labs may then remove exactly the biological signal of interest.
Category C: Dose, Schedule and Population
11. Human dosing is far below the mouse exposure that produces the lifespan effect.
The ITP’s strongest results used 42 ppm in chow, producing sustained blood levels well above what 5 to 10 mg once weekly achieves in humans. Weekly pulsatile dosing is deliberately designed to hit mTORC1 while sparing mTORC2, minimizing side effects. If the clock-relevant effect requires more sustained inhibition, the human protocols may simply be below the threshold.
12. Healthy participants have little room to move.
The database’s clearest finding is that disease populations showed substantially larger clock reductions than healthy populations (PCPhenoAge mean difference of 0.28 standard deviations, p < 0.0001). Anti-TNF therapy in arthritis and IBD, and kidney transplantation, were among the strongest responders. That is a strong hint that much of what the clocks register as “rejuvenation” is resolution of acute inflammatory and uremic pathology, not modification of the aging rate. Healthy 50 to 85 year olds on rapamycin have no such pathology to resolve.
13. Late-life start against a cumulative readout.
Rapamycin extends lifespan in mice even when started at 20 months of age. A cumulative-damage clock records the first 20 months regardless. Slowing future accrual produces a change in slope, not a change in level, and slope is exactly what a short two-timepoint study cannot resolve.
Category D: The Uncomfortable Possibilities
14. The clocks may not be valid surrogate endpoints for lifespan interventions at all.
No epigenetic clock has been prospectively validated against a lifespan outcome in a randomized mammalian intervention trial. The entire surrogate rests on observational correlation with mortality. The existence of the Biomarkers of Aging Consortium challenge, with $300,000 in prize money to find the assay that best tracks aging, is an admission by the field that the current tools are not fit for this purpose.
15. Rapamycin’s human effect may genuinely be much smaller than the mouse effect.
This has to stay on the list. Mouse lifespan is short, tumor-dominated and lived in a specific-pathogen-free cage. Human aging is dominated by cardiovascular and neurodegenerative disease over eight decades. The PEARL trial’s actual positive findings were narrow: sex-specific improvements in lean tissue mass, pain and quality of life in women at 10 mg per week, with most other endpoints null. That is a modest healthspan signal, not a rejuvenation signal, and a flat clock is consistent with it.
Bayesian confidence tagging on the main claims:
- Underpowering plus insufficient duration account for a large share of the null: high confidence (roughly 85 percent).
- Second-generation clock inputs are partly antagonized by rapamycin’s metabolic side effects: moderate confidence (roughly 60 percent).
- Blood is the wrong tissue for detecting rapamycin’s effect: moderate confidence (roughly 55 percent), supported by the liver versus blood contrast in mice and marmosets.
- Epigenetic clocks are not currently valid surrogate endpoints for geroprotector trials: high confidence (roughly 80 percent).
- Rapamycin has no real geroprotective effect in humans: low confidence (roughly 15 percent).
Narrative
Aging research has a measurement problem, and rapamycin has just exposed it.
For a decade the field has leaned on epigenetic clocks, algorithms that read chemical tags on DNA and return a number described as your biological age. The appeal is obvious. Nobody can run a fifty-year trial, so a blood test reporting whether you are aging faster or slower would let researchers screen therapies in months instead of decades.
A recent analysis pooled 51 human intervention studies and ran them through sixteen different clocks. The headline was that the clocks are responsive, they do move. The detail underneath is more troubling. The average movement was tiny, roughly one twelfth of a standard deviation, and the biggest movements came from treating sick people, patients receiving anti-inflammatory drugs for arthritis or bowel disease, or receiving a kidney transplant. That is not the same thing as aging more slowly.
And rapamycin, the drug with the strongest and most reproducible lifespan-extension record in mammals, 10 to 26 percent added to mouse median lifespan across independent labs, did not shift the clocks at all.
There are three readings, and we cannot yet tell them apart.
The first is that the human trials are simply too small and too short. Detecting an effect the size these clocks produce needs roughly two thousand people per arm. The largest randomized rapamycin longevity trial enrolled 114 total. Over one year, a drug that slowed aging by twenty percent would bank only about two and a half months of divergence, well inside the measurement noise of the assay.
The second is that the clocks measure the wrong thing. They were trained to predict calendar age, or to predict death from blood chemistry in untreated populations. Neither target has any reason to be sensitive to mTOR inhibition. Worse, rapamycin raises cholesterol, sometimes raises blood sugar and alters red cell indices, and several of those are direct inputs to the newer clocks. The drug may be slowing aging with one hand while making the surrogate look worse with the other.
The third is the one nobody in the community wants to hear: rapamycin’s human benefit may be far smaller than the mouse data suggest.
The big idea is that the tool everyone wanted to use to shortcut longevity research has failed its most important test case. Until a biomarker can correctly identify the one drug we are most confident about, no result from that biomarker should change anyone’s behavior.
2 Likes
Well, well, well. For the first time, I am quite impressed with AI - in this case the Claude write up. Ordinarily you’d have to beat me with a bicycle chain to force me to read a whole page of dodgy AI outpourings, but here I think Claude did a genuinely good job.
I was mulling over whether there’s any point in my commenting on this controversy, and ultimately decided I didn’t want to spend the energy. But before leaving the thread, I went ahead and read the Claude analysis RapAdmin posted (thanks, RA!), just to see how stupid it would be. To my utter shock, the analysis to a large extent mirrored my position - with a few additional nuances missing where I think Claude still lost a step or two - and I am forced to mentally apologize to the darn AI. Bonus: it spares me hours of writing while still getting this conceptual framework out into the discussion arena.
I see that AI is coming along, so maybe its use cases can be expanded. And re these clocks, I expect them going forward to concentrate on determining just what it is exactly that they’re measuring, not in the trivial sense of which biomarkers, but in what the implications of these numbers are supposed to be for complex processes of age related changes. And I expect them to look at the persistence issue - a given profile should not establish “age” as a future projection, just immediate evaluation should trends persist, otherwise you get the problem of one measurement giving you (1) 10 years “older” one day and then a week later 10 years “younger” which is quite unintuitive for most humans who get these results once and then they expect to see how much older/younger they are and be able to take it to the bank - “see you in the year of our lord 2080”. We’ll see. And now I’m happy to bow out of any further discussion and leave the rest in the capable analytical hands of Claude!
(1)EDIT: just to cite a trivial scenario, where you are taking a drug that initially gives you quite a bad reading - say an SGLT2i that initially drops your eGFR number (reads as: BAD!), only for it to flip a year later to much improved numbers (reads as: GOOD!). Well, you didn’t suddenly get older initiating an SGLT2i, nor suddenly younger when the drug took full effect. Meanwhile the numbers would read as older or younger by 10 years in a short span of time - very confusing.
1 Like
PEARL was such a low dose that no effect should be expected.
2 Likes