If you run across anything good please share and I’ll do the same of course.
1 Like
I do wonder if getting labs drawn at different points in the salt cycle could make a difference in results even though blood levels are highly regulated? This has been discussed in the thread already but I tend to forget about the salt cycle they discovered.
“Salt cycle
It is a challenge to measure the long-term effects of salt because of difficulties in regulating dietary intake. However, Mars 500 “mission controllers” were able to dictate the amount of salt that the crew received each day.
During this mission, and a preliminary mission with a different crew that lasted 105 days, 12 crew members consumed either 6, 9 or 12 grams of salt per day for 29 to 60 days. Previous research suggests that there should be roughly the same amount of salt in urine as has been eaten that day.
Instead, the crew excreted different amounts each day, revealing a six to seven-day cycle of salt retention and excretion. The patterns varied between crew members, but were consistent within individuals. For example, on a 12-gram daily salt diet a crew member might excrete as little as 6 grams on day three of the cycle, and peak at 18 grams on day five.”
3 Likes
The problem isn’t only an acute blood pressure response even if in most people drastically lowering salt intake would decrease their blood pressure rather than cutting down slightly. It’s the possible long term impacts of excess salt intake that can’t be detected now except be explained as some disease, or aging, like possibly causing HBP that wouldn’t be affected much by cutting down on sodium intake later.
Sodium excretion isn’t a biomarker for health related to optimal sodium intake, it’s just an estimate of the amount of sodium you consume. Add potassium to that and it’s confounded by vegetable intake – isn’t it still just a marker of how much you consume of each?
In that there will be a system maintaining levels it would be expected to over correct and hence end up with a cycle.
I looked at the data on that a long time ago and was surprised to find that it was the chloride rather than the sodium that was mainly responsible for the increase in blood pressure on high salt diets. That’s why I take a little extra sodium to complement my failry low salt diet instead of adding extra table salt to it.
1 Like
My serum sodium level is currently running quite low (about 135/136) notwithstanding high sodium (citrate) supplementation. It is probably, however, an adjustment to a higher turnover.
If you have any links to the research pointing at chloride that would be helpful.
I wish I had the links. I thought I had the research saved on my computer but I can’t find it. ![]()
[quote=“Olafurpall, post:309, topic:11257”]
chloride rather than the sodium that was mainly responsible for the increase in blood pressure on high salt diets.
[/quote]I think that there is evidence to support this. “Sodium chloride increased mean arterial blood pressure in the salt-sensitive subjects; sodium citrate did not.”
NEJM crossover in salt-sensitive hypertensive men (n=5): Adding NaCl for 7 days raised BP by ~16/8 mmHg; the same sodium as sodium citrate did not. Switching from NaCl to sodium citrate reversed the rise—despite similar sodium retention—implicating the anion.
Randomized crossover in hypertensives (n=6): NaCl loading increased BP; the same sodium as sodium phosphate did not; sodium retention was similar in both arms.
Hypertension trial stratified by salt sensitivity (n=40): In salt-sensitive subjects, NaCl increased mean arterial pressure, whereas sodium citrate did not; differences tracked with acid–base changes.
Crossover in mildly hypertensive & normotensive adults (n=20): NaHCO₃ (bicarbonate) tended to lower SBP (~5 mmHg in hypertensives) while equimolar NaCl did not lower BP—again pointing to an anion effect.
Elderly normotensives, double-blind crossover (n=21): A NaHCO₃-rich mineral water period had lower mean arterial BP than baseline, while a NaCl-rich water period abolished the BP reduction achieved by prior salt restriction (i.e., BP went back up toward baseline).
7 Likes
Interesting. How do you reconcile that with the fact that KCL generally shows benefit to BP and can be used as a salt replacement for Na sensitive individuals? I honestly haven’t looked into it. Always assume Na was the issue.
1 Like
Most diets are deficient in Potassium, in which case any potassium supplementation, including KCl will reduce BP somewhat. However this study from 2005 showed that supplementing with Potassium Citrate (instead of KCl) lowered BP by slightly more : Potassium Citrate vs Potassium Chloride effect on BP
1 Like
People tend to think of Citrate as inert which is an error.
1 Like
Awwww, you are so sweet to think of me. How did you know that I worship tomato sauce!!! TY!!!
1 Like
@Beth, You mentioned it before and I remembered! Hahaha
Now if I could just remember important things!
2 Likes
Yo Mama’s is another good low sodium pasta sauce option.
2 Likes
Finished harvest and have been slowly catching up on reading. Interesting and fun to read as always Malcolm Kendrick wrote a nice column on Sodium and death. Graph here:
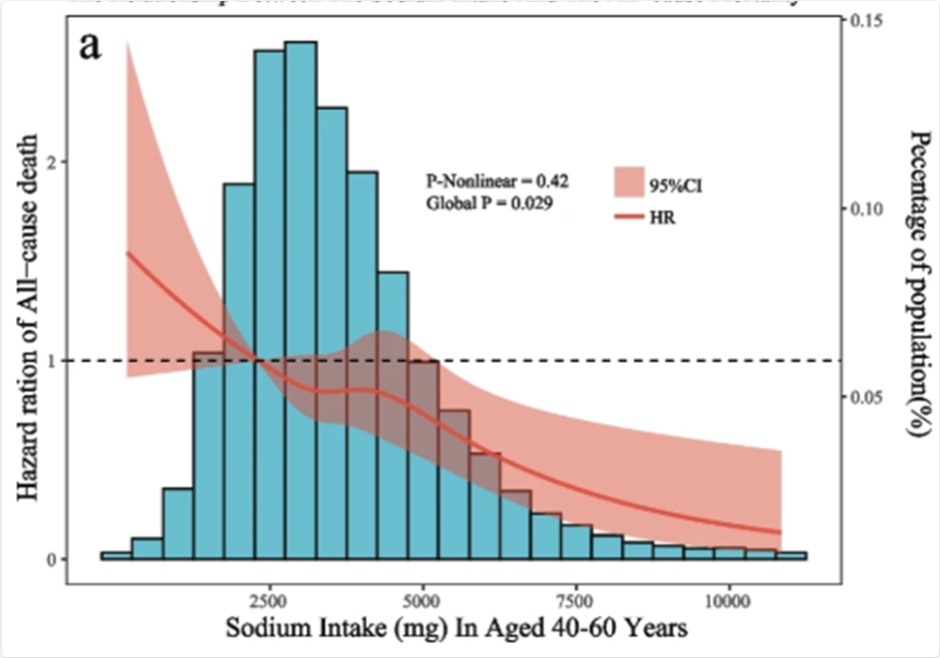
The blue columns are percentage of people using this dose of salt. Most between 2 and 5 grams. Red line is hazard ratio and goes down all the way. You live longer the more salt you eat. Seems to level off around 12 grams, but never goes up. Here is the article:
He starts off talking about Science, specifically disruptive science.
I expected it to be the opposite - the less salt you eat the longer you live.
As I understand it there is an issue with large amounts of chloride, but not necessarily sodium.
1 Like
That guy seems to be cherry picking the data.
I asked ChatGPT5.1 about what the overall data looks like on sodium intake and all cause risk of mortality and here is what it suggested:
ChatGPT5.1 Response:
Short version: It’s a clear J-shaped (sometimes U-shaped) curve.
Here’s what the all-cause mortality vs. sodium intake relationship looks like based on the best large-scale human data (PURE, CDC NHANES re-analyses, multiple meta-analyses):
What the Sodium–Mortality Curve Looks Like
Shape:
J-shaped
- Mortality is elevated at very low sodium intake (< ~2 g/day sodium ≈ <5 g/day salt).
- Lowest mortality is at moderate intake (~3–5 g/day sodium ≈ 7.5–12.5 g/day salt).
- Mortality rises again at high intake (> ~5–6 g/day sodium ≈ >12.5–15 g/day salt).
This pattern holds across most populations, but the left side (very low sodium) is consistently associated with higher all-cause mortality, largely due to increased cardiovascular events, hormonal activation (RAAS, sympathetic activation), and confounding from illness-induced low intake.
Approximate Shape in Words
If you plotted sodium intake (x-axis) vs. all-cause mortality risk (y-axis) , it would look like this:
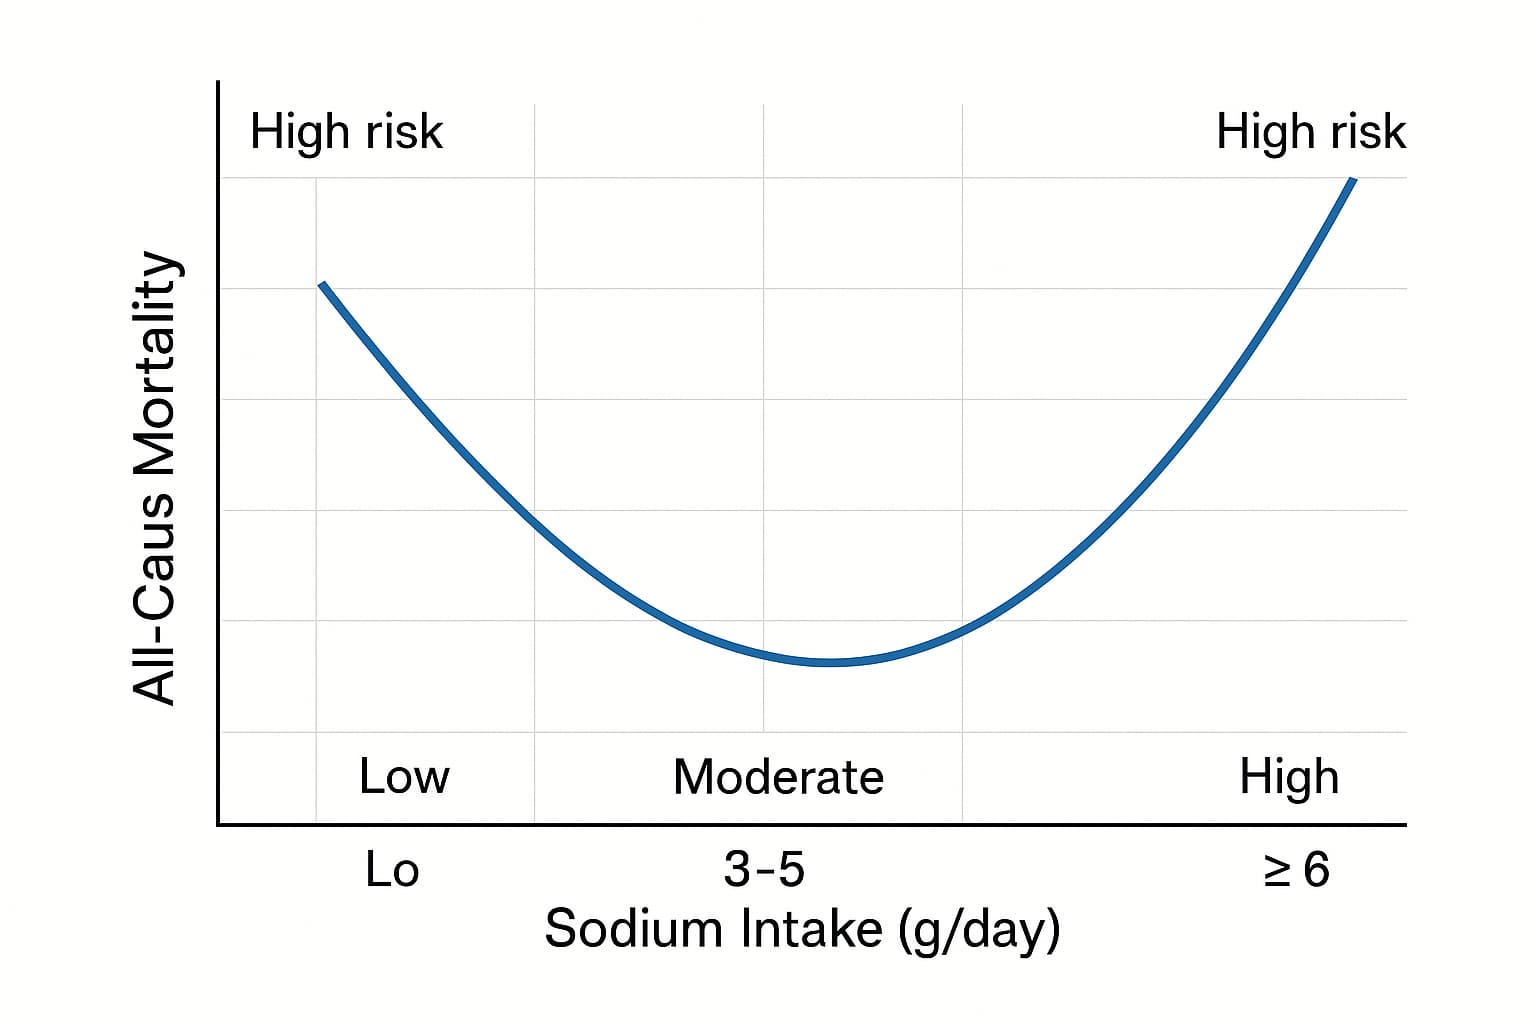
- Left arm rises steeply as you go below ~2 g/day (≈5 g salt).
- Bottom trough is wide and shallow from ~3–5 g/day.
- Right arm rises more gradually above ~6 g/day but begins climbing.
Typical Numeric Inflection Points (from major cohort data)
| Sodium intake (g/day) | Approx. Risk Pattern |
|---|---|
| < 2 g/day | ↑↑ mortality (RAAS activation, frailty, confounding illness) |
| 2–3 g/day | Slightly elevated risk vs. optimal |
| 3–5 g/day | Lowest all-cause mortality |
| 5–6+ g/day | Gradual rise in mortality (mainly stroke/CVD) |
| >7 g/day | Clear increase in stroke & CVD mortality |
Why the curve is J-shaped rather than linear
Left side: Too little sodium
- Chronic low sodium stimulates renin, aldosterone, norepinephrine, and angiotensin II, all linked to CVD mortality.
- Very low intake common in people with chronic illness, frailty, or reduced appetite, creating reverse causation.
- Hyponatremia strongly predicts mortality.
Right side: Too much sodium
- Direct link to stroke, hypertension, and left ventricular hypertrophy, especially in salt-sensitive populations.
Key Scientific References (All Clickable Links)
1. PURE Study – NEJM (2014) – J-shaped sodium–mortality curve
“Urinary Sodium and Potassium Excretion, Mortality, and Cardiovascular Events”
New England Journal of Medicine
![]() https://www.nejm.org/doi/full/10.1056/NEJMoa1311889
https://www.nejm.org/doi/full/10.1056/NEJMoa1311889
This is the most influential dataset. Shows clear higher mortality below 2 g/day and above ~5–6 g/day sodium.
2. Trials of Hypertension Prevention – JACC (2016)
“Sodium Intake and All-Cause Mortality Over 20 Years in the Trials of Hypertension Prevention”
Journal of the American College of Cardiology
![]() https://www.jacc.org/doi/10.1016/j.jacc.2016.07.745
https://www.jacc.org/doi/10.1016/j.jacc.2016.07.745
Finds higher long-term mortality at high sodium intakes; also supports non-linear associations.
3. Messerli et al., 2020 – Sodium Intake & Mortality / Life Expectancy
“Salt intake, life expectancy, and all-cause mortality”
Published in Journal of the American College of Cardiology: Case Reports
![]() Sodium intake, life expectancy, and all-cause mortality - PMC
Sodium intake, life expectancy, and all-cause mortality - PMC
Shows inverse correlation between sodium intake and mortality at the population level — consistent with the left arm of the J-curve.
4. European Heart Journal — Review of the Non-Linear Relationship
“Dietary sodium and mortality: how much do we really know?”
European Heart Journal
![]() https://academic.oup.com/eurheartj/article/42/21/2113/6067611
https://academic.oup.com/eurheartj/article/42/21/2113/6067611
Confirms the J-shaped pattern is consistent across datasets and discusses methodological factors.
5. Mente et al., Lancet 2018 – Sodium Intake & Clinical Outcomes
“Associations of urinary sodium excretion with cardiovascular events in individuals with and without hypertension”
The Lancet
![]() https://www.thelancet.com/journals/lancet/article/PIIS0140-6736(18)31376-X/fulltext
https://www.thelancet.com/journals/lancet/article/PIIS0140-6736(18)31376-X/fulltext
Shows that high sodium mainly harms hypertensive individuals, but low sodium harms everyone.
Overall Interpretation
Every high-quality cohort agrees:
- Very low sodium (<2 g/day) is not protective; it is associated with higher mortality, driven by RAAS activation, sympathetic tone, frailty, and measurement confounding.
- Moderate intake (~3–5 g/day) is the safest range .
- High sodium (>5–6 g/day) increases mortality, mainly through BP elevation, endothelial dysfunction, LV hypertrophy, and stroke risk.
This produces the classic J-curve.
Here is why higher sodium levels increase mortality risk. If you doubt it, check your blood pressure on a low sodium diet vs. high sodium diet (as a start). Given you are at high risk of cardiovascular disease, you may want to be extra careful in this area.
CGPT5.1
Here’s the unvarnished breakdown of why high sodium intake drives higher all-cause mortality, based on the combination of direct physiological effects and population-level outcomes.
This is the right arm of the J-curve.
1. Direct Physiological Drivers
1.1 Increased Blood Pressure (the single biggest mechanism)
This is the most reproducible effect across all populations.
High sodium intake:
- Expands extracellular fluid volume
- Raises plasma volume
- Increases peripheral vascular resistance
- Elevates systolic and diastolic blood pressure
Hypertension is the strongest modifiable driver of cardiovascular mortality worldwide.
Even “salt-resistant” individuals still show:
- ↑ nighttime BP
- ↑ arterial stiffness
- ↑ pulse pressureover time with high sodium intake.
1.2 Vascular Remodeling & Endothelial Dysfunction
Excess sodium directly harms vascular biology even without BP changes.
Mechanisms:
- Reduced nitric oxide bioavailability
- Increased oxidative stress
- Endothelial cell stiffening
- Vascular smooth muscle hypertrophy
These are early steps in:
- Atherosclerosis
- Left ventricular hypertrophy
- Microvascular rarefaction
This is why high sodium can increase stroke risk even when BP-adjusted.
1.3 Increased Stroke Risk
Stroke incidence rises nearly linearly with sodium intake above ~5–6 g/day.
Reasons:
- Higher systolic BP and pulse pressure
- Cerebral arterial stiffness
- Increased coagulability
- Endothelial damage in small perforator arteries
This is the most well-documented pathology linking high sodium to mortality.
1.4 Cardiac Remodeling (LVH)
Chronic high sodium intake contributes to:
- Left ventricular hypertrophy
- Increased left ventricular massIndependent of BP in some studies.
LVH is a powerful predictor of:
- Sudden cardiac death
- Heart failure
- Arrhythmias
1.5 Kidney Stress and Hyperfiltration
High sodium → kidney increases filtration pressure to dump excess sodium.
Over decades this contributes to:
- Glomerular hyperfiltration
- Albuminuria
- Gradual nephron loss
- Higher CKD incidence
Even mild CKD dramatically raises all-cause mortality.
1.6 Vascular Calcification & Sodium Deposition in Tissues
High sodium accumulates in:
- Skin
- Muscle
- Interstitium
This drives:
- Local inflammation
- Macrophage activation
- Higher arterial stiffness
Emerging data shows tissue sodium is a new biomarker for cardiovascular mortality.
2. Salt Sensitivity: The Amplifier
Around 25–50% of people are salt-sensitive.
Salt sensitivity is more common in:
- Older adults
- East Asians
- People with metabolic syndrome
- People with low potassium intake
- People with low nephron number
In salt-sensitive people:
- The right arm of the J-curve is steeper
- Every +1 g/day sodium has a bigger BP and mortality effect
This is why population-level curves show rising mortality at high intake even though many people tolerate it relatively well.
3. Electrolyte Imbalance: Sodium–Potassium Ratio
The mortality risk is not only sodium—it’s the sodium-to-potassium ratio.
High sodium + low potassium is the worst-case scenario because:
- Potassium lowers BP
- Potassium improves endothelial function
- Potassium opposes sodium’s renal effects
Many modern diets are:
- Very high sodium
- Very low potassium→ amplifying mortality risk beyond sodium alone.
4. Behavioral/Confounder Effects
While less important than physiology, high sodium intake often tracks with:
- Higher consumption of processed foods
- Higher calorie intake
- More saturated fats
- Lower intake of fruits/vegetables
- Lower potassium/magnesium
- More obesity and metabolic syndrome
Even after adjusting for these, the physiological signal remains—but confounders worsen the gradient.
5. The Threshold Where Mortality Rises
Across PURE, NHANES re-analyses, EPIC, and multiple meta-analyses:
- >5–6 g/day sodium → increasing all-cause mortality
- >7 g/day → sharper rise (mainly stroke)
- >8–10 g/day → clear elevation in CVD deaths across all populations
This corresponds to:
- Salt equivalent: 12.5 g salt → 15 g+ salt per day
- This is common in people who eat lots of processed foods or restaurant food.
6. Combined Perspective
The right-arm mortality increase is driven by:
Primary drivers
- Blood pressure elevation
- Vascular injury
- Stroke
- LVH
- CKD progression
Secondary drivers
- Poor diet patterns
- High sodium-to-potassium ratio
- Salt sensitivity genetics
The biological mechanisms are far stronger than the confounders here.
7. Practical Numbers
- Optimal sodium range for lowest all-cause mortality: 3–5 g/day sodium (≈7.5–12.5 g salt)
- Clearly harmful range: >6 g/day sodium (+ BP rise, ↑ stroke risk)
- Very high intake: >7–8+ g/day → measurable increase in CVD and all-cause mortality across almost all cohorts.