Salt / Sodium's role in accelerating aging

That guy seems to be cherry picking the data.

I asked ChatGPT5.1 about what the overall data looks like on sodium intake and all cause risk of mortality and here is what it suggested:

ChatGPT5.1 Response:

Short version: It’s a clear J-shaped (sometimes U-shaped) curve.

Here’s what the all-cause mortality vs. sodium intake relationship looks like based on the best large-scale human data (PURE, CDC NHANES re-analyses, multiple meta-analyses):


What the Sodium–Mortality Curve Looks Like

Shape:

J-shaped

  • Mortality is elevated at very low sodium intake (< ~2 g/day sodium ≈ <5 g/day salt).
  • Lowest mortality is at moderate intake (~3–5 g/day sodium ≈ 7.5–12.5 g/day salt).
  • Mortality rises again at high intake (> ~5–6 g/day sodium ≈ >12.5–15 g/day salt).

This pattern holds across most populations, but the left side (very low sodium) is consistently associated with higher all-cause mortality, largely due to increased cardiovascular events, hormonal activation (RAAS, sympathetic activation), and confounding from illness-induced low intake.


Approximate Shape in Words

If you plotted sodium intake (x-axis) vs. all-cause mortality risk (y-axis) , it would look like this:
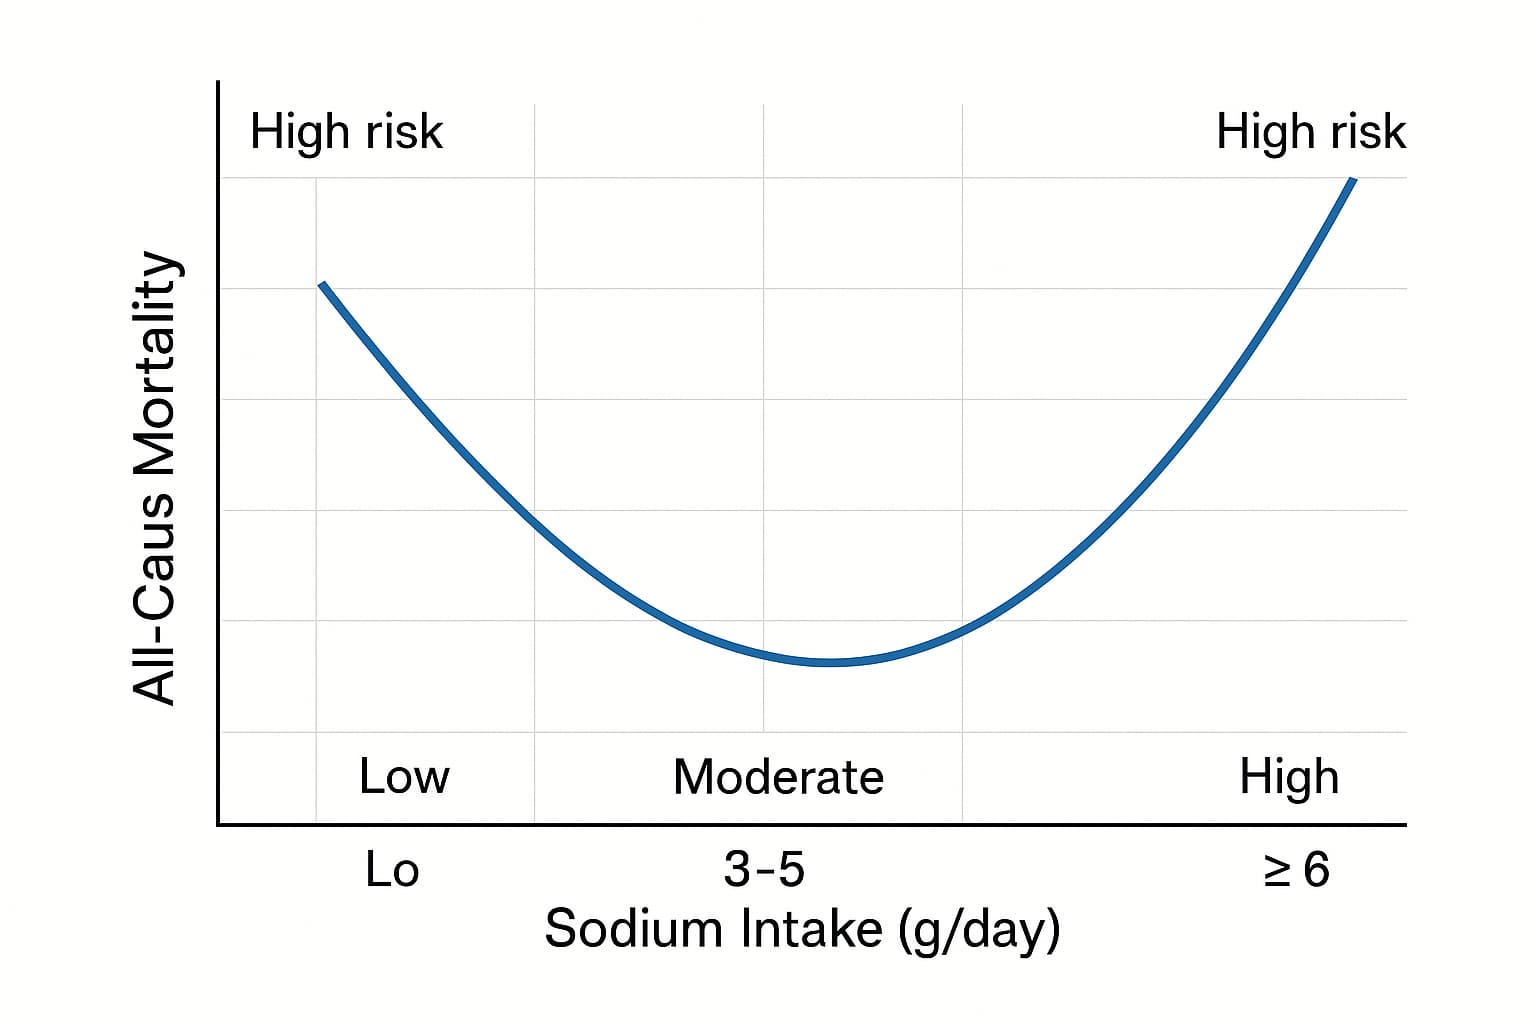
  • Left arm rises steeply as you go below ~2 g/day (≈5 g salt).
  • Bottom trough is wide and shallow from ~3–5 g/day.
  • Right arm rises more gradually above ~6 g/day but begins climbing.

Typical Numeric Inflection Points (from major cohort data)

Sodium intake (g/day) Approx. Risk Pattern
< 2 g/day ↑↑ mortality (RAAS activation, frailty, confounding illness)
2–3 g/day Slightly elevated risk vs. optimal
3–5 g/day Lowest all-cause mortality
5–6+ g/day Gradual rise in mortality (mainly stroke/CVD)
>7 g/day Clear increase in stroke & CVD mortality

Why the curve is J-shaped rather than linear

Left side: Too little sodium

  • Chronic low sodium stimulates renin, aldosterone, norepinephrine, and angiotensin II, all linked to CVD mortality.
  • Very low intake common in people with chronic illness, frailty, or reduced appetite, creating reverse causation.
  • Hyponatremia strongly predicts mortality.

Right side: Too much sodium

  • Direct link to stroke, hypertension, and left ventricular hypertrophy, especially in salt-sensitive populations.

Key Scientific References (All Clickable Links)

1. PURE Study – NEJM (2014) – J-shaped sodium–mortality curve

“Urinary Sodium and Potassium Excretion, Mortality, and Cardiovascular Events”

New England Journal of Medicine

:point_right: https://www.nejm.org/doi/full/10.1056/NEJMoa1311889

This is the most influential dataset. Shows clear higher mortality below 2 g/day and above ~5–6 g/day sodium.


2. Trials of Hypertension Prevention – JACC (2016)

“Sodium Intake and All-Cause Mortality Over 20 Years in the Trials of Hypertension Prevention”

Journal of the American College of Cardiology

:point_right: https://www.jacc.org/doi/10.1016/j.jacc.2016.07.745

Finds higher long-term mortality at high sodium intakes; also supports non-linear associations.


3. Messerli et al., 2020 – Sodium Intake & Mortality / Life Expectancy

“Salt intake, life expectancy, and all-cause mortality”

Published in Journal of the American College of Cardiology: Case Reports

:point_right: Sodium intake, life expectancy, and all-cause mortality - PMC

Shows inverse correlation between sodium intake and mortality at the population level — consistent with the left arm of the J-curve.


4. European Heart Journal — Review of the Non-Linear Relationship

“Dietary sodium and mortality: how much do we really know?”

European Heart Journal

:point_right: https://academic.oup.com/eurheartj/article/42/21/2113/6067611

Confirms the J-shaped pattern is consistent across datasets and discusses methodological factors.


5. Mente et al., Lancet 2018 – Sodium Intake & Clinical Outcomes

“Associations of urinary sodium excretion with cardiovascular events in individuals with and without hypertension”

The Lancet

:point_right: https://www.thelancet.com/journals/lancet/article/PIIS0140-6736(18)31376-X/fulltext

Shows that high sodium mainly harms hypertensive individuals, but low sodium harms everyone.


Overall Interpretation

Every high-quality cohort agrees:

  • Very low sodium (<2 g/day) is not protective; it is associated with higher mortality, driven by RAAS activation, sympathetic tone, frailty, and measurement confounding.
  • Moderate intake (~3–5 g/day) is the safest range .
  • High sodium (>5–6 g/day) increases mortality, mainly through BP elevation, endothelial dysfunction, LV hypertrophy, and stroke risk.

This produces the classic J-curve.

Here is why higher sodium levels increase mortality risk. If you doubt it, check your blood pressure on a low sodium diet vs. high sodium diet (as a start). Given you are at high risk of cardiovascular disease, you may want to be extra careful in this area.

CGPT5.1

Here’s the unvarnished breakdown of why high sodium intake drives higher all-cause mortality, based on the combination of direct physiological effects and population-level outcomes.

This is the right arm of the J-curve.


1. Direct Physiological Drivers

1.1 Increased Blood Pressure (the single biggest mechanism)

This is the most reproducible effect across all populations.

High sodium intake:

  • Expands extracellular fluid volume
  • Raises plasma volume
  • Increases peripheral vascular resistance
  • Elevates systolic and diastolic blood pressure

Hypertension is the strongest modifiable driver of cardiovascular mortality worldwide.

Even “salt-resistant” individuals still show:

  • ↑ nighttime BP
  • ↑ arterial stiffness
  • ↑ pulse pressureover time with high sodium intake.

1.2 Vascular Remodeling & Endothelial Dysfunction

Excess sodium directly harms vascular biology even without BP changes.

Mechanisms:

  • Reduced nitric oxide bioavailability
  • Increased oxidative stress
  • Endothelial cell stiffening
  • Vascular smooth muscle hypertrophy

These are early steps in:

  • Atherosclerosis
  • Left ventricular hypertrophy
  • Microvascular rarefaction

This is why high sodium can increase stroke risk even when BP-adjusted.


1.3 Increased Stroke Risk

Stroke incidence rises nearly linearly with sodium intake above ~5–6 g/day.

Reasons:

  • Higher systolic BP and pulse pressure
  • Cerebral arterial stiffness
  • Increased coagulability
  • Endothelial damage in small perforator arteries

This is the most well-documented pathology linking high sodium to mortality.


1.4 Cardiac Remodeling (LVH)

Chronic high sodium intake contributes to:

  • Left ventricular hypertrophy
  • Increased left ventricular massIndependent of BP in some studies.

LVH is a powerful predictor of:

  • Sudden cardiac death
  • Heart failure
  • Arrhythmias

1.5 Kidney Stress and Hyperfiltration

High sodium → kidney increases filtration pressure to dump excess sodium.

Over decades this contributes to:

  • Glomerular hyperfiltration
  • Albuminuria
  • Gradual nephron loss
  • Higher CKD incidence

Even mild CKD dramatically raises all-cause mortality.


1.6 Vascular Calcification & Sodium Deposition in Tissues

High sodium accumulates in:

  • Skin
  • Muscle
  • Interstitium

This drives:

  • Local inflammation
  • Macrophage activation
  • Higher arterial stiffness

Emerging data shows tissue sodium is a new biomarker for cardiovascular mortality.


2. Salt Sensitivity: The Amplifier

Around 25–50% of people are salt-sensitive.

Salt sensitivity is more common in:

  • Older adults
  • East Asians
  • People with metabolic syndrome
  • People with low potassium intake
  • People with low nephron number

In salt-sensitive people:

  • The right arm of the J-curve is steeper
  • Every +1 g/day sodium has a bigger BP and mortality effect

This is why population-level curves show rising mortality at high intake even though many people tolerate it relatively well.


3. Electrolyte Imbalance: Sodium–Potassium Ratio

The mortality risk is not only sodium—it’s the sodium-to-potassium ratio.

High sodium + low potassium is the worst-case scenario because:

  • Potassium lowers BP
  • Potassium improves endothelial function
  • Potassium opposes sodium’s renal effects

Many modern diets are:

  • Very high sodium
  • Very low potassium→ amplifying mortality risk beyond sodium alone.

4. Behavioral/Confounder Effects

While less important than physiology, high sodium intake often tracks with:

  • Higher consumption of processed foods
  • Higher calorie intake
  • More saturated fats
  • Lower intake of fruits/vegetables
  • Lower potassium/magnesium
  • More obesity and metabolic syndrome

Even after adjusting for these, the physiological signal remains—but confounders worsen the gradient.


5. The Threshold Where Mortality Rises

Across PURE, NHANES re-analyses, EPIC, and multiple meta-analyses:

  • >5–6 g/day sodium → increasing all-cause mortality
  • >7 g/day → sharper rise (mainly stroke)
  • >8–10 g/day → clear elevation in CVD deaths across all populations

This corresponds to:

  • Salt equivalent: 12.5 g salt → 15 g+ salt per day
  • This is common in people who eat lots of processed foods or restaurant food.

6. Combined Perspective

The right-arm mortality increase is driven by:

Primary drivers

  • Blood pressure elevation
  • Vascular injury
  • Stroke
  • LVH
  • CKD progression

Secondary drivers

  • Poor diet patterns
  • High sodium-to-potassium ratio
  • Salt sensitivity genetics

The biological mechanisms are far stronger than the confounders here.


7. Practical Numbers

  • Optimal sodium range for lowest all-cause mortality: 3–5 g/day sodium (≈7.5–12.5 g salt)
  • Clearly harmful range: >6 g/day sodium (+ BP rise, ↑ stroke risk)
  • Very high intake: >7–8+ g/day → measurable increase in CVD and all-cause mortality across almost all cohorts.

He said this in the text:

I know what you may be thinking. I have cherry picked one study to make a point. Well yes, this is just one study. However, it is the biggest and longest ever done. It represents one small part of the National Health and Nutrition Examination Survey (NHANES).

And, although it is only a small part, it represents very nearly ‘one-million-person years’ of observation. Of course, like all nutritional studies it has its weaknesses, but you will find nothing bigger, longer, or better than this. And if you want to find one that contradicts it – feel free – and good luck.

This is the full study, which has many more graphs like the one used. Most ages go up in a U shape, but that one was for people 40-60 and it did not.:

1 Like

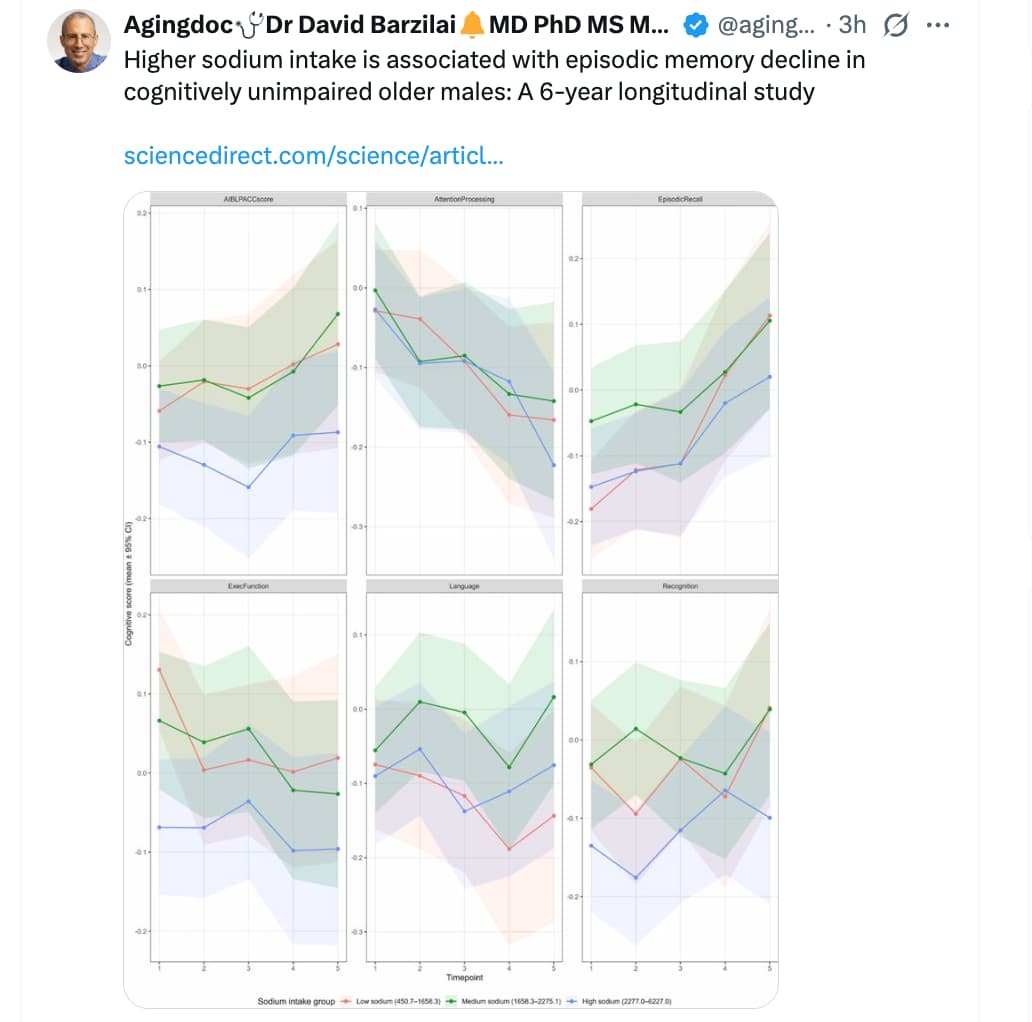
Higher sodium intake is associated with episodic memory decline in cognitively unimpaired older males: A 6-year longitudinal study

Highlights

  • Individuals’ sodium consumption is increasing.

  • Longitudinal analysis using data from 1208 older adults from AIBL study.

  • Decreasing sodium intake may be a protective factor against cognitive decline.

  • Cognitive decline in males specifically affected by higher sodium intake.

Open access paper: https://www.sciencedirect.com/science/article/pii/S0197458026000242?via%3Dihub

Apparently, almost everything that I like to eat accelerates aging. Some people, including one of my daughters, enjoy very low or no salt in their food. I do not need excess salt, but many things that I eat like steak and potatoes, are very bland without it
If food is not a joy to eat, I’m not interested.

2 Likes

As you know well, with age people’s ability to taste salt declines. This is a big reason why many elderly people tend to put a lot of salt in their food - I’ve observed this with a friend of mine who prided himself in being a great amateur chef. He loved throwing parties and serving up a feast he cooked. Well, when he moved into his 70’s, we all noticed his food got notably saltier, to the point where some of us could no longer enjoy it, while others who aged in concert with him kept loving it.

1 Like

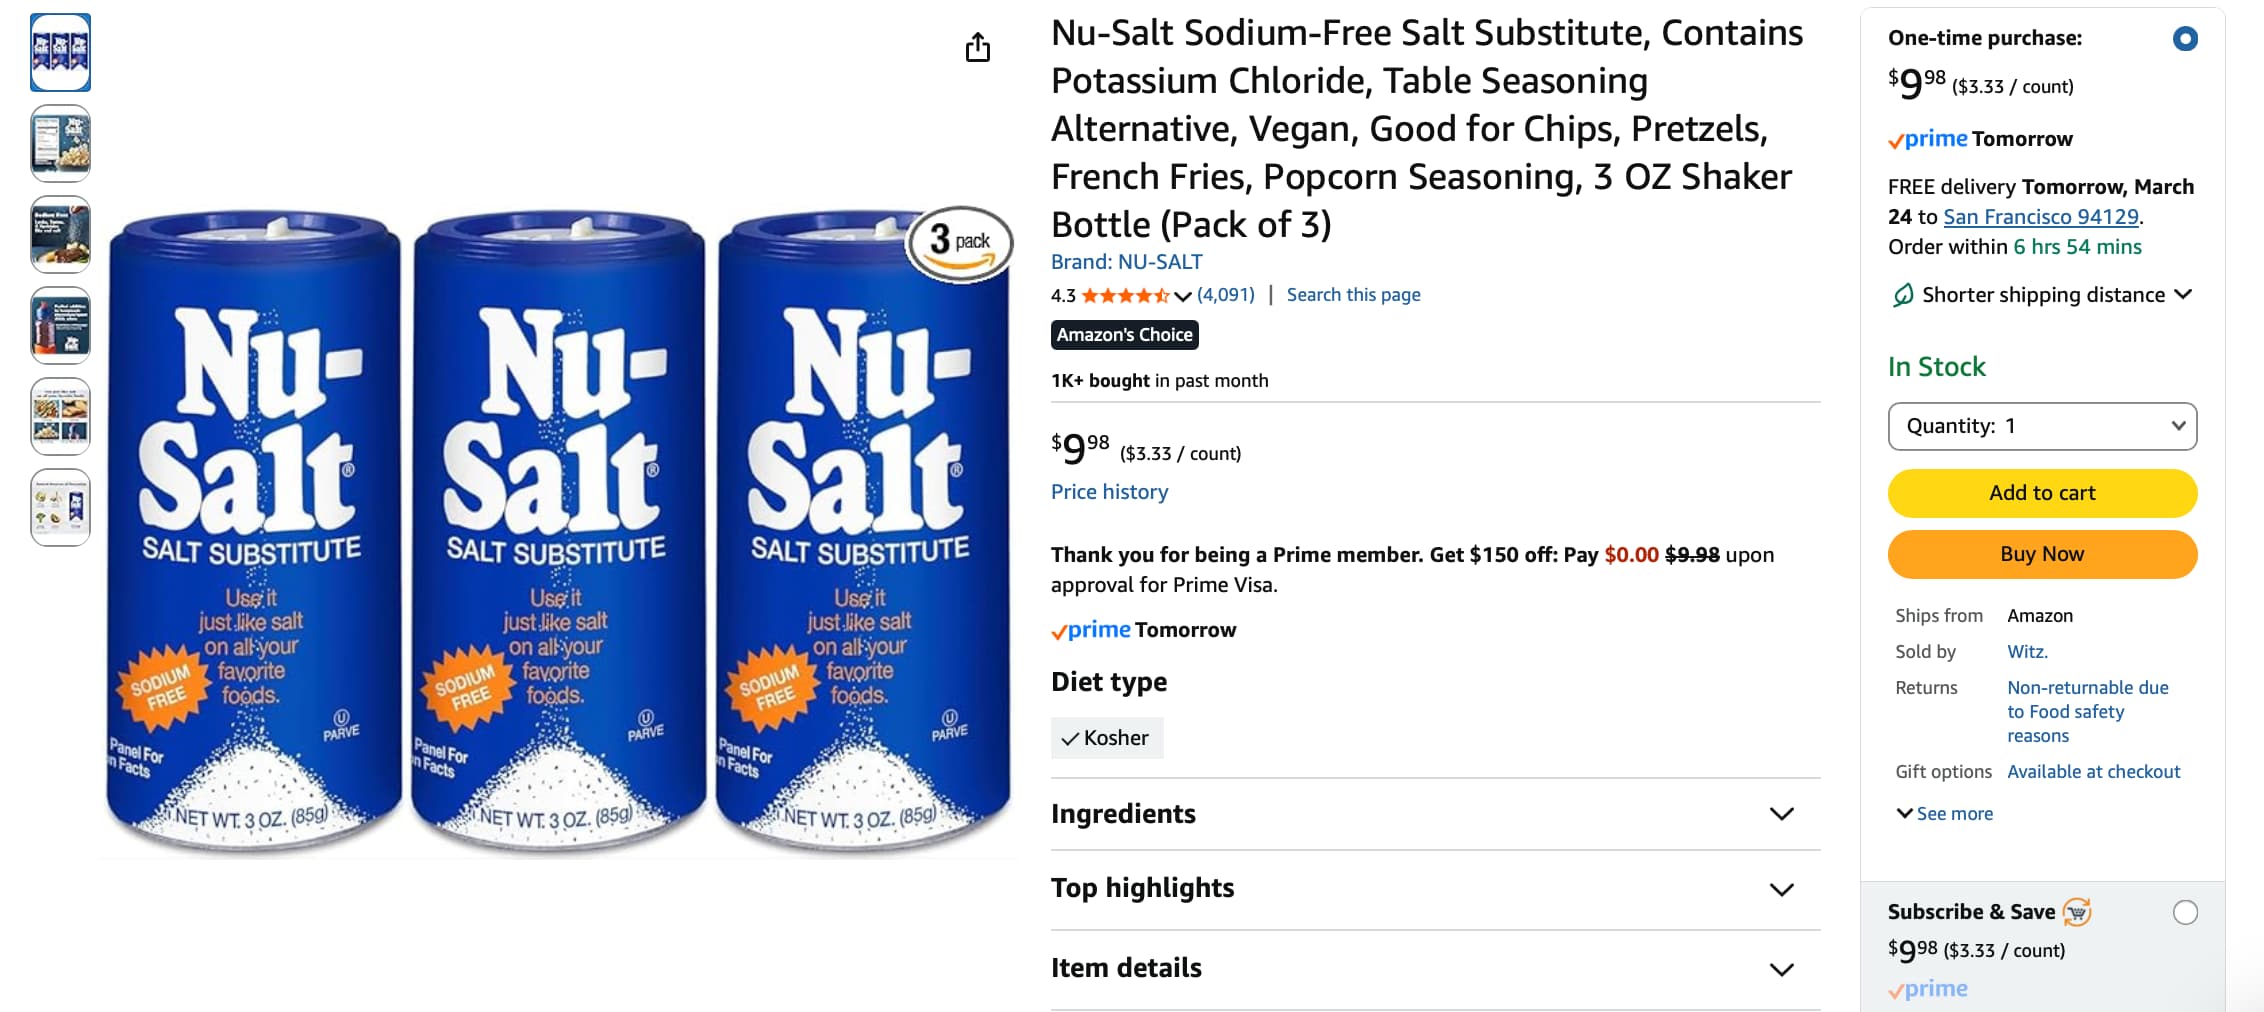
Try Nu-Salt…

1 Like

Acidity is important for taste like lime or lemon juice, vinegar. There’s also lots of salt-free spice mixes.

I still feel like excess sodium intake is insanely bad. Mostly if it has anything to do with increase in sustained hypertension with age.

As I have low blood pressure, LDL and triglycerides I personally am not worried about increased heart attack risk from salt intake. But there seems to be strong evidence it causes stomach cancer. You see this in Japan in places where they eat huge amounts of miso. So I would avoid excess intake regardless.

2 Likes

Nah, just as stevia doesn’t taste like sugar, the salt substitutes don’t taste like salt(to me).

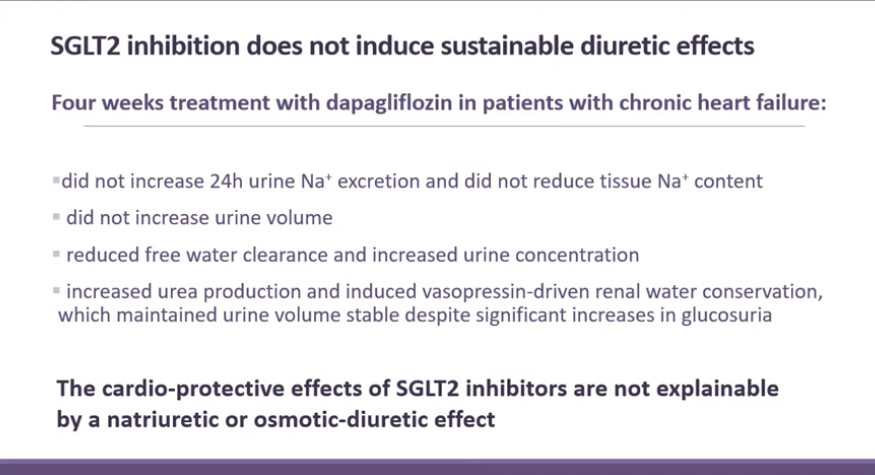
@Neo looks like Jens Titze et al have researched SGLT2 inhibitor dapagliflozin:

No detected effect on Na excretion or tissue Na content as far as I can tell.

Video from Aug, 2024, DAPA-Shuttle1 trial

2 Likes

Titze claimed also that dietary salt does not increase blood pressure through extra cell volume expansion, which is the common view. Makes sense in the scenario salt increases risk of chronic hypertension (regardless of later intake after diagnosis), and salt exposure might cause hypertension in some way seen as hypertension prevalence with aging?

This is also why excess salt intake might be bad even if you have low or normal blood pressure @Tilmitt

Paper: https://www.sciencedirect.com/science/article/pii/S0197458026000242

1 Like

I take a mix of potassium bicarbonate, sodium bicarbonate, sodium chloride and magnesium chloride for gout, which is working quite well as far as uric acid levels. The mix which I take daily gives me an intake of 1.78 g of sodium and 4.6 grams of potassium, along with 0.3 grams of magnesium. This gives a potassium:sodium ratio of 2.6. The daily intake of sodium chloride equivalent from the salt and baking soda is 4.54 gms/day. Which is ~3 grams higher than recommended. I do not have high blood pressure.

My reasoning is that the literature strongly suggests that it is not sodium intake that correlates with blood pressure in some individuals, but the potassium to sodium intake, that ideally should be 3:1. Rarely accomplished in an American diet, in fact, it is the inverse.

Aldosterone secretion is inversely proportional to sodium intake. And where it gets interesting is that aldosterone levels correlate well with measures of inflammation such as hsCRP, along with other pleiotropic effects on the heart and immune system.

My conjecture is that maybe pushing a low sodium intake of 1.5 grams a day, without paying attention to potassium intake, may not be ideal, for either normotensives, nor hypertensives, as it will result in relatively higher aldosterone levels and higher levels of inflammation, along with its less than ideal effects on the whole Renin-Angiotensin-Aldosterone System (RAAS).

Of course, there is a lot of interacting physiology here, in the context of genetic variations in response to diet.

1 Like

You should measure your urinary pH. I use citrate (I am nowhere near gout, but I use citrate anyway). My urinary pH a few minutes ago was about 9.5.

I personally I am not a fan of supplementing chloride and I have not tried bicarbonate in recent years (when I have been measuring everything). I would be, however, interested in any reasons why bicarbonate is better than citrate for alkanizing.

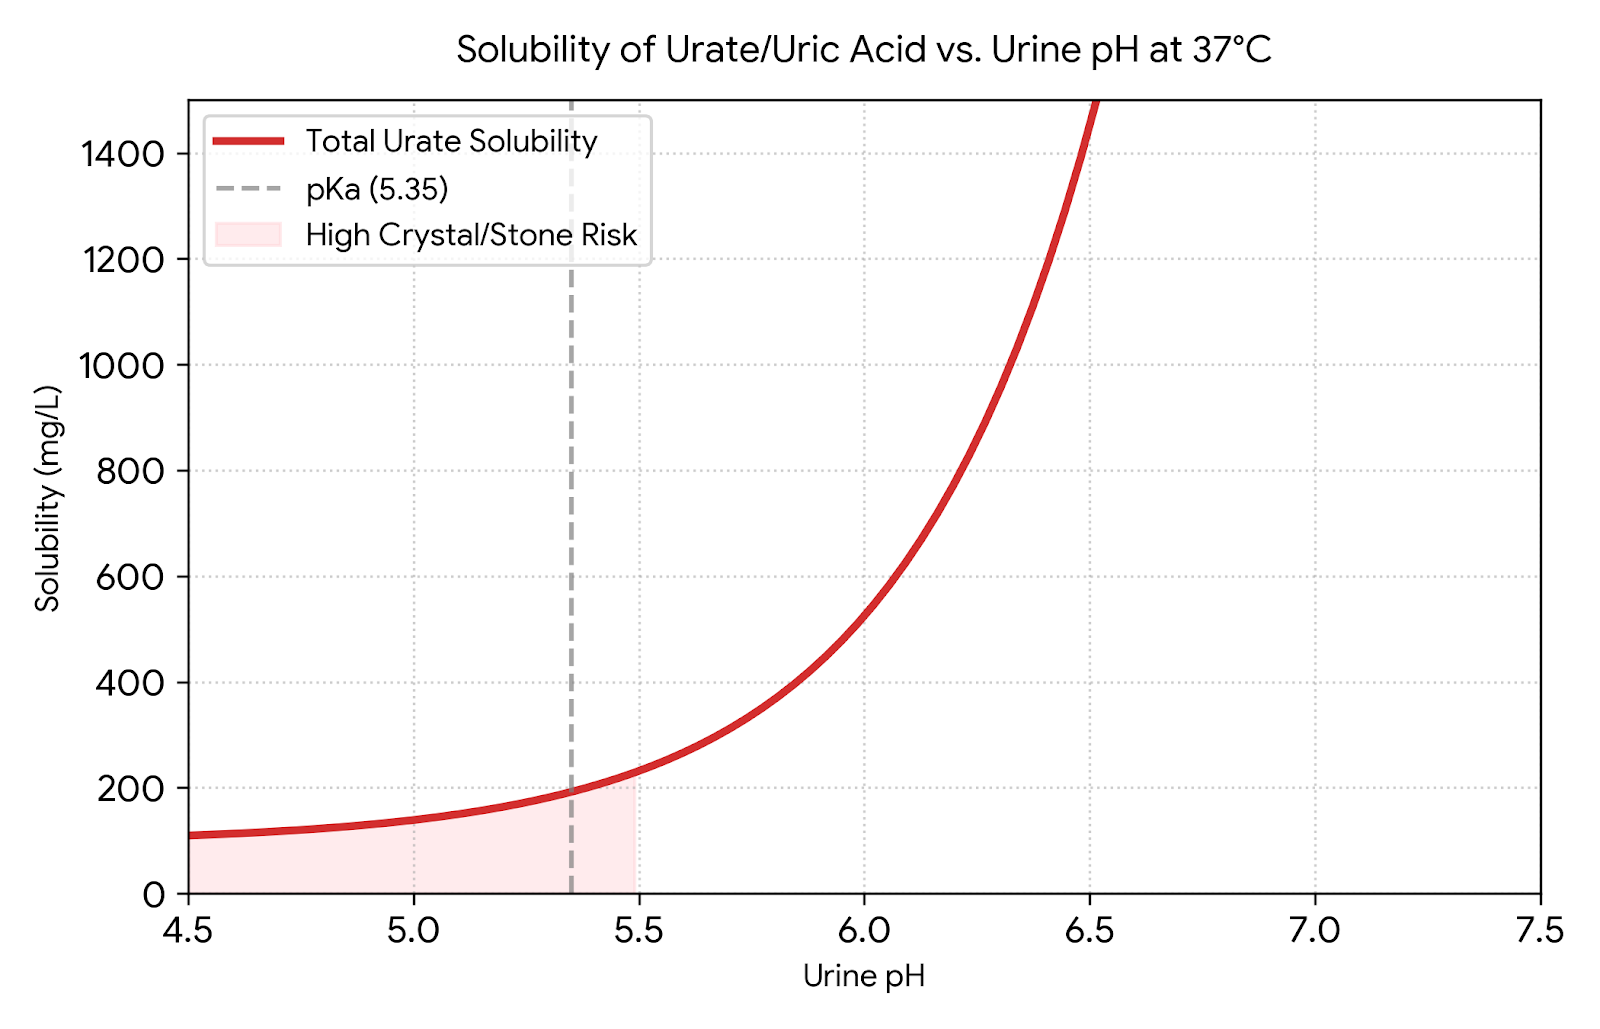
Here is part of a chatGPT (5.5 paid) answer about the solubility of urate (uric acid) in urine at various pHs.

Below is an approximate theoretical chart of total uric acid/urate that could remain dissolved across the usual urine pH range. I used:

[
\text{Total dissolved urate species} \approx 96 \times (1 + 10^{pH-5.35}) \text{ mg/L}
]

This assumes an undissociated uric acid solubility of about 96 mg/L at 37°C and a pKa around 5.35. In real urine, sodium, potassium, ammonium, ionic strength, temperature, and nucleation surfaces can alter this. Urine pH commonly ranges roughly 4.8–7.4, and low urine pH is a key driver of uric acid crystallisation. (PMC)

Urine pH Approx. dissolved total urate species, mg/L Approx. mmol/L
4.8 123 0.73
5.0 139 0.83
5.2 164 0.98
5.35 192 1.14
5.5 232 1.38
5.8 367 2.18
6.0 525 3.12
6.2 776 4.61
6.5 1,452 8.64
6.8 2,802 16.67
7.0 4,384 26.08
7.2 6,892 41.00
7.4 10,867 64.64

The main point is that small pH shifts matter a lot. Moving urine from pH 5.0 to 6.0 increases estimated soluble urate species by roughly 3.8-fold; moving from 5.0 to 6.5 by roughly 10-fold. This is why uric-acid stone prevention/dissolution strategies often focus on urine alkalinisation, while avoiding over-alkalinisation because of other stone risks.

If people are being cautious they target 6.8 as that reduces the risk of CaP stones.

2 Likes

Gemini did a nice chart

1 Like

I measure urine pH at least once or twice a day and it stays >8, and as you point out, this is key to keeping urate in solution and increasing its renal clearance. I take potassium bicarbonate and a bit of sodium bicarbonate instead of potassium citrate (I assume this is the form of citrate you are using). When the citrate is metabolized the strong anions K+, it drives up the pH. KHCO3 is a more direct way of achieving the same aim. I find citrate upsets my stomach a tad, and both bicarbonates are cheaper. I also don’t have calcium stones, so I don’t need the citrate in the urine. Potassium bicarbonate also lowers bone turnover and keeps the K:Na ratio closer to 3, which may help with blood pressure, though I do not have that problem, at least for now. I was influenced by the reports of inflammatory effects of aldosterone, so while waiting for further data, figured a bit more Na in the diet is not a bad thing, if counterbalanced by additional K.

1 Like

Nice chart! Thanks! Taking it to my rheumatologist at our next meeting! He is still sceptical in spite of much literature on urinary alkalinization driving down serum urate. Also in spite of my success: went from ~10 to 5.2 mg/dL over a few months with no attacks. But at least he continues to work and care for an unusually idiosyncratic patient, unlike other physicians I have known.

Forgot to mention another reason I add NaCl to the mix. I drink 54 oz of the electrolyte mix in RO water a day. I added a bit of salt because because when I first started the regimen, I was peeing a whole lot, which meant on the physiological level, that I was supressing vasopressin (anti-diuretic hormone) by diluting the Na level in blood with “free water,” as the nephrologists like to call it, so the kidneys immediately responded to lower vasopressin levels by opening up the gates.

I don’t worry about this myself, but there is an argument that going over 6.8 runs the risk of Calcium Phosphate stones.

1 Like