Like many of you, I have used Aging.AI3.0 to guess my age in order to assess the results of my recent labwork. Aging.AI is a deep neural network trained on hundreds of thousands of human blood tests.
Unfortunately, like all neural networks, Aging.AI is a black box. Which of my biomarkers are good, and which could use improvement? Of those with opportunity for improvement, which would have the greatest impact? Is a higher or lower value more strongly associated with a youthful phenotype for a given biomarker?
To answer these questions, I’ve written aging.ai-optimizer - a Python script which supports:
- Collecting aging.ai predictions for various points across the reference range for all biomarker, keeping the other biomarkers constant
- Generating scatter plots and regressions of the predictions
- Calculating the optimal value for each biomarker, given a set of predictions
- Calculating the potential year reduction for each biomarker by achieving the optimal value
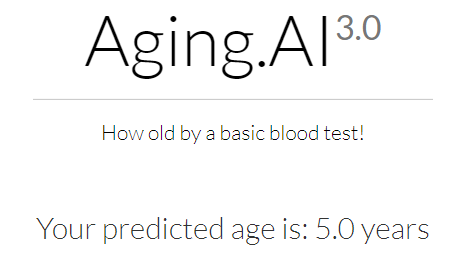
My chronological age is 33 and Aging.ai predicted an age of 24. By achieving optimal values on all biomarkers, I could achieve a predicted age as low as 5.

| Biomarker | Actual | Optimal | Optimized age | Years gained |
|---|---|---|---|---|
| Albumin | 4.7 | 5.1 | 22 | 2 |
| Glucose | 96 | 72.48 | 21 | 3 |
| Urea | 21 | 16.98 | 24 | 0 |
| Cholesterol | 102 | 100 | 24 | 0 |
| Protein_total | 6.8 | 6.15 | 24 | 0 |
| Sodium | 140 | 137 | 23 | 1 |
| Creatinine | 1.05 | 0.57 | 18 | 6 |
| Hemoglobin | 14.1 | 13.98 | 24 | 0 |
| Bilirubin_total | 0.4 | 0.05 | 23 | 1 |
| Triglycerides | 43 | 5 | 23 | 1 |
| HDL_Cholesterol | 59 | 40.83 | 24 | 0 |
| LDL_cholesterol | 31 | 47.3 | 24 | 0 |
| Calcium | 9.4 | 10.19 | 22 | 2 |
| Potassium | 4.6 | 4.42 | 24 | 0 |
| Hematocrit | 42.8 | 44.02 | 24 | 0 |
| MCHC | 32.9 | 35.66 | 23 | 1 |
| MCV | 88.4 | 79 | 22 | 2 |
| Platelets | 211 | 319.46 | 23 | 1 |
| Erythrocytes | 4.84 | 5.26 | 23 | 1 |
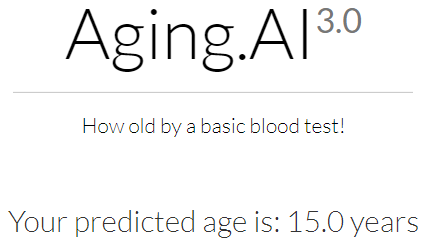
But improving just three biomarkers (glucose, albumin, and creatinine) to optimal would lower my predicted age to 15.

After calculating regressions for Aging.ai predictions across the all biomarker reference ranges, I also discovered some interesting patterns: Aging.ai Biomarker Predictions and Regressions
Biomarkers where lower is better:
- Bilirubin
- Cholesterol (Total)
- Creatinine
- Glucose (plateau at 80)
- HDL (plateau at 64)
- MCV
- Protein (plateau at 7.2)
- Triglycerides
Biomarkers where higher is better:
- Albumin (plateau at 5)
- Calcium
- Erythrocytes
- MCHC
Biomarkers with a u-shaped curve:
- Hematocrit
- Hemoglobin
- LDL
- Platelets
- Potassium
- Sodium
- Urea
(“better” = Lower Aging.ai predicted age)
Please feel free to use aging.ai-optimizer to calculate your own optimal biomarker values - after testing with a few different sample sets, it appears that optimal values can vary significantly between individuals.