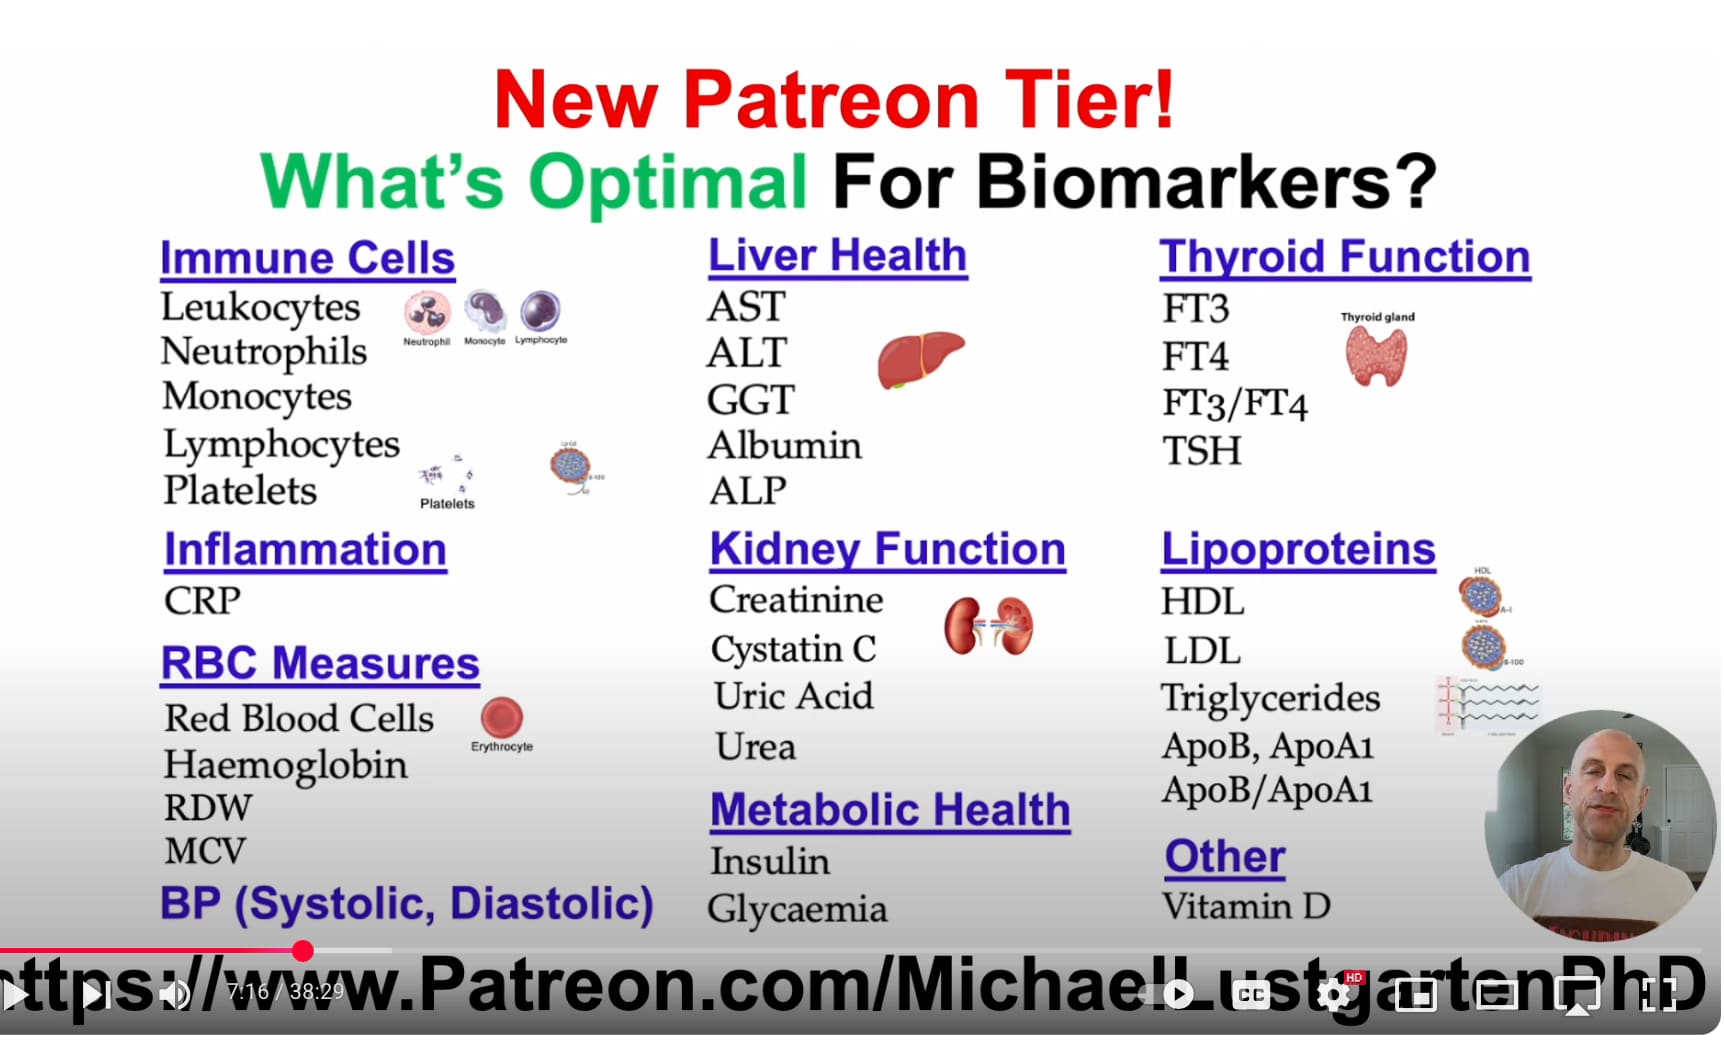
Here is a comprehensive table of optimal (not just normal) human blood biomarker ranges for healthspan/longevity, organized by category: immune, inflammation, RBCs, liver, kidney, hormones, metabolism, thyroid, lipids, vitamins, and blood pressure. These values reflect evidence-based, functional medicine-informed targets rather than conventional reference ranges, which often include unhealthy populations.
 IMMUNE CELLS & FUNCTION
Marker Optimal Range Notes
WBC Count 4.0 – 6.0 x10⁹/L Low-normal better; high may indicate inflammation
Neutrophils 40 – 60% Balance with lymphocytes is key
Lymphocytes 30 – 50% Crucial for adaptive immunity
Neutrophil-to-Lymphocyte Ratio (NLR) 1.0 – 2.0 Higher values linked to chronic inflammation and mortality
Monocytes 4 – 8% Elevated in chronic infection, inflammation
Eosinophils <3% Elevated in allergy or parasitic infection
Basophils <1% Rarely elevated unless allergic/inflammatory disease
 INFLAMMATION MARKERS
Marker Optimal Range Notes
hs-CRP <0.5 mg/L <1.0 is low risk, <0.5 optimal
IL-6 <1.0 pg/mL Lower is better; high linked to frailty
TNF-alpha <2.5 pg/mL Lower is better
ESR <10 mm/hr Nonspecific, but elevated in chronic inflammation
Fibrinogen 200 – 300 mg/dL Higher levels = clotting/inflammation risk
 RBC & OXYGEN CARRYING CAPACITY
Marker Optimal Range Notes
Hemoglobin (M/F) 13.5–15.5 / 12.5–14.5 g/dL Too high or low is problematic
Hematocrit 40 – 47% Higher increases viscosity risk
RBC Count 4.5 – 5.3 x10¹²/L Elevated in dehydration or hypoxia
MCV 85 – 92 fL Micro/macrocytosis outside range
RDW <13% Higher values linked to mortality
Ferritin 50 – 100 ng/mL Optimal balance; >150 = inflammation/oxidative risk
 LIVER FUNCTION
Marker Optimal Range Notes
ALT <25 U/L Lower values linked to longevity
AST <25 U/L AST:ALT ratio >1 may indicate mitochondrial damage
GGT <20 U/L Sensitive marker for oxidative stress
ALP 40 – 80 U/L Higher in bile duct disease
Bilirubin (total) <1.0 mg/dL Mild elevation may be protective (e.g., Gilbert’s)
 KIDNEY FUNCTION
Marker Optimal Range Notes
Creatinine M: 0.8–1.1 / F: 0.6–0.9 mg/dL Muscle mass dependent
eGFR >90 mL/min/1.73 m² >60 acceptable; >90 optimal
BUN 10 – 16 mg/dL High may indicate catabolism or kidney issues
BUN:Creatinine Ratio 10 – 16 Higher suggests dehydration
Uric Acid 4 – 5.5 mg/dL >6 = increased metabolic/CVD risk
Cystatin C <1.0 mg/L More accurate renal marker than creatinine
 HORMONES (MIXED SEXES; ADJUST FOR AGE/SEX)
Marker Optimal Range Notes
Testosterone (free) M: 15–25 ng/dL / F: 1.0–2.5 ng/dL Decline with age; free T more relevant than total
Estradiol (E2) M: 15–35 pg/mL / F: cyclic (20–250) Low E2 = bone/cardiovascular risk
DHEA-S Age-adjusted: 200–400 μg/dL in 30s Falls with age; longevity-linked
IGF-1 100–200 ng/mL Lower end may favor longevity
SHBG 30 – 60 nmol/L High = low free sex hormones
Progesterone F: 1–10 ng/mL (luteal); M: 0.1–0.3 Balances estrogen effects
 METABOLIC HEALTH
Marker Optimal Range Notes
Fasting Glucose 70 – 85 mg/dL <90 is low risk; >100 is prediabetic
HbA1c 4.8 – 5.2% <5.0% ideal for longevity
Fasting Insulin 2 – 5 μIU/mL Higher values = insulin resistance
HOMA-IR <1.0 Calculated from glucose and insulin
Lactate 0.5 – 1.5 mmol/L Elevated = mitochondrial dysfunction
Ketones (fasted) 0.3 – 0.7 mmol/L Mild ketosis may benefit metabolism
 THYROID FUNCTION
Marker Optimal Range Notes
TSH 0.5 – 2.0 mIU/L >2.5 suggests early hypothyroidism
Free T4 1.1 – 1.6 ng/dL Low with high TSH = hypothyroid
Free T3 3.2 – 4.2 pg/mL Higher normal correlates with energy/metabolism
Reverse T3 <15 ng/dL High = stress or metabolic slowdown
TPO antibodies Undetectable Autoimmune marker
 LIPIDS & CARDIOVASCULAR MARKERS
Marker Optimal Range Notes
LDL-C (direct) <80 mg/dL ApoB better marker for atherogenicity
ApoB <65 mg/dL Better than LDL for CVD risk
HDL-C >60 mg/dL Higher = protective
Triglycerides <70 mg/dL Lower is better for metabolic health
TG/HDL Ratio <1.0 Best lipid predictor of insulin resistance
Lp(a) <30 mg/dL Genetically driven; hard to lower
hs-CRP <0.5 mg/L Covered above; also CVD relevant
 VITAMINS & MICRONUTRIENTS
Marker Optimal Range Notes
Vitamin D (25(OH)D) 40 – 60 ng/mL >60 offers no benefit; <30 is deficient
B12 500 – 900 pg/mL Methylmalonic acid more specific
Folate >10 ng/mL Needed for methylation, RBCs
Homocysteine 5 – 8 μmol/L Elevated in B-vitamin deficiency, CVD risk
Magnesium (RBC) 5.0 – 6.5 mg/dL RBC magnesium better than serum
Zinc 90 – 120 μg/dL Balance with copper matters
Copper 70 – 110 μg/dL Copper:zinc ratio ~0.8–1.0 optimal
 BLOOD PRESSURE
Marker Optimal Range Notes
Systolic BP 100 – 120 mmHg <130 still acceptable
Diastolic BP 65 – 80 mmHg <60 may impair perfusion
Pulse Pressure 30 – 50 mmHg Higher = arterial stiffness
If you’d like, I can generate a printable or spreadsheet version of this for ongoing tracking, or create a personalized version based on your lab results.