Yes, besides a pronounced effect on metabolic acidosis, a complication of kidney disease, I am running faster with greater ease, probably because of a reduction in lactate.
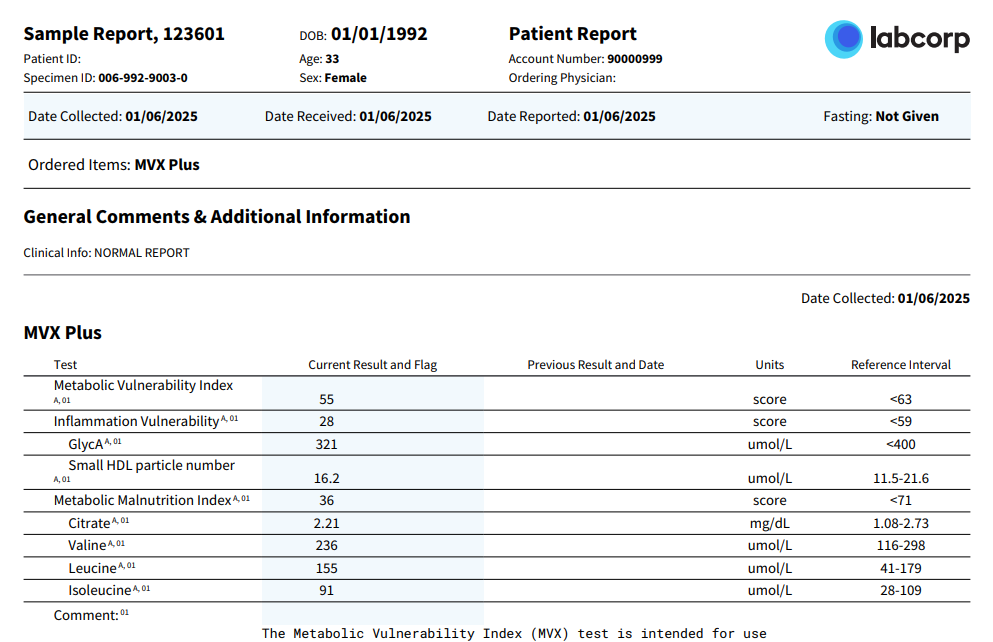
Yep, that’s what my report looks like
This Plus version comports with the detail covered in the Attia podcast and the large scale studies I have been reading. Comparing the two report numbers at LabCorp (#123590, #123601), it looks like the additional charge for the Plus is a way to cover the costs of the research that went into developing the last round of algorithms.
Vascular aging index, Frailty index, Metabolic vulnerability index, and the Klemera-Doubal method are all solid biomarkers to look at.
1 Like
I think it be better to look at the underlying biomarkers. When you start creating collective indices you end up losing information.
1 Like
Linked earlier in this thread
1 Like
I may have missed it in this thread, but I was curious what the optimal measure ranges in the MVI are for health and longevity. Here is what Claude suggests. Do you agree? People who have done the test - how did your results come in, with regard to these ranges?
MVX components: target ranges for healthspan/lifespan
Speaking as an endocrinologist, with the caveat up front that no published optimal ranges exist for these analytes as longevity targets. The MVX was derived in sick cohorts (CATHGEN + Intermountain catheterization patients, then heart failure) to predict near-term death. What follows is my synthesis of the mortality epidemiology plus population distributions — clinical judgment, not a validated cut-point set.
The six analytes
| Analyte | Direction in MVX | Population anchor | My approximate optimum | Confidence |
|---|---|---|---|---|
| GlycA | ↑ = worse | MESA mean 381 ± 62 µmol/L; Labcorp decision limit ≥400 = high | 250–330 µmol/L (≤350 acceptable) | Good |
| Small HDL-P | ↓ = worse (protective) | No published reference interval; UKB/Nightingale median 9.7 µmol/L [8.9–10.6], Labcorp scale runs higher | Upper half of your platform’s distribution — chase the percentile, not a number | Weak |
| Citrate | ↑ = worse | NMR healthy median 1.85 mg/dL (F 1.92 / M 1.72); healthy 95% interval 1.48–2.97 | 1.5–2.0 mg/dL (~78–104 µmol/L) | Moderate |
| Valine | ↓ = worse | LURIC Q1 <191 µmol/L → HR 2.01 vs Q4 >326 | 220–290 µmol/L | Moderate |
| Leucine | ↓ = worse | LURIC Q1 <102 µmol/L → HR 1.98 vs Q4 >179 | 120–165 µmol/L | Moderate |
| Isoleucine | ↓ = worse | LURIC Q1 <53 µmol/L → HR 1.80 vs Q4 >91 | 60–85 µmol/L | Moderate |
Composite scores (1–100, sex-standardized, higher = worse): the report flags MVX <63 / IVX <59 / MMX <71 as “low risk,” but those are disease thresholds. A kidney-transplant cohort averaged MVX 42 ± 11. For longevity purposes I’d want the lowest population quartile — MVX ≤35–40.
The three things that should bother you about this panel
1. The BCAA direction is inverted relative to longevity biology. MVX scores low BCAAs as bad because in catheterization and heart failure cohorts, low BCAAs mark catabolism, sarcopenia and protein-energy wasting. But isoleucine restriction extends lifespan ~33% in male mice and improves healthspan even when started late, and high-normal BCAAs predict incident T2D and insulin resistance in healthy adults. So the curve is almost certainly U-shaped, and MVX only sees the left limb. This is why I’ve put the optimum in the upper-middle rather than the top quartile: never be in the bottom quartile, don’t try to be in the top. In a metabolically healthy 45-year-old, a “low” MMX driven by top-decile BCAAs is not reassuring.
2. Small HDL-P is directionally contested. Within MVX (and in sepsis/infection-death cohorts) low small HDL-P predicts mortality. In classical atherosclerosis epidemiology, small HDL particles correlate positively with CVD risk. The discrepancy traces to different NMR deconvolution algorithms (LP3 vs LP4 subclass boundaries) and different outcomes. Don’t treat it as a clean target until you know which algorithm produced your number.
3. Units are not portable. Labcorp’s Vantera reports GlycA in µmol/L against a <400 cut-point and citrate in mg/dL; Nightingale reports different absolute values on a different calibration. A UK Biobank-derived quartile is not your Labcorp quartile. Only compare within-platform.
Effect size reality check
In UK Biobank (274,092 participants, 13.7 years, 24,241 deaths), MVX gave HR 1.12 per SD, with Q4 vs Q1 at 1.21 after full adjustment. In the multimorbidity analysis, ~1.23–1.32 per SD. That is a real population signal and a weak individual one. The panel is better read as a composite readout of inflammation + nutritional/mitochondrial adequacythan as six independent levers — and the two most actionable inputs are GlycA (falls with exercise, weight loss, statins, resolving occult inflammatory foci) and adequate protein intake with resistance training (raises BCAAs and small HDL-P from the frailty end without pushing into the insulin-resistant end).
Sources: Metabolic Vulnerability Index thread, rapamycin.news · Labcorp MVX by NMR · Labcorp MVX Plus · Labcorp GlycA · MVX in UK Biobank, Redox Biology · Multimarkers of metabolic malnutrition and inflammation, Lancet Healthy Longevity · MVX in heart failure, JACC: Heart Failure · MVX and multimorbidity, Nutrients · BCAAs and mortality, LURIC · NMR citrate reference intervals · GlycA distribution in MESA · Isoleucine restriction and lifespan, Cell Metabolism · Late-life isoleucine restriction, Nature Aging · MVX patent application
I took another look at my results, and noticed that citrate levels seemed outside of the “optimal” range
For my case, AI suggested a B-complex blend of vitamins to help drive citrate down, and thus improve cellular fuel processing at the mitochondria. Glynac was also suggested as a complementary intervention that plays the role of mitochondrial ROS protection. Antioxidants (Glynac) prevent enzyme breakdown, while cofactors (e.g. B2, B3) drive the chemical conversions forward. Retest in 9-12 weeks.
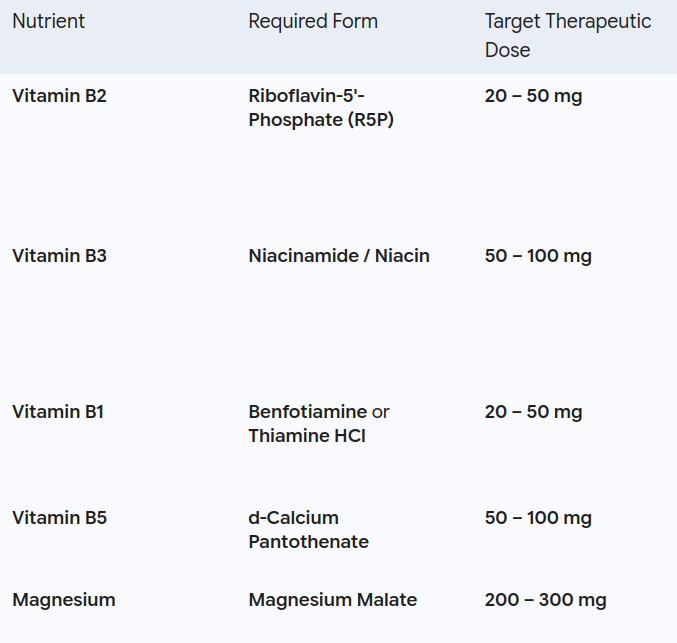
1 Like
I would be interested in seeing the AI reasoning for this.
This seems to be the core of its argument
1 Like
The problem with this analysis is that citrate exists in separate pools. There is citrate inside mitochondria and that in the cytosol (and nucleus) and the nuclear and cystosolic pools of acetyl-CoA are functionally distinct. Citrate does not move across the mitochondrial or cellular membrane without a transport protein.
OK, this seems to to make more sense, especially since it looks like citrate in those different pools serves different purposes. In mitochondria: citrate is used fuel to the Krebs cycle and ATP production.
In the cytosol and nucleus, it’s used to fuel fatty acid synthesis (ie store fat), cholesterol synthesis, and histone acetylation. Now suppose that you’re on medication that suppresses lypolysis so that you start producing elevated amounts of free fatty acids. Here are some things that might lead to elevated citrate levels:
- As FFAs flood the liver and peripheral tissues, they are turned into acetyl-CoA, and excess acetyl-CoA accumulates and combines with available oxaloacetate to form citrate
- When muscle and kidney cells are saturated with fatty acid oxidation products, they downregulate or slow down the uptake of circulating citrate
- kidneys are a primary site of blood citrate filtering and reabsorption.Changes in urinary pH, systemic acid-base balance, or renal transport dynamics can reduce renal uptake of serum citrate, leaving higher concentrations circulating in the blood
My MVX test results, and Claude analysis. I asked it to analyze my results and for tips on how to optimized further the results.
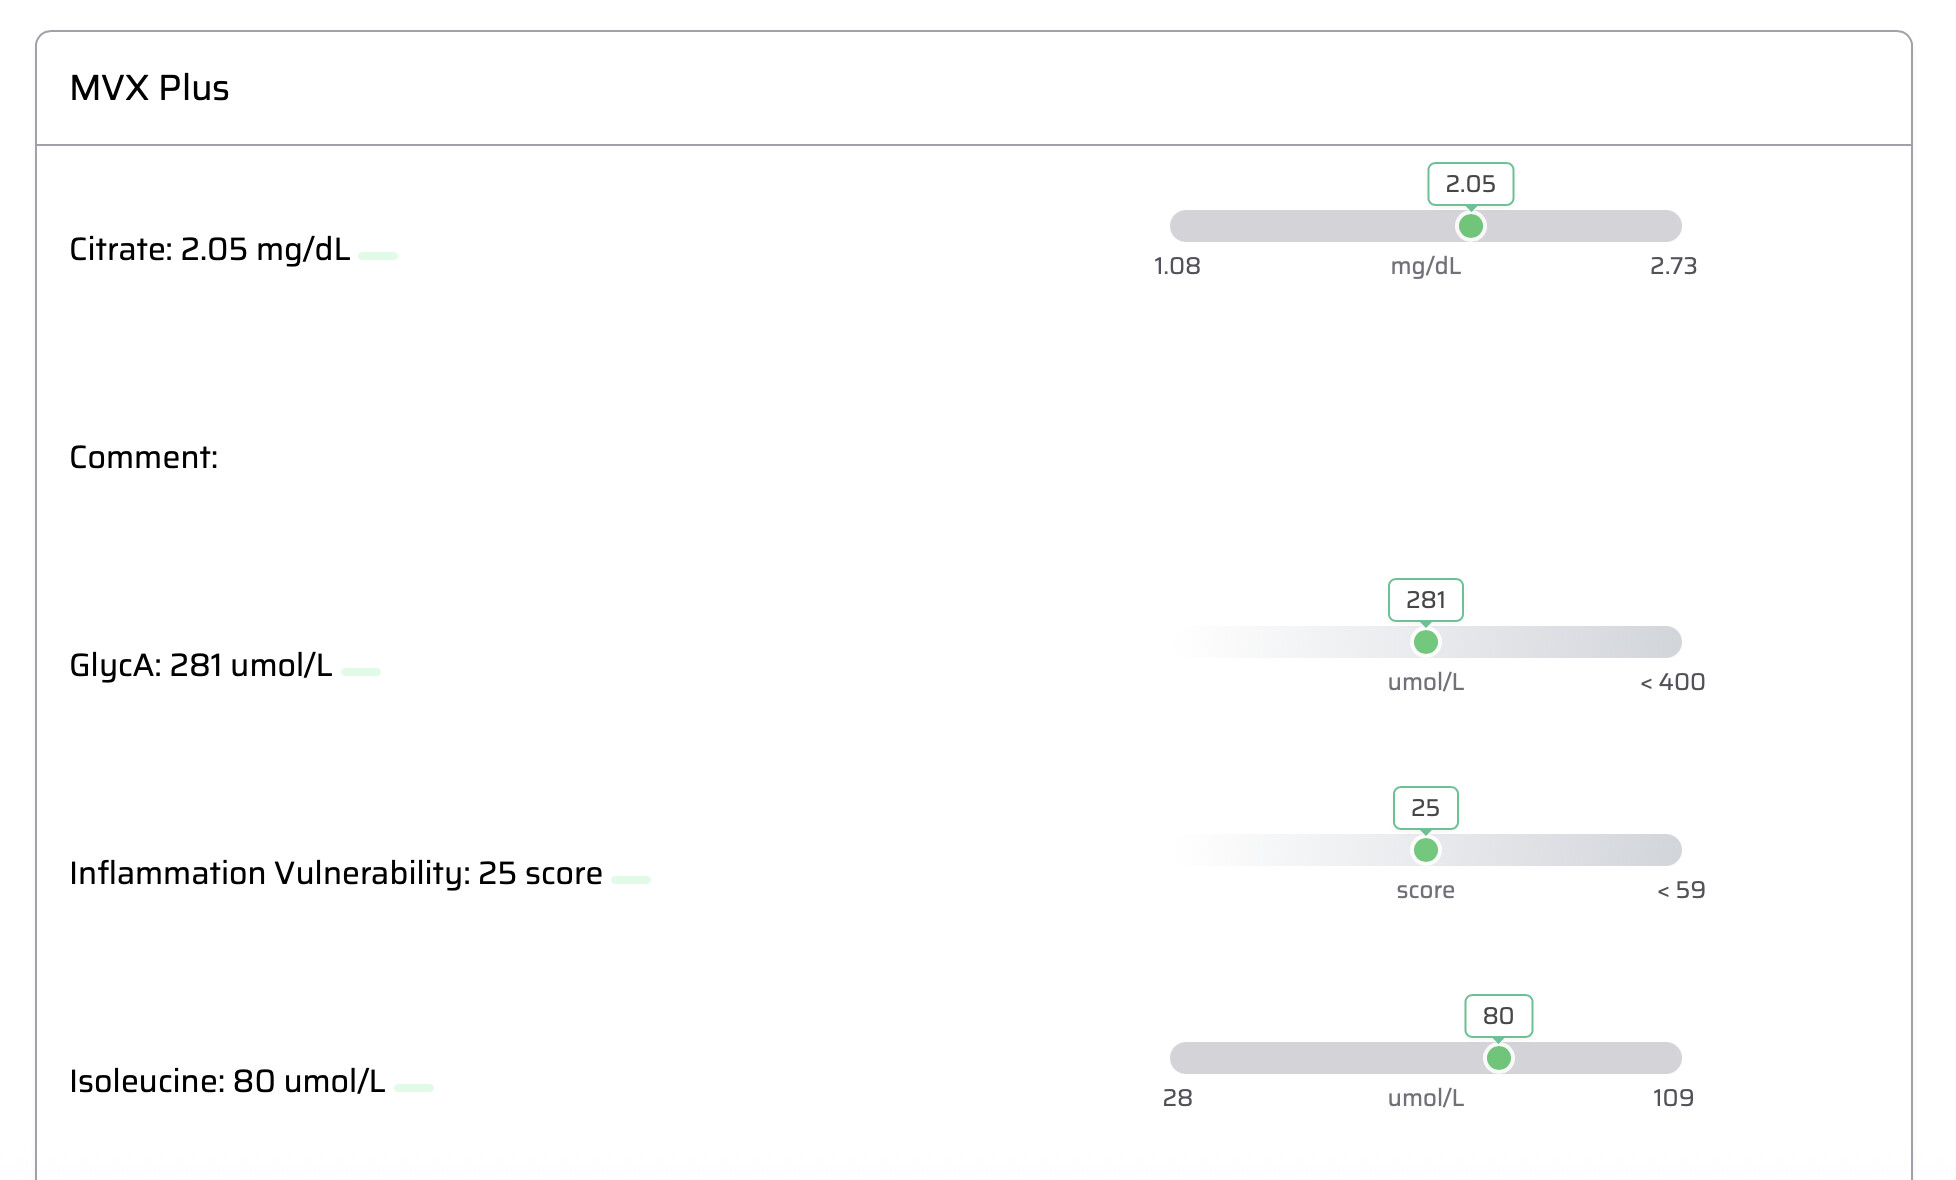
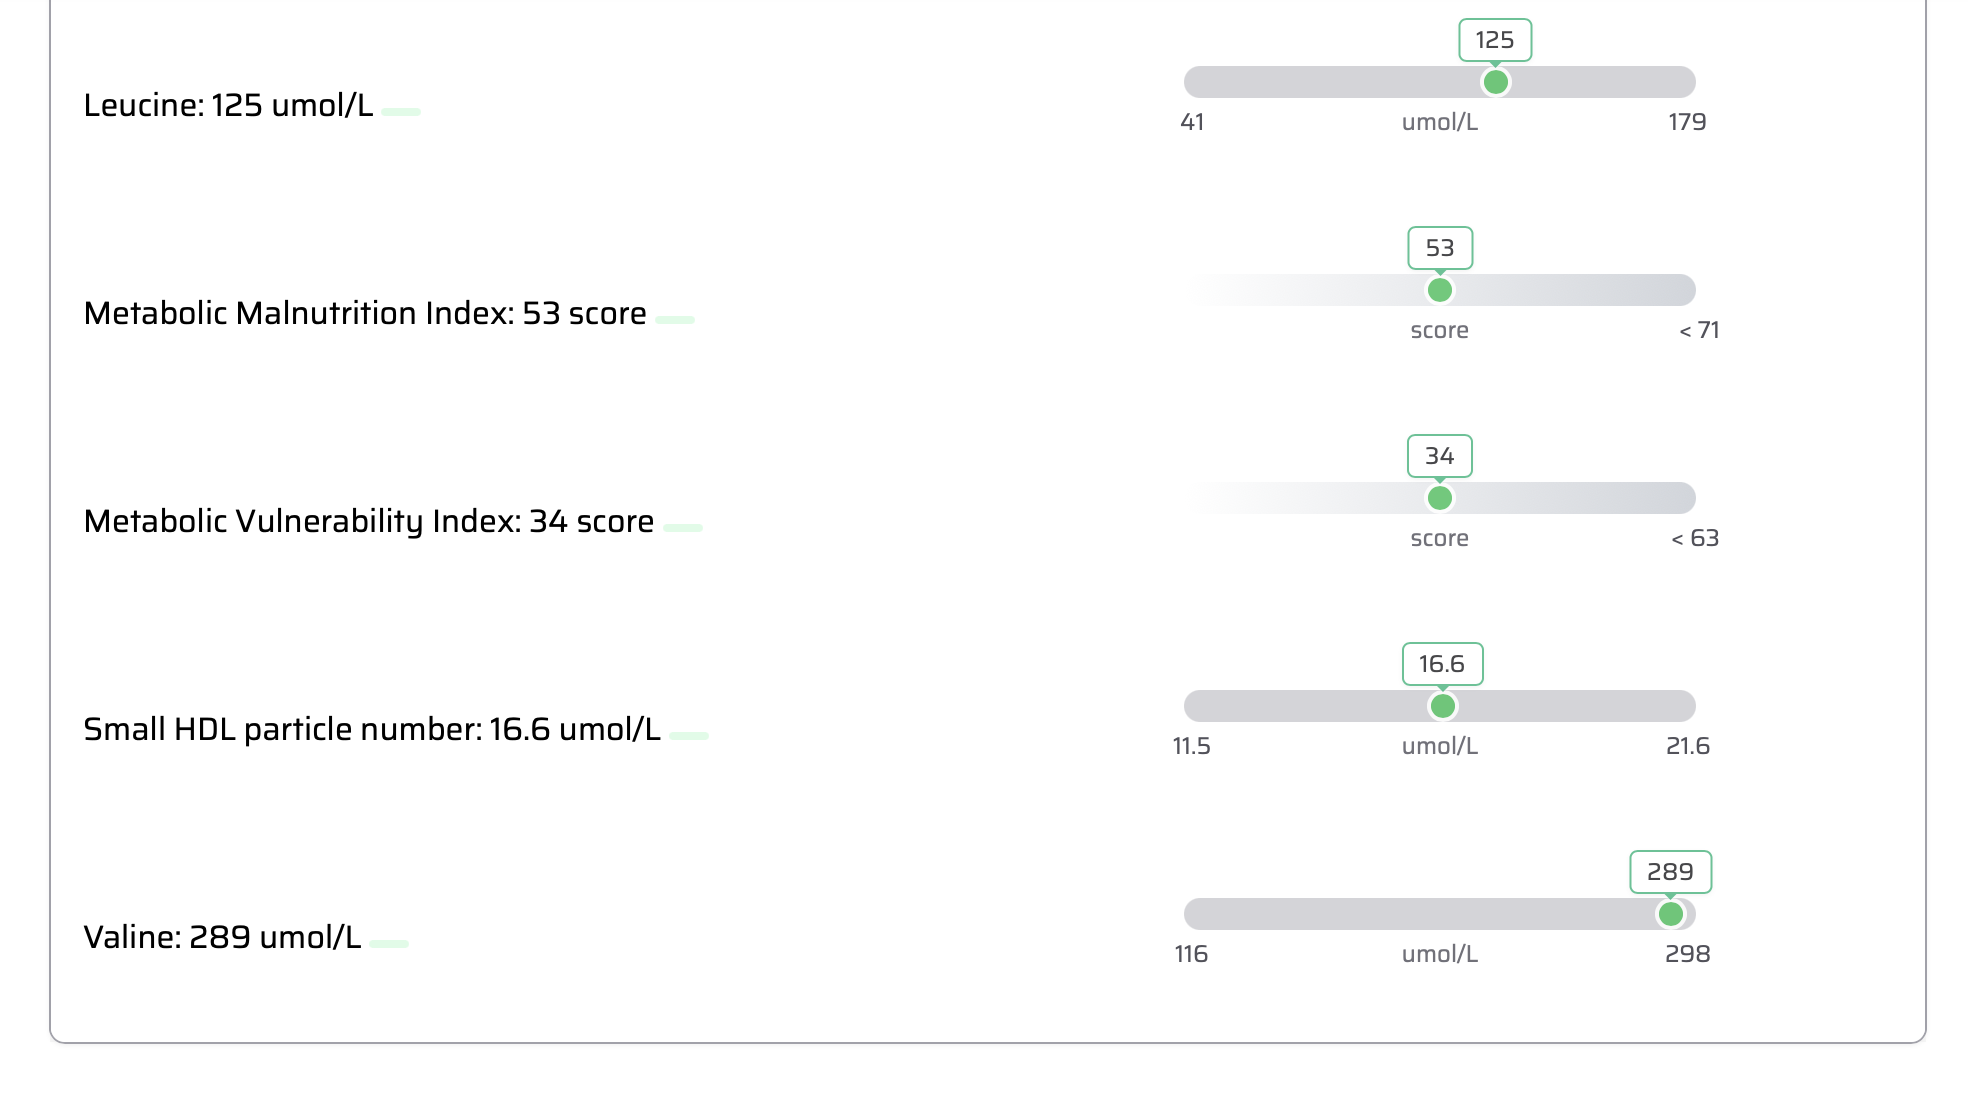
Bottom line
- MVX 34 sits around the 11th percentile of a general-population cohort measured on the same Labcorp platform. (confidence: moderate-high)
- Nearly all of that advantage comes from the inflammation side. GlycA 281 is in roughly the lowest 5 to 10 percent of the population, and it’s the most heavily weighted input. (confidence: high)
- The malnutrition subscore (MMX 53) is average, but not because of malnutrition. High valine and isoleucine are pushing it up. In a well-fed adult, that pattern points more toward protein timing, supplements, or reduced BCAA oxidation (an insulin-resistance signature) than toward wasting. That’s the one item worth running down. (confidence: moderate)
The right reference frame
Both attached papers used UK Biobank’s Nightingale NMR data, which runs on a different scale from Labcorp’s Vantera analyzer. UKB median GlycA was 803 µmol/L, and the npj paper reports a raw MVX of 27 ± 2.9 rather than a 1 to 100 score. UKB samples were also non-fasting. Their quartile tables can’t be used to place your values.
The closest comparator is PREVEND, a Dutch general-population cohort where fasting EDTA plasma was sent to Labcorp and analyzed by NMR on a Vantera analyzer, with a mean age of 54.
| Marker | Your value | PREVEND mean (SD) | Approx. percentile | Direction in model | Read |
|---|---|---|---|---|---|
| MVX | 34 | 44.9 (9.0) | ~11th | lower is better | Favorable |
| IVX | 25 | 39.3 (10.5) | ~9th | lower is better | Very favorable |
| MMX | 53 | 54.3 (6.4) | ~42nd | lower is better | Average |
| GlycA | 281 | median 373 (IQR 337-416) | ~5th-10th | lower is better | Excellent |
| Small HDL-P | 16.6 | 15.9 (2.4) | ~61st | higher is better | Middling |
| Leucine | 125 | 104 (27) | ~78th | protective in this range | Favorable |
| Valine | 289 | 201 (38) | ~99th | U-shaped | Past the optimum |
| Isoleucine | 80 | 58 (15) | ~93rd | higher is worse | Unfavorable |
| Citrate | 2.05 mg/dL (~107 µM) | 2.09 (0.48) | ~47th | higher is worse | Average |
The percentiles are my normal approximations from PREVEND’s published means, pooled across sexes. Men run higher BCAAs, so for a man the valine percentile is somewhat less extreme.
What’s driving the score
Wicks et al. published the full equations for IVX, MMX and MVX, with coefficients taken from Cox models of 3-year mortality in CATHGEN. Running your six values through them gives IVX 25.2, MMX 52.8 and MVX 34.1, matching your report within rounding. So the what-ifs below are the model’s actual arithmetic, not guesses. (confidence: high)
Three features of the model matter:
- Leucine and valine enter as U-shaped terms. Risk falls as they rise, down to a nadir of about 212 µmol/L for leucine and 238 for valine, then climbs again. Your leucine is still on the protective slope. Your valine is past the nadir, so it now adds a little.
- Isoleucine has a positive linear coefficient, so more isoleucine means a higher score. At the 93rd percentile, it’s your largest MMX penalty.
- The inflammation side carries more weight. This fits the UKB paper, where GlycA and small HDL together accounted for over 60 percent of predictive power.
| Scenario (one change at a time) | IVX | MMX | MVX |
|---|---|---|---|
| As reported | 25 | 53 | 34 |
| GlycA at population median (373) | 37 | 53 | 42 |
| GlycA at population 75th percentile (416) | 42 | 53 | 46 |
| Small HDL-P +1 SD (19.0) | 15 | 53 | 26.5 |
| Isoleucine at population mean (58) | 25 | 48 | 30 |
| Valine at model nadir (238) | 25 | 50.5 | 32 |
| Citrate 1.60 mg/dL | 25 | 50.5 | 32 |
| Leucine at population mean (104) | 25 | 57 | 37 |
| Valine 238 + isoleucine 58 + citrate 1.6 | 25 | 43 | 27 |
The practical read:
- MMX upside: fixing everything on the MMX side at once is worth about 7 MVX points.
- Inflammation downside: if inflammation drifted to merely average, you’d lose 8 to 12 points.
- So: protecting the inflammation advantage matters more than tuning MMX.
- Protein cuts backfire: lowering leucine raises the score, so cutting protein to “fix” MMX would work against you.
The open question: high valine and isoleucine
MMX was built to detect protein-energy wasting in sick cardiac patients, where low BCAAs mark frailty. The PREVEND authors say plainly that MMX should be read as a proxy for metabolic malnutrition, not a direct nutritional assessment.
In a healthy, well-fed person, high BCAAs are a different signal. The candidates, in rough order of my prior given your very low GlycA:
- Pre-analytic. A non-fasting draw, or a shake or amino acid product the evening before. Labcorp prefers a 10 to 12 hour fast because the postprandial effect on MVX parameters is inconsistent and depends on the food and the individual.
- Intake and body composition. High habitual protein, a large lean-mass pool, and male sex all raise BCAAs.
- Reduced BCAA catabolism. Elevated fasting valine is one of the most reproducible metabolomic signatures of insulin resistance and future type 2 diabetes. Labcorp’s own group built a Diabetes Risk Index based on lipoprotein subfractions and branched-chain amino acids on that premise.
The mitochondrial angle:
- Where BCAAs are burned: BCAA oxidation is a matrix process (BCAT2, then the BCKDH complex, which BCKDK holds off by phosphorylation).
- Why they back up: BCKDH activity drops in adipose tissue and liver in insulin-resistant states, so plasma BCAAs rise.
- Valine specifically: its catabolite 3-hydroxyisobutyrate is secreted by muscle and promotes fatty acid uptake. That’s a proposed mechanistic link between valine flux and muscle insulin resistance (Jang et al., Nat Med 2016).
- The geroscience parallel: isoleucine restriction improves metabolic health and extends lifespan in mice (Green et al., Cell Metab 2023). The model’s isoleucine penalty rhymes with that, but it’s a translational gap: no human data link lowering plasma isoleucine to outcomes. (confidence in mechanism: moderate; in human translation: low)
Low GlycA argues modestly against metabolic syndrome. But insulin resistance in lean, active, low-inflammation people is common enough that this should be checked, not assumed.
How much weight MVX deserves
A hazard ratio (HR) compares death rates between groups at any point during follow-up. An HR of 1.30 per standard deviation means someone one SD above average died at about a 30 percent higher rate than a comparable person at average.
- Per-SD HRs in general populations: 1.12 in UKB (fully adjusted, different platform), 1.28 in the PREVEND thyroid analysis, and 1.32 among PREVEND participants with no chronic disease.
- What that means for you: your MVX is about 1.2 SD below the PREVEND mean. That works out to roughly a 13 to 30 percent lower relative hazard, depending on which estimate you trust. This is associational and relative; the absolute benefit depends on your age-specific baseline risk.
Strengths:
- The association is graded and consistent across cardiac, heart-failure and general-population cohorts. In the derivation, HRs were 2.18 in CATHGEN and 1.67 in the independent Intermountain cohort.
- It’s a parsimonious composite, and each component is biologically interpretable.
Limitations:
- Discrimination: it barely improves individual prediction. UKB’s C-statistic gain was 0.004; npj’s MACE C-index went from 0.727 to 0.728.
- Developer involvement: the derivation study was funded by Labcorp, and two PREVEND coauthors are Labcorp employees. The independent UKB groups, on a different platform, found smaller effects (fully adjusted Q4 vs Q1 HR 1.21).
- No intervention data: no trial shows that lowering MVX lowers mortality. The npj “preventable fraction” figures assume causality, which the authors acknowledge.
- Change tracking is weakly validated: in UKB, persistently high vs persistently low MVX gave a fully adjusted HR of 1.09 (0.91 to 1.29). Only women reached significance.
- It’s a state marker: UKB HRs decayed from 1.20 at 5 years to 1.08 at 15 years, which argues for periodic retesting.
- Regulatory status: Labcorp developed the test in-house, and it is not FDA cleared or approved.
The npj paper is the most useful one for a Medicine 3.0 lens:
- High vs low Life’s Essential 8 (LE8) carried an HR of 0.44 for MACE, against 1.21 for MVX Q4 vs Q1.
- People with high LE8 and the worst MVX quartile (HR 1.23) did far better than people with low LE8 and the best MVX quartile (HR 2.18).
- MVX mediated only about 5 percent of LE8’s benefit.
In other words, a good MVX doesn’t substitute for apoB, blood pressure, glucose, adiposity, fitness and sleep. Improving those buys far more than moving MVX.
Evidence grade on your A to E scale: B for MVX as a prognostic marker, D to E as a treatment target.
Action plan
1. Standardize and repeat once, in about 3 months
- Fast: 10 to 12 hours, water only. No shake, EAA/BCAA product, or unusually large protein dinner the night before.
- Same tube every time: MMX runs 10 to 15 percent higher in plasma than serum, and hemolysis pushes IVX up 10 to 20 percent.
- Avoid confounders: no hard training in the prior 48 hours, and no acute illness, vaccination or dental work in the prior 2 to 3 weeks (GlycA is an acute-phase composite).
- Intermittent rapamycin: draw at the same point in the cycle, ideally trough, since rapamycin can transiently impair glucose tolerance.
- GLP-1 agonist: note where you are in dosing; substantial weight loss lowers BCAAs.
- Add the NMR LipoProfile to the same draw: it gives LP-IR and the Diabetes Risk Index from the same spectrum.
Two draws under identical conditions will tell you whether the valine and isoleucine elevation is you or the morning you drew blood.
2. Settle the insulin-sensitivity question
-
Tests to order:
- Fasting insulin and glucose (HOMA-IR), TG/HDL-C ratio, HbA1c
- 75 g OGTT with insulin at 0, 30, 60 and 120 minutes (Attia’s preferred probe for early hyperinsulinemia)
- 10 to 14 days of CGM
- ALT and GGT, plus FibroScan CAP or MRI-PDFF for liver fat
- DEXA for visceral fat and appendicular lean mass index
- A 3-day food log noting protein in g/kg and any supplements
- If you’re insulin sensitive (low fasting insulin, a normal OGTT insulin curve, low visceral fat, no liver fat) and eat a lot of protein: the BCAA pattern is likely benign, and sampling hygiene is the only fix needed.
-
If insulin resistance shows up: that’s the real finding. Levers:
- Zone 2 volume
- Resistance training (muscle is both a glucose and a BCAA sink)
- Losing visceral fat
- Sleep and alcohol
- Pharmacotherapy only on standard indications, with your physicianExpect valine, isoleucine and MMX to fall as sensitivity improves.
3. Protect the inflammation advantage
- Why it matters: the what-if table shows this is where your score lives.
- What raises GlycA: visceral adiposity, smoking, poor sleep, periodontal disease, chronic infection and autoimmune flares.
- Track it with hs-CRP: pair GlycA with hs-CRP on future panels. GlycA’s within-person variability is about 4 percent over 5 weeks, so a rise of more than roughly 15 percent on a repeat test is probably real.
- Leave small HDL-P alone pharmacologically: in the AIM-HIGH substudy, extended-release niacin did not affect GlycA, while low small HDL particles still tracked with death. Exercise and not smoking are the defensible levers.
4. The bigger levers MVX can’t see
- ApoB, plus Lp(a) once: MVX contains no atherogenic particle measure.
- VO2max: the strongest modifiable correlate of all-cause mortality in observational data. Attia’s template is about 3 hours a week of Zone 2 plus one session of VO2max intervals (for example, 4x4 minutes).
- Strength and muscle: 2 to 3 resistance sessions a week, tracked with DEXA lean mass and grip strength.
- Protein: keep intake adequate for muscle (Attia’s working range is roughly 1.6 to 2.2 g/kg/day), leaning on whole foods.
- Blood pressure, sleep and the rest of LE8: in the npj data, the high-LE8 group had the lowest risk in every MVX quartile.
What not to do
- Don’t cut protein to lower MMX. In this model, lower leucine raises the score.
- Don’t add isolated BCAA products. They’d push valine and isoleucine higher, and they add nothing that complete protein doesn’t already provide.
- Don’t read a low MVX as low ASCVD risk. It measures resilience, not atherogenic burden.
After the standardized repeat, annual testing alongside your other labs is enough. Track IVX and MMX separately, since they move for different reasons.
Sources:
- Labcorp: MVX Plus by NMR (test 123601)
- Kunutsor et al. 2025, Nutrients: MVX, IVX, MMX and mortality by multimorbidity (PREVEND)
- Wicks et al. 2024, Nutrients: MVX in multiple sclerosis (published equations)
- Otvos et al. 2023, Lancet Healthy Longevity (PubMed)
- Kunutsor et al. 2026: MVX, thyroid function and mortality (PMC)
- AIM-HIGH GlycA and HDL substudy, J Clin Lipidol 2018
- Attached: Li et al. 2025, Redox Biology 81:103585; Wang et al. 2026, npj Cardiovascular Health 3:37
2 Likes
Follow-on Prompt:
From the test results given, can you esimate the 5, 10 and 30-year premature mortality risk in a disease-free individual?
Claude Opus 5.5 Extra Mortality Risk Analysis:
No test can turn an MVX score into an absolute risk on its own. MVX only shifts relative risk; the absolute numbers come almost entirely from age and sex. So I built a grid:
- Baseline: US 2023 life tables.
- Disease-free adjustment: a hazard multiplier calibrated against the cohorts.
- Your MVX: the cohort hazard ratios applied on top.
The Python model is below; each cell compares an average disease-free peer with you.
Estimated risk of death (%), disease-free adult
Each cell reads: average-MVX disease-free peer → your MVX of 34, central estimate (plausible range).
Men
| Age | 5-year | 10-year | 30-year | Before age 75 |
|---|---|---|---|---|
| 40 | 1.0 → 0.8 (0.6-1.0) | 2.3 → 1.9 (1.4-2.3) | 17.7 → 16.5 (9.7-19.7) | 26.5 → 25.0 (14.1-29.2) |
| 50 | 1.8 → 1.4 (1.1-1.7) | 4.4 → 3.6 (2.7-4.5) | 34.0 → 31.9 (19.5-37.3) | 22.1 → 20.3 (12.9-24.4) |
| 60 | 3.9 → 3.1 (2.4-3.8) | 9.3 → 7.6 (5.8-9.5) | 65.8 → 63.1 (42.4-70.0) | 16.6 → 14.0 (10.4-17.8) |
| 70 | 7.8 → 6.1 (4.9-7.5) | 18.8 → 15.6 (12.1-19.3) | 95.5 → 94.4 (79.5-97.0) | 7.8 → 6.1 (4.9-7.5) |
Women
| Age | 5-year | 10-year | 30-year | Before age 75 |
|---|---|---|---|---|
| 40 | 0.6 → 0.4 (0.3-0.5) | 1.3 → 1.0 (0.8-1.3) | 11.2 → 10.4 (6.0-12.5) | 17.6 → 16.6 (9.1-19.6) |
| 50 | 1.1 → 0.8 (0.7-1.0) | 2.7 → 2.2 (1.6-2.7) | 24.2 → 22.7 (13.4-26.8) | 14.7 → 13.4 (8.4-16.3) |
| 60 | 2.4 → 1.9 (1.5-2.3) | 5.9 → 4.8 (3.6-6.0) | 54.7 → 52.2 (33.3-59.0) | 11.0 → 9.2 (6.8-11.8) |
| 70 | 5.3 → 4.1 (3.3-5.1) | 13.6 → 11.2 (8.6-13.9) | 91.5 → 90.1 (71.5-93.8) | 5.3 → 4.1 (3.3-5.1) |
For scale, the general US population’s 10-year risk at age 50 is 7.2% for men and 4.4% for women.
How to read this
MVX moves absolute risk only a little. Take a 50-year-old man: 10-year risk falls from 4.4% to 3.6%. That’s 0.8 percentage points, or about one fewer death per 120 similar people over a decade. Over 30 years the MVX-attributable difference is only 1 to 3 points at any age. (confidence: moderate)
Most of the range comes from other factors. The spread in each cell mostly reflects uncertainty about how much lower a disease-free person’s baseline is, not uncertainty about MVX. Age, sex, being disease-free, and factors MVX doesn’t measure dominate the absolute number. Those include apoB, blood pressure, fitness, smoking and education/income.
The 30-year column is largely a life table, not an MVX prediction. The cohort data stop at about 15 years, and the MVX effect was already fading: UKB’s per-SD hazard ratio fell from 1.20 at 5 years to 1.08 at 15. From age 60 or older, a 30-year horizon mostly measures lifespan rather than premature death. That’s why I added the before-75 column, which matches the US years-of-life-lost definition. (confidence: low for 30-year figures)
Method and assumptions
- Baseline. SSA 2023 period life table, from the 2026 Trustees Report. Period tables ignore future mortality improvement, so the 30-year figures lean slightly pessimistic.
- Disease-free adjustment. In the central case, hazard is multiplied by 0.6 for the first decade, then eases toward 0.8 by year 30 as some people develop disease. The range runs from 0.5 held constant to 0.7 easing toward 0.9. Two calibration checks support it:
- PREVEND’s disease-free participants had 5.7% deaths over about 14 years. The US table predicts 10.5% for a cohort of their age and sex, so observed/expected is 0.54.
- The whole UKB cohort in Li et al. comes out at 0.50.Both comparisons fold in lower Dutch and UK baseline mortality, so about 0.6 is a reasonable center for a US disease-free adult. The UK Biobank representativeness study (Fry 2017) found participants’ all-cause mortality at ages 70 to 74 was 46% lower (men) and 56% lower (women) than the general population, which is consistent.
- MVX effect. Your 34 is about 1.1 SD below the mean for PREVEND’s disease-free group (43.7, SD 8.9).
- Optimistic bound: PREVEND’s no-disease hazard ratio of 1.32 per SD, held constant for 30 years, giving a relative hazard of 0.74.
- Conservative bound: interval values back-calculated from UKB’s decaying 5-, 10- and 15-year estimates, giving 0.82, 0.92 and 0.98, then 1.0.
- Central: in between (0.78, 0.83, 0.85, then 0.95).
Caveats:
- Associations, not causes. These are associational hazard ratios from adjusted models, applied to an unadjusted baseline.
- One reading. A single measurement partly regresses toward the mean, which is another reason to favor the central-to-conservative figures.
- What “disease-free” means. It follows PREVEND’s definition: no hypertension, CVD, CKD, diabetes, chronic lung disease or cancer.
If you give me age and sex, plus apoB, blood pressure, smoking status and a VO2max or DEXA result if you have them, I can collapse this grid into a single personalized estimate with the MVX contribution shown separately.
Sources:
- SSA Period Life Table, 2023 (2026 Trustees Report)
- Fry et al. 2017, Am J Epidemiol: UK Biobank vs general population
- Kunutsor et al. 2025, Nutrients (PREVEND MVX by multimorbidity)
- Attached: Li et al. 2025, Redox Biology 81:103585 (horizon-specific hazard ratios)
3 Likes
I was interested in this info after reading about it here. I took the MVX plus test at Labcorp via OYL ($40-something). My results were “good” but I didn’t come away with any learning. I was surprised that my BCAA were low (I eat a high protein diet, still). I suppose I don’t have insulin resistance any longer. Here are my test results in case anyone can find something interesting.
MVX test results JDL.pdf (130.1 KB)
3 Likes
Less than 63, so it didn’t find anything wrong. You easily made it. I was thinking of doing this but not easy for me since lab corp is 80 miles away and I don’t know if anything could be done for a bad value anyway. Get my estate in order I guess.
1 Like
For me, it was worth the peace of mind that I wasn’t missing anything that would obviously cause problems sooner or later.
Here are your results run through the same Claude prompt I did earlier with my results. Excellent results Joe!
Analysis of Joe’s MVX test results:
Two things deserve attention: his GlycA is unusually low, and his small HDL particle count is the weak link holding the whole score up.
Bottom line
- MVX 32 is around the 8th percentile of the PREVEND general-population cohort (same Labcorp platform, fasting EDTA plasma, mean age 54). (confidence: moderate-high)
- Both halves are good: IVX 28 (about 14th percentile) and MMX 47 (about 13th percentile).
- GlycA 223 is far below the PREVEND interquartile range of 337 to 416, roughly the lowest 1 percent. That is probably real low inflammatory tone, but a value this extreme should be confirmed once. (confidence: moderate)
- The amino acid pattern is clean: no wasting signal and no insulin-resistance signature. (confidence: moderate-high)
Where he sits
| Marker | Result | PREVEND mean (SD) | Approx. percentile | Read |
|---|---|---|---|---|
| MVX | 32 | 44.9 (9.0) | ~8th | Favorable |
| IVX | 28 | 39.3 (10.5) | ~14th | Favorable |
| MMX | 47 | 54.3 (6.4) | ~13th | Favorable |
| GlycA | 223 | median 373 (IQR 337-416) | below 1st | Extreme low |
| Small HDL-P | 14.6 | 15.9 (2.4) | ~30th | Weak link (higher is better) |
| Leucine | 106 | 104 (27) | ~53rd | Neutral |
| Valine | 224 | 201 (38) | ~72nd | Near the model optimum (238) |
| Isoleucine | 51 | 58 (15) | ~31st | Favorable (lower is better) |
| Citrate | 1.75 mg/dL (~91 µM) | 2.09 (0.48) | ~24th | Favorable (lower is better) |
Percentiles are my normal approximations, pooled across sexes; men run somewhat higher BCAAs. The printed reference limits are the EDTA-plasma ones, so I treated this as a plasma sample.
What is driving the score
The published equations reproduce this report within one point (model: IVX 28.2, MMX 46.2, MVX 31.3), so these what-ifs are the algorithm’s own arithmetic.
| Scenario (one change at a time) | IVX | MMX | MVX |
|---|---|---|---|
| As measured (model) | 28 | 46 | 31 |
| Small HDL-P at population mean (15.9) | 22 | 46 | 26 |
| Small HDL-P down 1 SD (12.2) | 40 | 46 | 40 |
| GlycA 281 | 34 | 46 | 36 |
| GlycA at population median (373) | 44 | 46 | 43 |
| GlycA 416 and small HDL-P 13.0 | 53 | 46 | 50 |
| Leucine 130 | 28 | 41 | 28 |
| Leucine 85 | 28 | 51 | 35 |
| Isoleucine 65 | 28 | 49.5 | 34 |
- Small HDL-P is the most leveraged input. At his GlycA, each 1 µmol/L of small HDL-P moves IVX about 5 points and MVX about 4.
- GlycA is the cushion. Each 10 µmol/L moves IVX about 1 point. If his GlycA were merely average, his MVX would be about 43, which is average.
- MMX has little left to give. Valine sits near the model’s optimum, and isoleucine and citrate are already low. Leucine is the only input with headroom, and it rewards more protein, not less.
The two items worth a closer look
1. Is a GlycA of 223 real?
For scale, healthy non-obese adults in the CALERIE trial averaged 327 µmol/L at baseline, and two years of calorie restriction lowered that by about 32.
- Most likely: genuinely low inflammation in a lean, fit, non-smoking person.
- Pre-analytic: Labcorp notes hemolysis can reduce GlycA by more than 10 percent.
- Reduced liver glycoprotein output: cirrhotic patients averaged 317 versus 347.5 in matched controls. That effect is modest and would not explain 223 alone, but it is cheap to exclude.
- Medication: immunomodulating drugs that suppress acute-phase proteins could do this. I can’t verify his medication list.
2. Small HDL-P at 14.6
- No proven lever: no intervention is shown to raise small HDL-P and improve outcomes.
- Calorie restriction lowered it: in CALERIE, by about 1.2 µmol/L, while improving nearly every other cardiometabolic marker. A lean, low-intake phenotype can therefore push this input the “wrong” way without being harmful.
- Niacin did not help: in AIM-HIGH it did not improve outcomes despite HDL changes.
This is a number to track, not to treat. (confidence: moderate)
Absolute risk, now that age and sex are known
Same method as before: SSA 2023 life table, a disease-free adjustment, then the cohort hazard ratios. His MVX is about 1.3 SD below the disease-free PREVEND mean, which gives a relative hazard of roughly 0.74 in the first five years, fading toward 0.94 after year 15.
| Horizon | US men aged 64 | Disease-free peer, average MVX | Him, if disease-free (range) |
|---|---|---|---|
| 5 years | 8.5% | 5.2% | 3.9% (3.0-4.8) |
| 10 years | 19.3% | 12.1% | 9.5% (7.2-12.1) |
| Before age 75 | 21.8% | 13.7% | 10.9% (8.2-13.9) |
| 30 years (to 94) | 89.6% | 80.6% | 77.8% (54.5-84.1) |
- Disease status is unknown. If he has an established chronic condition, use roughly 6% at 5 years and 15% at 10 years instead.
- MVX’s contribution is small. It accounts for about 1.3 percentage points at 5 years and 2.6 at 10 years. The rest comes from age, sex and disease status.
- The 30-year row is mostly a life table. Labcorp’s own report comment frames MVX as a near-term, 5-year marker.
Recommended actions
- Confirm once, in about 3 months.
- Same conditions: fasting, morning, EDTA plasma. The report states serum reads MMX 15 points and MVX 5 points lower, which would look like a false improvement.
- Add hs-CRP, CBC, and a metabolic panel with albumin, ALT and AST to the same draw.
- Add the NMR LipoProfile, which gives LDL-P, total HDL-P and LP-IR from the same spectrum.
- Measure what MVX cannot see. At 64, these dominate:
- ApoB, and Lp(a) once.
- A coronary calcium score if he has never had one.
- Home blood pressure.
- HbA1c and fasting insulin.
- Fitness and muscle.
- VO2max testing; DEXA for lean mass, visceral fat and bone density; grip strength.
- Training template: about 3 hours a week of Zone 2, one interval session, and 2 to 3 resistance sessions.
- Protein. Keep intake adequate, roughly 1.2 to 1.6 g/kg/day or higher if training hard, from whole foods. The model and sarcopenia prevention point the same way here.
- Protect the inflammation advantage. Watch visceral fat, sleep, periodontal health and smoking exposure. A GlycA rise of more than about 15 percent on repeat is probably real.
What not to do:
- Don’t chase small HDL-P with niacin or fibrates.
- Don’t add BCAA supplements.
- Don’t read a low MVX as low cardiovascular risk.
- Don’t over-read small changes. I’d treat MVX shifts under about 5 points as noise; that threshold is my inference from the small HDL-P sensitivity, not a published figure.
Compared with the first report
| First report | This report | |
|---|---|---|
| MVX / IVX / MMX | 34 / 25 / 53 | 32 / 28 / 47 |
| GlycA | 281 | 223 |
| Small HDL-P | 16.6 | 14.6 |
| Total BCAAs | 494 | 381 |
The MVX scores are nearly identical, but the physiology differs. The first leaned on strong HDL particles and carried a BCAA excess worth investigating. This one leans on an extreme GlycA and has a clean amino acid profile.
1 Like
Thank you. That was helpful. As you were, I was looking for a problem where I didn’t think I had one (but wasn’t certain). My inflammation is very low historically with hsCRP at 0.2-0.3 for years so I’m not surprised by the inflammation finding. My HDL is down recently but my apoB (25) and LDL (<10, calc) are minuscule with my aggressive treatment (bempadoic acid / ezetimibe, repatha) so I’m good there. Recently my Hba1c is down to 5.3 (farxinga, improved diet) so my metabolic health has stabilized. Now I’m getting serious about losing the visceral fat I’m sure I’ve added this year. I’ve scheduled my DEXA for end of Nov so I have a timeline for results. As before I’m confident I’ve added muscle; I hope to be right this time.
2 Likes