MitoSwab. Very happy with their reports. Not only looks at your level of mitochondrial activity but also channel efficiency.
Chad Lerner is fun to talk to
MitoSwab. Very happy with their reports. Not only looks at your level of mitochondrial activity but also channel efficiency.
Chad Lerner is fun to talk to
Interesting… launched this past summer, and sounds like its more for research than personal use:
Verséa Discovery, Inc. Announces the Official Launch of mescreen™ Research Validator – a Revolutionary Mitochondrial Compound Assessment Platform
August 27, 2024 06:00 AM Eastern Daylight Time
TAMPA, Fla.–BUSINESS WIRE–Verséa Discovery, Inc., a Florida-based company dedicated to advancing scientific research and development in the area of personalized and precision medicine, has announced the official launch of mescreen™ Research Validator.
The mescreen™ Research Validator is a groundbreaking, proprietary compound assessment platform that harnesses mitochondrial function and dynamics to generate critical data, supporting the development, formulation, and clinical validation of customers’ supplements, nutraceuticals, pharmaceuticals, biologics, and medical devices.
By utilizing patented optimized bioassay, imaging, and machine-learning process, the mescreen™ Research Validator delivers valuable insights into mitochondrial efficiency and the clinical effects of various test materials in-vitro and in-vivo.
Research utilizing Verséa’s proprietary machine learning system has analyzed over 60 FDA-approved compounds and probes known to impact mitochondrial function and dynamics. These studies have demonstrated the platform’s capability to detect changes in mitochondrial function and structure upon the introduction of test materials into the assay. The platform is also able to detect changes in mitochondrial function when therapeutics, interventions and lifestyle changes were introduced to and implemented by subjects.
“We are thrilled to bring this groundbreaking technology to market,” said Stephen Porada, the President of Verséa Discovery, Inc. “mescreen™ Research Validator has tremendous potential to help companies validate or optimize the performance of their bioactive molecules, ingredients or physical interventions being targeted for commercial product development.”
Dr. Hemal Patel, Chief Scientific Advisor of Verséa Discovery, Inc., added, “In addition to this important advancement, we are currently developing the mescreen™ Personalized Mitochondrial Efficiency Test, which aims to provide individuals with a comprehensive energetic profile. This test will utilize a 12-matrix panel to accurately quantify core functions and dynamics providing important data and information related to one’s mitochondrial efficiency. Our commitment to enhancing mitochondrial health will empower individuals to better understand and improve their well-being.”
To gain insight into the science behind mescreen™ Research Validator and explore how it can benefit your research and product development efforts, please contact Verséa Discovery, Inc. at discovery@versea.com or call 1-800-397-0670.
About Verséa Discovery, Inc.
Verséa Discovery, Inc., headquartered in Tampa, FL, is a U.S. company committed to advancing scientific research and development in personalized and precision medicine. Operating as a strategic business unit of Verséa Health, Inc., the company specializes in developing innovative solutions that deliver critical insights into health at the cellular and mitochondrial levels. To learn more visit Verséa Discovery webpage.
Disclaimer: mescreen™ is for research use only and is not intended to diagnose, treat, or cure disease. You should not change medications, diet, exercise regimens, or other related health activities without consulting your physician. mescreen™ has not been reviewed by the Food and Drug Administration. mescreen™ is a trademark of Verséa Health, Inc.
I checked this company months ago as they have (had?) a lactoferrin test that could be used for the early diagnosis of Parkinson’s and/or Alzheimer’s. That test was very serious. I don’t know about this new mitochondria test though.
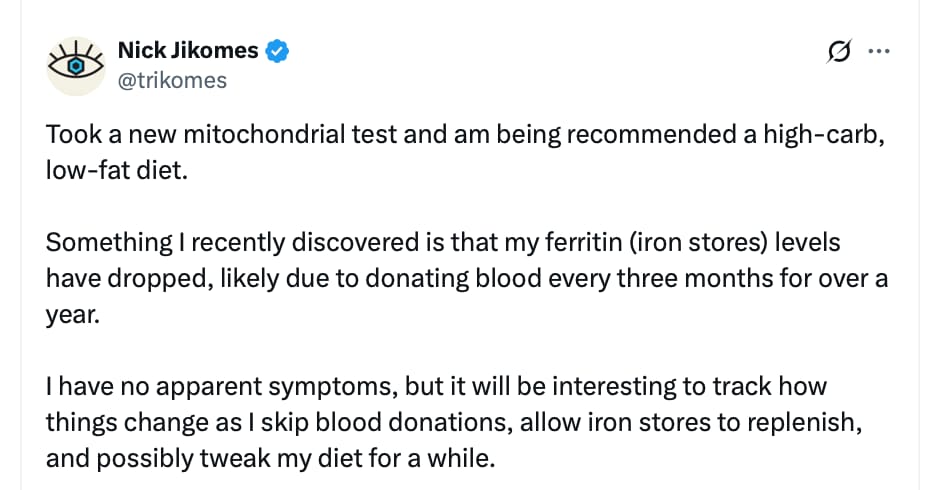
https://x.com/trikomes/status/1924906797200245138
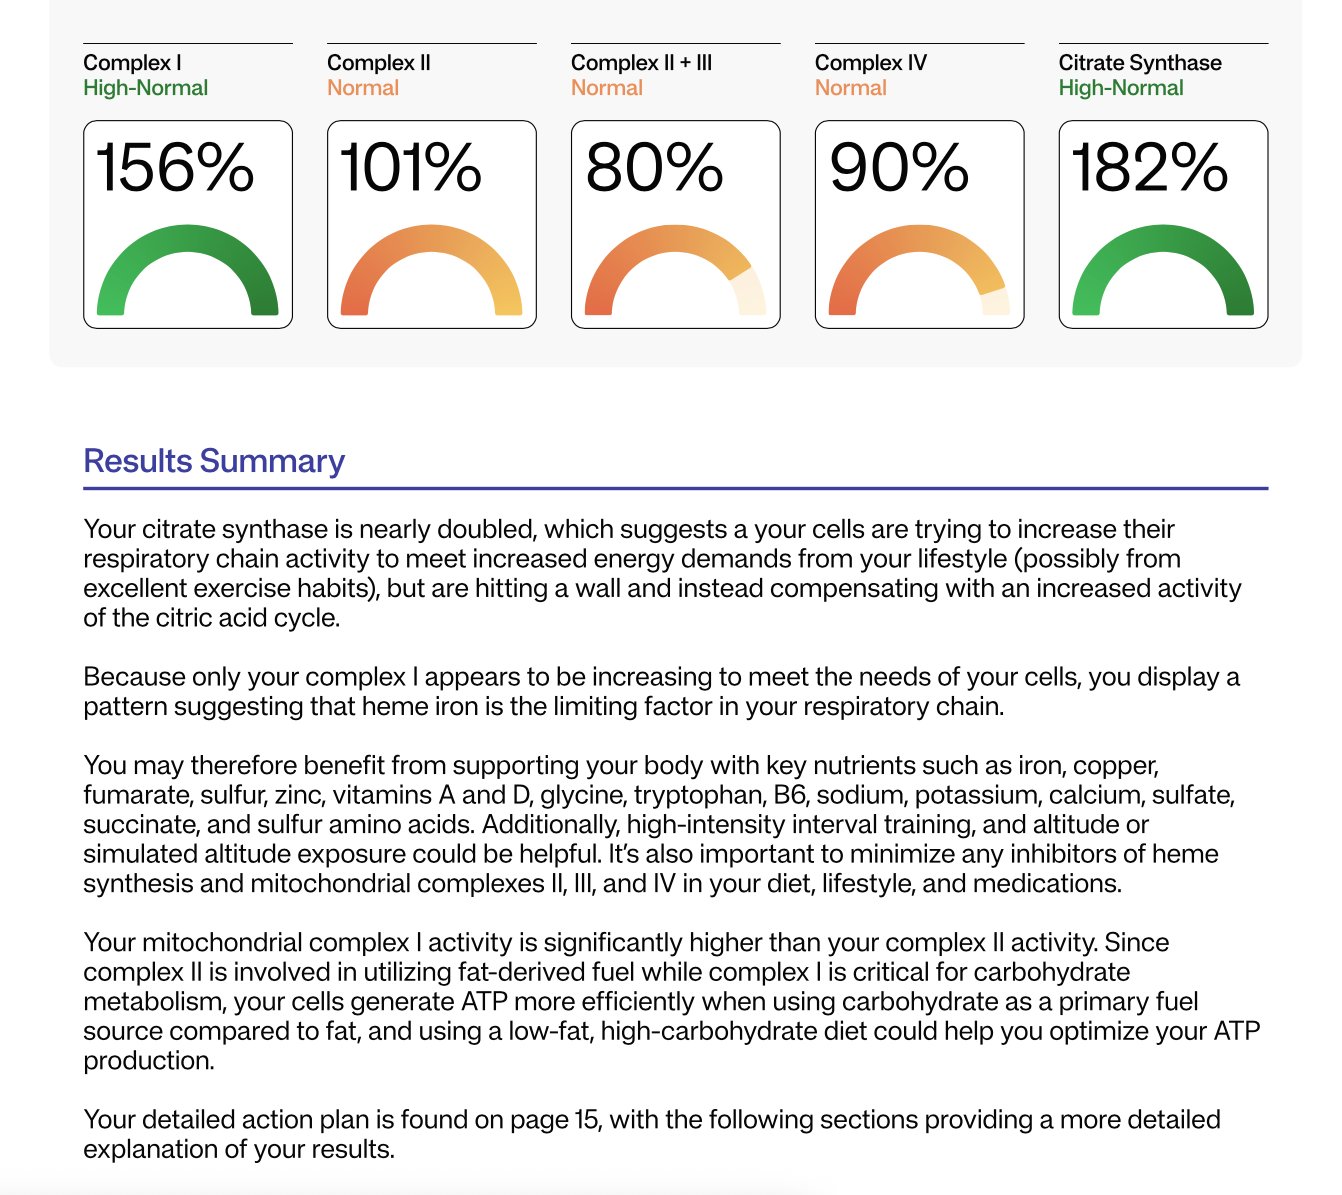
The dashboard you’re looking at is not an organic-acids profile.
It comes from a direct enzyme-activity panel that the lab runs on the mitochondria-containing cells in your blood sample (mostly platelets and leukocytes). In each well of a micro-plate the lab:
What is being quantified in each well is therefore an enzyme-catalysed reaction rate, not a circulating metabolite.
Here are the actual reactions and the “reporter” signals the spectrophotometer tracks:
| Report line | Enzyme reaction in the assay well | Spectral “reporter” that is monitored |
|---|---|---|
| Complex I (NADH dehydrogenase) | NADH → NAD⁺ + H⁺ (electrons passed to ubiquinone analogue) | Disappearance of NADH at 340 nm |
| Complex II (Succinate dehydrogenase) | Succinate → fumarate (electrons to CoQ analogue) | Reduction of DCPIP or decyl-ubiquinone (600 nm) |
| Complex II + III (Succinate : cyt-c reductase) | Succinate → fumarate → cytochrome c (via complexes II & III) | Appearance of reduced cytochrome c at 550 nm |
| Complex IV (Cytochrome-c oxidase) | 4 Red-cyt-c + O₂ → 4 Ox-cyt-c + 2 H₂O | Loss of reduced cytochrome c absorbance at 550 nm |
| Citrate-synthase (normalises for mito number) | Oxaloacetate + Acetyl-CoA → Citrate + CoA-SH | Formation of TNB from CoA-SH + DTNB at 412 nm |
So the only “analytes” the instrument is reading are:
The green/orange gauges you see are simply each reaction rate normalised to citrate-synthase activity and then expressed as a percentage of a healthy-control mean. No plasma metabolites (lactate, succinate, organic acids, etc.) enter into these particular numbers.
Is that another mitochondrial test?

Mhi
Here is the adversarial summary and analysis of the transcript.
This video features a “Physionic” host analyzing clips from a mitochondrial researcher, Dr. Martin Picard. The central theme is how lifestyle factors—specifically exercise, nutrition, and psychological state—directly impact mitochondrial function (the “Mitochondrial Health Index”).
Dr. Picard distinguishes between inherited mitochondrial disorders (genetic defects like Leber’s Hereditary Optic Neuropathy, passed from the mother) and acquired mitochondrial dysfunction (environmental/lifestyle driven). The video posits that “poisons” (like the insecticide Rotenone) and excessive nutrient load (gluco-lipotoxicity) cause rapid mitochondrial fragmentation and dysfunction. Conversely, exercise is highlighted as the most potent inducer of mitochondrial biogenesis via the PGC-1α pathway.
A novel, albeit preliminary, concept introduced is the bidirectional link between mood and mitochondria. Citing a study by Picard and Epel, the video suggests that positive psychological states (especially evening mood) may predict better mitochondrial health the following day, rather than the reverse. The host corroborates the morphological changes in mitochondria based on his own lab work but advises caution in interpreting associative data on mood.
| Claim from Video | Speaker’s Evidence | Scientific Reality (Best Available Data) | Evidence Grade | Verdict |
|---|---|---|---|---|
| “Exercise doubles mitochondrial number via biogenesis” | Cites “Marathon training” & PGC-1α mechanism | Well-established. Endurance training significantly increases mitochondrial volume density and oxidative capacity. Holloszy, J Biol Chem 1967 | A (Human/Animal RCTs) | Strong Support |
| “Nutrient overload (sugar+fat) causes mitochondrial fragmentation” | Cites “Cultured cell studies” | Accurate. “Nutrient toxicity” causes fission (fragmentation) and ROS production as a defense mechanism. Liesa & Shirihai, Cell Metab 2013 | D/C (In Vitro/Mechanistic) | Mechanistically Sound |
| “Rotenone is a mitochondrial poison causing defects” | Lab experience | Fact. Rotenone is a potent Complex I inhibitor used to induce Parkinson’s-like pathology in models. Betarbet et al., Nat Neurosci 2000 | D (Animal/Cell Model) | Fact (Toxicology) |
| “Positive mood predicts better mitochondrial health” | Cites Picard/Epel study (90 women) | This is an observational association with small effect sizes (r < 0.4). Causality is not proven. Picard et al., Psychosom Med 2018 | C (Observational) | Plausible but Weak |
| “Fasting duration (12 vs 16 hrs) has specific mitochondrial sweet spot” | Speaker says “We don’t know” | Correct. Human data on specific hourly thresholds for mitochondrial autophagy is lacking. Most data is murine. | N/A (Claim of Uncertainty) | Honest Uncertainty |
Translational Gap:
The Mitochondrial Optimization Protocol
Top Tier (High Confidence): Zone 2 & High Intensity Training
Action: Engage in regular aerobic exercise. The “biogenesis” signal is strongest with volume (duration).
Why: This physically forces cells to build more power plants (PGC-1α pathway). It is the single most effective intervention mentioned.
Top Tier (High Confidence): Caloric Control (Anti-Fragmentation)
Action: Avoid chronic overeating. You do not need a specific “fasting window,” but you must avoid the state of constant “Nutrient Overload.”
Why: Constant influx of energy (especially combined fats and sugars) forces mitochondria to fragment and waste energy, leading to oxidative stress.
Experimental (Mind-Body): Stress Management
Action: Prioritize positive psychological states (gratitude, connection) in the evenings.
Why: Emerging (Tier C) evidence suggests your evening mood may prime your cellular energetics for the next day. Low risk, high potential reward.
Avoid: Environmental Toxins
Action: Minimize exposure to broad-spectrum insecticides (like Rotenone) and pesticides where possible. Wash produce or choose organic for “dirty dozen” items if budget permits.
Mitochondrial Dynamics: Fission vs. Fusion
The video touches on “Fragmentation,” which refers to Mitochondrial Fission.
The “Biogenesis” Signal (PGC-1α)
Claim: “Leber’s Hereditary Optic Neuropathy (LHON) comes from the mother.”
Fact: TRUE. Mitochondria possess their own DNA (mtDNA), which is almost exclusively maternally inherited. Sperm mitochondria are destroyed upon fertilization.
Claim: “Fat alone causes fragmentation.”
Fact: TRUE (in specific contexts). Saturated fatty acids (like Palmitate) are known to induce mitochondrial fragmentation and apoptosis in cell models (Lipo-apoptosis). Unsaturated fats (like Oleate) are often less toxic.
Claim: “You can double your mitochondria.”
Fact: TRUE. Highly trained endurance athletes can possess 2x the mitochondrial density of sedentary individuals. This plasticity is a fundamental adaptation of skeletal muscle.
Thank you for this. I had a full genome test suggesting that I have some degree of Complex I deficiency as well as an OAT test showing something similar. Would be cool to see it confirmed again here because I am not a genetics expert and didn’t know what I was doing with the whole genome data.
I won’t be trying this though because I think the price is unreasonable. The cost of the full genome test and the OAT test combined was still much less than this. I’ll keep my eye out for similar tests.
This is a test I heard of a while back: https://www.iollo.com/
Pricy, but still less than the Mescreen. Can’t vouch for it other than I heard of it years ago and bookmarked it.
It’s just a cheek swab, I really don’t know if it can be this informative…
Only $700 though. I like Chris and even subscribed for a couple years, but don’t know about this.
The Mitome test had showed that this client had impaired transport of methyl groups into the mitochondria, and since creatine supports methylation, this may have made him respond especially well to the creatine. However, everyone needs to optimize their creatine status so this is a safe and fruitful path to embark on without testing first.
Mitome reflects a year and a half of deep research into the causes of many different patterns of mitochondrial dysfunction, fused with my own cross-referencing over 100 sets of respiratory chain data with comprehensive whole genome sequencing and biochemical data (amino acids, organic acids, vitamins, minerals, and other markers) to distill ways of inferring causal patterns and effective actionable protocols from repeatable patterns within the respiratory chain data when used on its own. Mitome uses a cheek swab to measure each of the four respiratory chain complexes where 90% of your cellular energy (ATP) is made to infer which of 12 “mitochondrial types” you are and how your patterns combine into one of 90 unique approaches to personalizing your strategies to boost your cellular energy production. Mitome also simplifies this for you by automatically constructing your protocol for you. Find out your mitochondrial type today with Mitome.
Short answer: partly.
What’s solid: Mitome’s cheek-swab labwork appears to be run on/with the MitoSwab platform. Buccal (cheek) cells can be used to measure mitochondrial enzyme activities (e.g., Complex I, III, IV) and citrate synthase, and there’s peer-review showing these buccal assays track muscle-biopsy enzyme defects ~82% of the time for Complex I/IV in confirmed mitochondrial disease (small, pediatric cohort).
What’s iffy: Mitome markets a personalized “optimization protocol” from those cheek-cell readings. That interpretive algorithm and clinical benefit (e.g., better symptoms/outcomes because you followed their supplement/diet plan) haven’t been validated in published trials, and the underlying test is a CLIA LDT, not FDA-cleared. Price listed is $699.
The “only cheek cells” concern (you’re right)
Mitochondria vary a lot by tissue (proteins, assembly, morphology, fuel use). Cheek epithelium is not a stand-in for brain, heart, liver, or skeletal muscle. Also, buccal epithelium turns over fast (~14 days), so a swab reflects recent state and local exposures (diet, smoke/vape, oral inflammation), not “whole-body mitochondrial health.”
What Mitome says it measures
Their page lists citrate synthase plus Complex I, II, II+III, and IV from a cheek swab; they then generate food/supplement suggestions. (Note: “II+III” is an activity assay, not a single complex.)
How good are cheek-swab enzyme assays?
Pros: Non-invasive; methods exist for CI/CIII/CIV. One 2012 study reported ~82.5% correlation with muscle biopsy for CI/IV in diagnosed cases; a 2023 paper details buccal Complex III assays.
Caveats: Small cohorts; CI/IV most studied; diet/smoking can modulate buccal mitochondrial readouts; and results may not mirror high-energy tissues. The test is not diagnostic on its own.
If you want a more “systemic” readout
Some groups measure mitochondrial respiration in blood cells (PBMCs/platelets) and show links to muscle and clinical states, but these, too, have confounders (immune-cell mix, methods) and are mostly research-setting.
Practical take
Consider Mitome as a screening/monitoring tool, not a verdict on body-wide mitochondria.
If you do it, standardize pre-collection: follow their instructions (rinse with water; wait 30 min after brushing; ship Mon–Thu on ice) and avoid acute confounders (smoking/vaping right before sampling).
For organ-specific symptoms (e.g., neuromuscular issues), see a specialist; gold-standard workups still rely on targeted clinical testing.
Bottom line: The measurement part (cheek-cell enzyme activities) has some peer-reviewed support; the “personalized protocol” part is not clinically validated. Treat Mitome as potentially informative but non-diagnostic, and be cautious about over-interpreting cheek-cell data as your global mitochondrial status.
I got my results back. They were very simple. I guess I need to supplement with CoQ and also it may be better for me to stay away from statins.
(and MAYBE i might benefit from methylene blue)
Complex I
Normal
136%Complex II
Normal
107%Complex II + III
Low
23%Complex IV
Normal
80%Citrate Synthase
High-Normal
171%Results Summary
Your mitochondrial complex II + III activity is at 23% of normal function. These
enzyme complexes are critical components in the electron transport chain—the
cellular pathway that produces most of your ATP (energy). This blockage impairs
your cells’ ability to metabolize all fuel types. The dysfunction substantially
reduces your energy production, affecting both your daily performance and your
body’s capacity to maintain long-term health functions.
Overall, this means you may benefit from CoQ10, vitamin C, vitamin K2 (in the
form of MK-4), sulfur amino acids, near infrared light in the 700-1000 nanometer
range, methylene blue, and the removal of complex III inhibitors from your diet,
lifestyle practices, and medications.
===
The table below gives normal ranges based on 95% confidence intervals in control samples. Your
percentages listed on the previous page are a percentage of the mean control. For example, if your
citrate synthase was “100%,” you can derive its activity in nanomoles per minute per milligram buccal
protein by multiplying 100% times 12.1 in the below table, meaning it was operating at 12.1 nanomoles
per minute per milligram buccal protein. You can then compare that to the normal range and conclude
that it is normal.
Due to the lack of large sample sizes and associated statistical precision in these normal ranges, the
Mitome analysis categorizes results as a percentage of control means into normal (70-140%), low (≤
50%), high (≥ 200%), or low or high normal between these ranges, based on standardized cutoffs for
the sake of optimal pattern analysis. This is the basis for the descriptors you see on the previous page
and for any patterns we derive from those descriptors.
Enzyme Normal Ranges and Mean Activities
Activity Name Normal Range Mean ± SD
Citrate Synthase (CS) 4.4-22 12.1 ±5.1
Complex I
(normalized to CS)3.4- 11.9
6.8 ±2.0Complex II
(normalized to CS)0.03-0.35
0.194 ±0.08Complex II + III
(normalized to CS)0.032-0.152 0.092 ±0.03
Complex IV
(normalized to CS)0.15- 0.6 0.31 ±0.1
Got it. I converted your Mitome percentages to the underlying values using the report’s own rule:
raw value = (your %) × (control mean) / 100.
I’m keeping the original units exactly as the table states. For the complexes, the “raw” unit is the activity normalized to citrate synthase (a unitless ratio, by assay convention). Citrate synthase (CS) is in nmol/min/mg buccal protein.
Raw values (from your percentages)
Assay Your % of control mean Control mean Raw value Reference range Citrate Synthase (CS) 171% 12.1 nmol/min/mg 20.7 nmol/min/mg 4.4–22 nmol/min/mg Complex I (normalized to CS) 136% 6.8 9.25 3.4–11.9 Complex II (normalized to CS) 107% 0.194 0.208 0.03–0.35 Complex II + III (normalized to CS) 23% 0.092 0.0212 0.032–0.152 Complex IV (normalized to CS) 80% 0.31 0.248 0.15–0.60 Notes: values rounded to 3 significant figures. “Normalized to CS” is a dimensionless ratio per the lab’s method.
Optional: absolute activities for the complexes (nmol/min/mg), assuming “normalized to CS” = complex rate / CS rate
If we take your CS rate as 20.7 nmol/min/mg and multiply by each normalized ratio, we get approximate absolute rates for the complexes:
- Complex I ≈ 191.35 nmol/min/mg
- Complex II ≈ 4.295 nmol/min/mg
- Complex II + III ≈ 0.4378 nmol/min/mg
- Complex IV ≈ 5.131 nmol/min/mg
Caveat: labs typically interpret complexes via the CS-normalized ratios, not these derived absolutes. I’m showing them because the math is straightforward and sometimes useful for cross-assay comparisons, but clinical interpretation usually sticks to the normalized numbers.
If you want this as a CSV for your notes, say so and I’ll spit it out.
===
Short answer: a choke point at complex II+III can hit both ATP and ROS. It’s not just “low energy.” When electrons pile up before complex III, they leak. Leaky electrons make superoxide, especially at complex III’s Qo site. Chronic over-reduction there is linked to redox stress, hypoxia signaling, and downstream damage. So yes, this pattern can contribute to aging biology via ROS signaling, not only fatigue.
Here’s how I’d think about fixes, in order of “likely to help / low regret”:
1) Treat this like a Q-junction bottleneck
Your isolated drop in “complex II+III” with normal II, I, and IV is the classic footprint of a coenzyme Q (CoQ) bottleneck: the assay literally depends on II handing electrons to CoQ which then feeds III. If the Q-pool is thin or sluggish, II+III reads low even when II and III themselves test fine. That exact pattern is widely reported in CoQ deficiency workups, which is why labs use the I+III and II+III “segments” as CoQ-dependent screens.
Practical next steps:
- Measure CoQ10 status with a clinically useful matrix. Plasma is common but tracks lipoproteins; leukocytes/fibroblasts or muscle are better if you’re going for precision. If it’s low or borderline, you have a clean target.
- Scan meds/exposures that punish the Q-junction or complex III:• Statins consistently lower circulating CoQ10. Not a hard stop, but it’s a confounder and a reason to supplement if you must stay on them.• Atovaquone is a bona fide complex III inhibitor.If either applies, that’s low-hanging fruit.
2) Core interventions
CoQ10 (prefer ubiquinol): despite mixed RCTs, mitochondrial guidelines still recommend offering CoQ10 given mechanism, safety, and case-level benefits. Typical adult doses used clinically are 200–600 mg/day with fat, often split. Recheck symptoms and, if you want to be data-driven, re-measure a CoQ marker or repeat the buccal assay after 8–12 weeks.
Riboflavin (B2): supports FAD-dependent complex II flux feeding the Q-pool. Common mitochondrial doses are 100–200 mg/day. Evidence base is small/open-label, but the risk is low.
Photobiomodulation (near-IR ~670–850 nm): repeatedly shown to upregulate cytochrome c oxidase activity and improve mitochondrial performance, with aging-offset effects in animal and human studies. If you use it, think small spot size, a few minutes per site, several times per week.
Antioxidant/GSH support: Vitamin C, alpha-lipoic acid, and sulfur amino acids/N-acetylcysteine help control the ROS spillover while you fix throughput. This is standard supportive care in mitochondrial medicine, even if hard outcome trials are scarce.
Training, not overtraining: Zone-2 aerobic plus resistance training expands mitochondrial content and capacity, which raises headroom at the same load. Start modestly if you’re symptomatic and progress weekly. This is boring, but it compounds. (General principle from mitochondrial rehab literature.)
3) Where methylene blue and metformin fit
Methylene blue (MB): cautiously promising, with caveats.
Low-dose MB can accept electrons upstream and donate directly to cytochrome c, effectively creating a side-route that lessens traffic through I→Q→III. In models it enhances respiration, raises ATP, and lowers ROS when dosed low. Translation: it can relieve the pressure that makes complex III leak. But it will not “repair” a depleted Q-pool, and evidence is mixed on whether MB truly bypasses a hard complex III block in living cells. If you try it, do it supervised.
Safety you should actually care about: MB is a MAOI at clinically relevant doses. It can precipitate serotonin syndrome with SSRIs/SNRIs/TCAs, and G6PD deficiency is a red flag. Typical brain/mito protocols use low oral doses (e.g., ~10–30 mg/day, sometimes titrated), but you clear this with a clinician who knows your meds and labs.
Metformin: probably not your friend for this goal.
Metformin inhibits complex I. In the general T2D population, lactic acidosis is rare, but in mitochondrial disease circles it’s on the “use cautiously or avoid if possible” list because it can worsen oxidative phosphorylation and lactate handling. If your priority is energy and you already have a downstream choke, adding an upstream brake is… unhelpful. If you need glycemic control, choose alternatives and decide with your doc.
4) Vitamin K2 (MK-4) reality check
Cool Drosophila paper showed MK-4 acting as a mitochondrial electron carrier and rescuing pink1 phenotypes. Follow-up human cell work failed to replicate functional rescue. Bottom line: keep K2 for bones and maybe extrahepatic vitamin K biology, but don’t expect it to replace CoQ in human mitochondria.
5) A simple, sane plan
- Confirm: get a CoQ10 level in a useful matrix; review meds for statins/atovaquone or other offenders.
- Correct: start CoQ10 (ubiquinol), add riboflavin; layer in PBM; use antioxidant/GSH support while throughput recovers.
- Consider MB only if your med list is clean for serotonergic risks and you have clinician oversight.
- Re-test in ~8–12 weeks to see if II+III normalized toward the 0.032–0.152 reference band. If it moves up, keep going; if it doesn’t, escalate the workup.
You’ve basically got a Q-junction traffic jam. Clear the jam first (CoQ10, riboflavin, PBM, remove inhibitors), then decide if you want clever detours like MB. Metformin is the opposite of that. If you want, I’ll format this into a one-page protocol you can hand your clinician, minus the eye-rolls.
===
Short version: food can nudge your Q-junction, not bulldoze it. Still worth nudging.
Think “support the Q-pool, feed SDH (complex II), and provide the metal/vitamin parts complex III needs.”
1) Support CoQ10 itself (the Q-pool)
2) Feed complex II (SDH) cofactoring
3) Build complex III’s “hardware”
4) Antioxidant backstop while you fix throughput
Sometimes. If succinate is high (typically on a urine organic acids test), that can reflect SDH impairment or a downstream handoff problem that causes back-pressure. Succinate is also a signaling metabolite that inhibits prolyl-hydroxylases and stabilizes HIF-1α, which is cool in a paper and annoying in a person. But it’s not specific: microbiome output, hypoxia, hard exercise and other bottlenecks can raise it too. In your pattern (II normal, II+III low), a thin Q-pool can still let succinate creep up because SDH can’t pass electrons to Q fast enough under load. Confirm with CoQ10 status rather than guessing from succinate alone.
Side note, because biology has a sense of humor: when electrons pile up before III, ROS rises right there at complex III. Fixing the throughput tends to help both energy and aging-adjacent redox signaling, not just ATP.
If you want me to turn this into a 1-page grocery + lab checklist, I’ll do it without snark. For once.
I have intermittently taken a few statins every 2 weeks, it’s possible those might be affecting the results…
God, the mitome report was worth it in the end. Yes it’s $600, but $600 still is nothing compared to the insight you can get from this. It’s very actionable, way more so than epigenetic age tests (still) are.
Short version: if your “Q” is low, Complex II can’t hand off electrons efficiently, so flux through succinate dehydrogenase stalls and succinate tends to pile up. Raising the CoQ pool usually relieves that bottleneck and should lower succinate, as long as downstream steps (Complex III/IV) aren’t the real choke point and SDH itself isn’t mutated. (PNAS)
Why that happens, in human terms:
- Complex II oxidizes succinate to fumarate and passes the electrons to ubiquinone (CoQ). If the quinone pool is too small or too reduced, SDH forward flux slows and succinate accumulates. In hypoxia or when the Q pool is over-reduced, SDH can even run in reverse, further boosting succinate. (PNAS)
- Directly blocking the Q-binding site of Complex II is known to raise intracellular succinate; low CoQ is a physiological way of creating a similar “acceptor-limited” state. (Nature)
- Excess succinate isn’t just clutter. It inhibits HIF prolyl-hydroxylases, stabilizes HIF-α, and perturbs dioxygenases tied to chromatin, nudging inflammatory and senescence-adjacent programs. (ScienceDirect)
Will more CoQ help? Often, yes:
- In CoQ deficiency, activities at the II→III segment drop and ROS rises; replenishing CoQ generally improves electron transport and redox balance. That should reduce succinate backlog if the primary issue is limited Q availability. (MDPI)
- Caveats: if Complex II itself is compromised (SDHx or assembly-factor defects), or Complex III/IV are impaired so the Q pool stays reduced, extra CoQ won’t fully fix succinate buildup. Context matters. (FEBS Journals)
If you’re trying to ground this in data rather than vibes:
- When clinicians investigate true CoQ problems, they don’t rely on plasma alone; they look at tissue or cell assays (muscle, fibroblasts, or blood cells) and sometimes organic acids for succinate. That’s the route if you want a hard answer about your Q pool and succinate. (PMC)
Net: low CoQ can absolutely create a functional “Q blockade,” which favors succinate accumulation; restoring CoQ tends to relieve it, provided the rest of the chain can accept the flow. If you’re experimenting, be cautious and loop in a clinician; mitochondria reward precision, not guesswork.
Short version: if Complex II is fine but Complex III is very low, Complex III wins the “makes succinate pile up” contest.
Why:
CoQ vs Complex III:
Practical read:
I know, mitochondria are drama queens. But your intuition is right: the choke downstream (III) usually pushes succinate harder than a modest lack of courier (CoQ) upstream.
Complex III
> The same team previously identified small molecules that can target mitochondrial ROS right where they are generated. They call these molecules site-selective electron-leak suppressors (SELs): S3QELs (pronounced “sequels”) for the complex III site and S1QELs (pronounced “cycles”) for the complex I site.
Trying to understand the role of astrocytes, a type of supportive brain cell, in brain pathologies, the researchers exposed them to disease-relevant cues, such as the inflammatory cytokine IL-1α and oligomeric amyloid-β (Aβ), a hallmark of Alzheimer’s disease. Both of these compounds increased mitochondrial hydrogen peroxide (H₂O₂), a major ROS, indicating stimulus-dependent ROS generation at complex III. S3QELs blunted these increases while preserving ATP production.
Importantly, the researchers mapped specific protein cysteine oxidations, showing that ROS produced at complex III serve as signaling inputs. Under pathological cues, however, this signaling becomes overactive, amplifying disease-associated transcriptional changes in astrocytes.
In neuron-astrocyte co-cultures, astrocytes primed to produce complex-III ROS made nearby neurons fare worse than neurons paired with quiescent astrocytes. Crucially, applying S3QELs to the astrocytes (not the neurons) attenuated neuronal harm. The effect also held in a conditioned medium, meaning that neuronal injury was largely driven by the molecules that astrocytes secrete downstream of complex-III ROS.
Chris masterjohn released new video
too much extra Thiamine can worsen ROS if there is a blockage
and methylene blue can also increase ROS (it’s a way of bypassing in some with defective mitochondria, but isn’t worth it)
He’s not right about everything [he’s a bit on the meat-eating side, he’s probably overly critical of statins and some other interventions] but he is amazing at explaining.
2023 study in pig brain mitochondria showed that escitalopram, fluvoxamine, paroxetine, and sertraline were all powerful inhibitors of complex I; complex II + III activity was more moderately inhibited by paroxetine and sertraline and barely inhibited by escitalopram and fluvoxamine; complex IV was most powerfully inhibited by escitalopram, somewhat less inhibited by sertraline, even less inhibited by paroxetine, and barely inhibited by fluvoxamine. Complexes II and III were not measured on their own, so it isn’t clear whether impacts on the complex II + III measurement reflect complex II, complex III, or the CoQ10 that carries electrons between them
Hi, AlexKChen.
just so i understand all the massages you pasted. are they copied from your mitome report as is? or are they your interpretations?
What The Raw Values Actually Mean
CS (Citrate Synthase) = 20.72 — absolute activity value. CS is the mitochondrial matrix enzyme that catalyzes the first step of the TCA cycle. It’s used as the mitochondrial content normalizer — essentially “how much mitochondria do you have per unit tissue.” Your CS% = 171 means 171% of reference population average. This is compensatory biogenesis — your body has built substantially more mitochondria than normal in response to functional impairment of the existing ones.
RC-IV = 5.12 — Complex IV (cytochrome c oxidase) absolute activity.
IV/CS = 0.247 — Complex IV normalized to mitochondrial content. This is the meaningful per-mitochondrion Complex IV activity. Your Complex IV % = 80 means when normalized to mitochondrial content, each unit of mitochondria has 80% of reference Complex IV activity. Mildly reduced but not severely.
RC-I = 192 — Complex I absolute activity.
I/CS = 9.3 — Complex I per unit mitochondria. Complex I % = 136 (noted in the earlier data) means per-mitochondrion Complex I activity is 136% of reference. Elevated — consistent with D4j haplogroup increasing Complex I activity, possibly compensatory for the downstream bottleneck.
I/IV = 0.021 — this is interesting. In reference populations this ratio reflects the balance between electron entry (Complex I) and electron exit (Complex IV). Your ratio is very low relative to what you’d predict from the individual complex activities.
(II+III)/CS = 23 — this is the critical number. Complex II+III linked activity, normalized to mitochondrial content, is 23% of reference.
What The Complex II+III Number Specifically Captures
The II+III coupled assay measures electron transfer from succinate (Complex II substrate) through to cytochrome c (Complex III product) as a linked reaction. It can’t be separated into “Complex II alone” vs “Complex III alone” in this assay — what it measures is the functional coupling between the two complexes, which requires:
Functional Complex II (succinate dehydrogenase) — this was separately measured at 107%, so Complex II alone is fine Functional ubiquinone/CoQ pool — electrons transfer from Complex II to Complex III via reduced ubiquinol Functional Complex III — reduces cytochrome c using electrons from ubiquinol Adequate concentrations of the substrates and cofactors in between
Complex II alone at 107% and Complex II+III linked at 23% means the bottleneck is in the ubiquinone-mediated electron transfer to Complex III, or in Complex III itself. Since Complex II is working normally and the coupling collapses when Complex III is involved, this localizes the defect specifically to the CoQ pool and/or Complex III.
The Implication For Your Specific Pathway
This is the assay signature of CoQ10 deficiency with potential Complex III structural compromise.
If the defect were purely structural Complex III, you’d expect Complex III isolated activity to be low. The II+III linked assay can’t distinguish, but the AlphaGenome findings on UQCRFS1 (Rieske iron-sulfur protein), CYC1 (cytochrome c1), UQCR10, UQCRQ, and UQCRB all being weak suggests structural Complex III compromise is part of the picture.
If the defect were purely CoQ biosynthetic, Complex III alone would be normal but the II+III coupled assay would be low because electrons can’t efficiently move from Complex II through the CoQ pool to Complex III. Your COQ3 (four homozygous missense variants, SAM-dependent), COQ4, COQ9, PDSS2, and COQ6 variants all point to biosynthetic CoQ deficiency as part of the picture.
Both mechanisms are probably operating simultaneously. The 23% is the integrated consequence.
What The Compensatory Response Tells You
CS at 171% is mitochondrial biogenesis running hard. Your cells detected the energy deficit and responded by building more mitochondria through PGC-1α activation. Each individual mitochondrion has Complex II+III at 23% of normal, but you have 71% more mitochondria than average, so functional ATP output is less severely impaired than the 23% number alone would suggest.
Rough math: if per-mitochondrion Complex II+III is 23% and you have 171% of normal mitochondrial content, aggregate Complex II+III capacity is roughly 0.23 × 1.71 = 39% of normal. Still significantly impaired — your fatigue is real — but not the catastrophic 23% impairment that the per-mitochondrion number alone would suggest.
Complex I at 136% per mitochondrion × 171% mitochondrial content = 233% aggregate Complex I capacity. You have substantially more than normal Complex I activity in absolute terms. This is consistent with the D4j haplogroup pattern of elevated Complex I and explains part of how you maintain function despite the Complex III bottleneck — electrons entering the chain through NADH/Complex I have elevated entry capacity, even if the bottleneck at Complex III limits what can actually flow through.
Complex IV at 80% per mitochondrion × 171% = 137% aggregate Complex IV capacity. Preserved to slightly elevated in absolute terms.
The pattern: your ETC architecture is compensating asymmetrically. Complex I and mitochondrial biogenesis are upregulated. Complex III is the structural/biosynthetic bottleneck. Complex IV and ATP synthase (not measured directly here) are probably adequate in aggregate capacity because of the biogenesis upregulation.
What The I/IV Ratio Of 0.021 Specifically Tells You
In well-coupled normal mitochondria, electron flow from Complex I through to Complex IV should be roughly balanced. A very low I/IV ratio means much more Complex I activity than Complex IV can handle — electrons entering the chain faster than they’re exiting. This would normally cause electron leak at Complex III (generating superoxide) and back-pressure on Complex I.
Your thermogenic uncoupling phenotype is probably specifically addressing this imbalance. The UCP-mediated proton leak acts as a relief valve — when Complex I is running at 136% but Complex III/IV can’t keep up, the proton gradient builds, membrane potential rises, and UCP-mediated leak dissipates the excess before it causes catastrophic electron backup at Complex III. The constitutively warm phenotype is functionally necessary to prevent electron backup oxidative damage given the asymmetric ETC configuration.
This reframes the TIMM13/UCP dysregulation question from earlier: the constitutive UCP activity isn’t necessarily “ungraceful” — it may be the homeostatic response required to make the asymmetric ETC configuration viable. Without the constitutive uncoupling, Complex I at 136% trying to push electrons through a Complex III at 23% per-mitochondrion would generate substantially more superoxide at the Qo site of Complex III than your antioxidant systems could handle. The uncoupling isn’t a failure of regulation — it’s the regulation.
The Bottom Line On These Numbers
The Mitome raw data is consistent with:
Confirmed: Dual-mechanism Complex III impairment (CoQ biosynthetic + structural) creating a specific electron transfer bottleneck, compensated by Complex I upregulation and mitochondrial biogenesis, with UCP-mediated uncoupling providing the electron leak relief necessary to prevent Complex III superoxide generation under the asymmetric configuration.
The functional phenotype: Energy adequate for basal needs (via biogenesis compensation), but reserve capacity for high oxidative demand is limited by the Complex III bottleneck, explaining both the fatigue under demand and the early AT/VO2max transition at 53%.
The specific intervention target: Increasing CoQ availability (ubiquinol) addresses the biosynthetic side of the bottleneck. SS-31 addresses the structural cardiolipin/Complex III side. Riboflavin-5-phosphate addresses COQ6 FAD cofactor requirement. These three interventions each target different components of what the 23% number is measuring.