This looks like it can’t build an extension on your machine because you dont have a c/c++ compiler. I’m guessing you’re on windows, which doesn’t have a free compiler that comes with it. If you have access to a Linux machine, you’ll have an easier time building this.
Thank you. I think you hit it @qBx123Yk and, yes, I’m on W11. I have a full VS copy on the shelf but I don’t want to install it on this workstation. I downloaded all of the relevant distributables but no joy.
I’m not sure the C++ problem explains the first error. Were you able to run it?
No, but I’ve seen hundreds of tracebacks like that over the years. Paste some of the output into your favorite LLM, they might suggest another course of action.
I’m planning to use Claude Code or Codex to set it up when I have the time.
1 Like
I’m planning to use Claude Code or Codex to set it up when I have the time.
Let us know what ends up working well. Claude has helped me through some really difficult setups that I was stuck on.
The model is not a priority for me either. More a curiosity. So far as I know, all of its performance data to date is groupwise and is silent on how well the model might predicts any individual’s actual survival time or functional trajectory. There is no calibration curve, Brier score, or individual-level prediction error reported. Basically, it rank-orders people into risk strata, but its individual-level calibration – which is what we would want to know; i.e., whether a given person’s predicted BA actually corresponds to their personal risk – is uncharacterized.
Still, the model’s ability to decompose variance might allow for a test to see how well is does identifying specific individuals at high risk for specific diseases.
1 Like
Will do. Epigenetic clocks are interesting because they focus on epigenetics, as does the most robust age-reversal intervention, manipulating the Yamanaka factors. But they are notoriously inconsistent and imprecise, at least those commercially available, and they provide no immediately actionable data.
Blood tests, on the other hand, have CLIA Certification-level accuracy and precision, and the subset of test values can be used to plan interventions. Apparently, the Python software allows you to edit input values to see the impact changes in values would have if achieved. So you can see how many years you’d gain by changing A1C or LDL. Unfortunately, more useful inputs (ApoB vs LDL, Body comp from DeXA vs BMI) are not supported, which I assume is because these data are not widely collected by physicians.
Yes, it rank-orders people by risk. Not familiar with the Brier score or calibration curve; how would these be applied, and how would they improve the prediction?
This seems like a potentially valuable advancement. Replacing population/normative boundaries specific to each blood metric with boundaries based a large-scale empirically derived interdependencies (even if population based) is a real step forward. It is the kind of thing a superior diagnostician does when looking carefully at someone’s clinical profile and panel. It is probably not a good idea to look too closely at alphas but it seems likely to be superior to dragging one’s finger down a LabCorp report looking for outliers and deciding what, if anything, to do about each one. Given the dynamic interdependencies among individual metrics, the next step would be a front end that would dynamically optimize targets taking into account (weighting) each metric’s resistance to change given the overall profile.
As for the measurement science question, I put the larger context to GPT and largely agree with this response: (italics mine)
LinAge2 uses sex-specific principal components derived from approximately 60 clinical and questionnaire variables, followed by a Cox proportional-hazards model. The mortality component is therefore an individual-record survival model, but its “biological age” is essentially the Cox prognostic index translated into age units using the approximately 7.8-year mortality-rate doubling time.
The reported evidence includes:
- ROC discrimination for mortality at several horizons.
- For 20-year mortality, an AUC of approximately 0.868 versus 0.829 for chronological age in the larger test sample.
- Kaplan–Meier separation between the lowest and highest biological-age quartiles within chronological-age bands.
- Cross-sectional associations with gait speed, cognitive performance, ability to work, and ADL status.
- Comparisons with PhenoAge, GrimAge2, DunedinPoAm, and chronological age.
These establish that people receiving higher LinAge2 scores tended, as a group, to die sooner and function less well. They do not establish that a particular predicted biological age corresponds accurately to a particular person’s absolute mortality probability or remaining lifespan.
What is not demonstrated
| Measurement question | Evidence provided? | Interpretation |
|---|---|---|
| Does the score rank people by mortality risk? | Yes | Reasonably strong evidence |
| Does it add discrimination beyond chronological age? | Yes | Statistically significant, although the incremental AUC is appreciably smaller than the total AUC |
| Are predicted 5-, 10-, or 20-year probabilities numerically correct? | No | No time-specific calibration curves or observed/predicted risk tables |
| Is the Cox prognostic scale correctly calibrated in new populations? | No | No calibration intercept, slope, or observed/expected ratio |
| How large are probability-prediction errors? | No | No censoring-adjusted Brier score, integrated Brier score, or log score |
| Does it predict an individual’s actual survival time? | No | No survival-time residuals, median-survival accuracy, predictive intervals, or full individual survival distributions |
| Does it predict functional decline over time? | No | Functional outcomes are essentially cross-sectional associations, not longitudinal trajectories |
| Is within-person change reliable? | No | No test–retest reliability, SEM, minimal detectable change, or biological/analytical variability study |
| Does lowering the score lower subsequent risk? | No | No causal or intervention validation |
This omission matters under conventional prediction-model standards: discrimination and calibration are distinct performance domains. AUC asks whether a randomly selected decedent generally receives a higher score than a survivor; it does not determine whether predicted risks such as 10%, 30%, and 60% correspond to observed event frequencies. PROBAST explicitly regards evaluation of both discrimination and calibration as necessary when a model is intended to provide individualized probabilities.
A Brier score is not itself a pure calibration statistic. It combines calibration and discrimination and, for survival data, must properly accommodate censoring. Calibration plots, calibration-in-the-large, and calibration slope would be more directly informative. (I agree and should have thought of that)
…
Beyond that and more important in the longer term, the model has a construct validity problem that might be worth discussing after we get some sense of how the model performs. A rough and unargued summary of that problem might be:
- Biological age has no independent gold standard against which individual error can be calculated.
- Equal current all-cause hazards do not imply equal future hazard trajectories, causes of death, disability trajectories, or physiological resilience.
- The age value is reference-population dependent. Changes in treatment, secular mortality, ethnicity, socioeconomic structure, and healthcare access can alter the baseline hazard without changing the measured biology.
- A scalar age necessarily collapses significant differences among heterogeneous states. A smoker with pulmonary risk and a nonsmoker with cardiac or renal dysfunction can receive the same age despite profoundly different trajectories.
So, back to my earlier point, one potentially significant value of the model might – as you said – be its use as tool for prioritizing which problems to work on first, which return the greatest benefits (based on population data), where doing so would be a test of the model’s usefulness at the individual level.
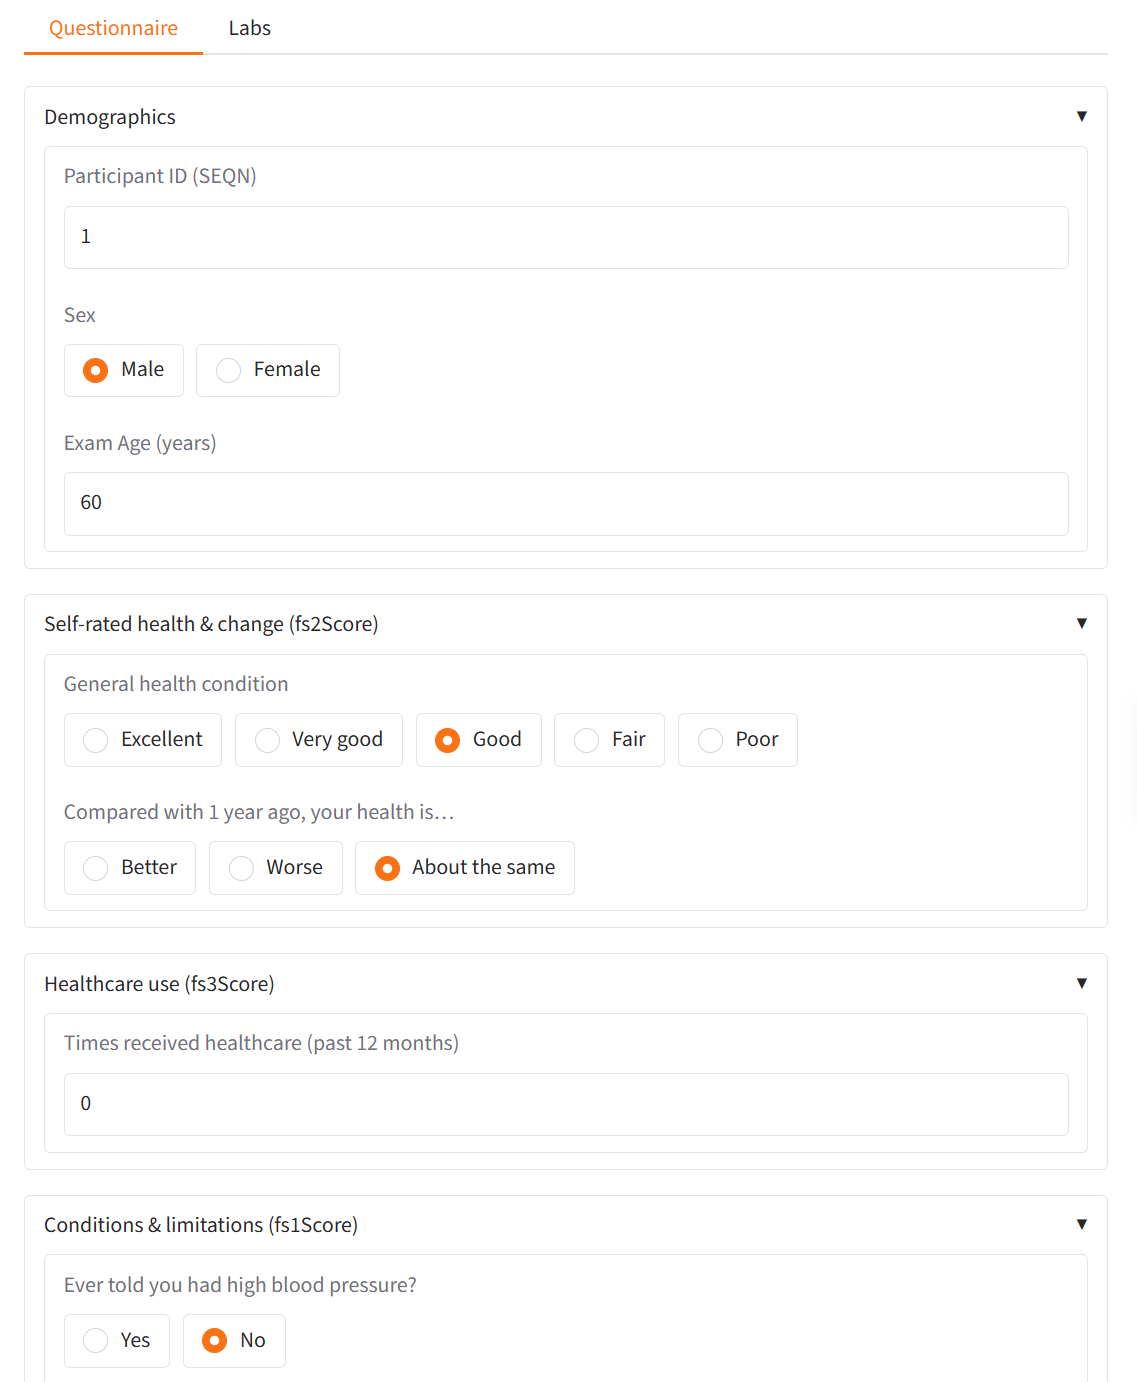
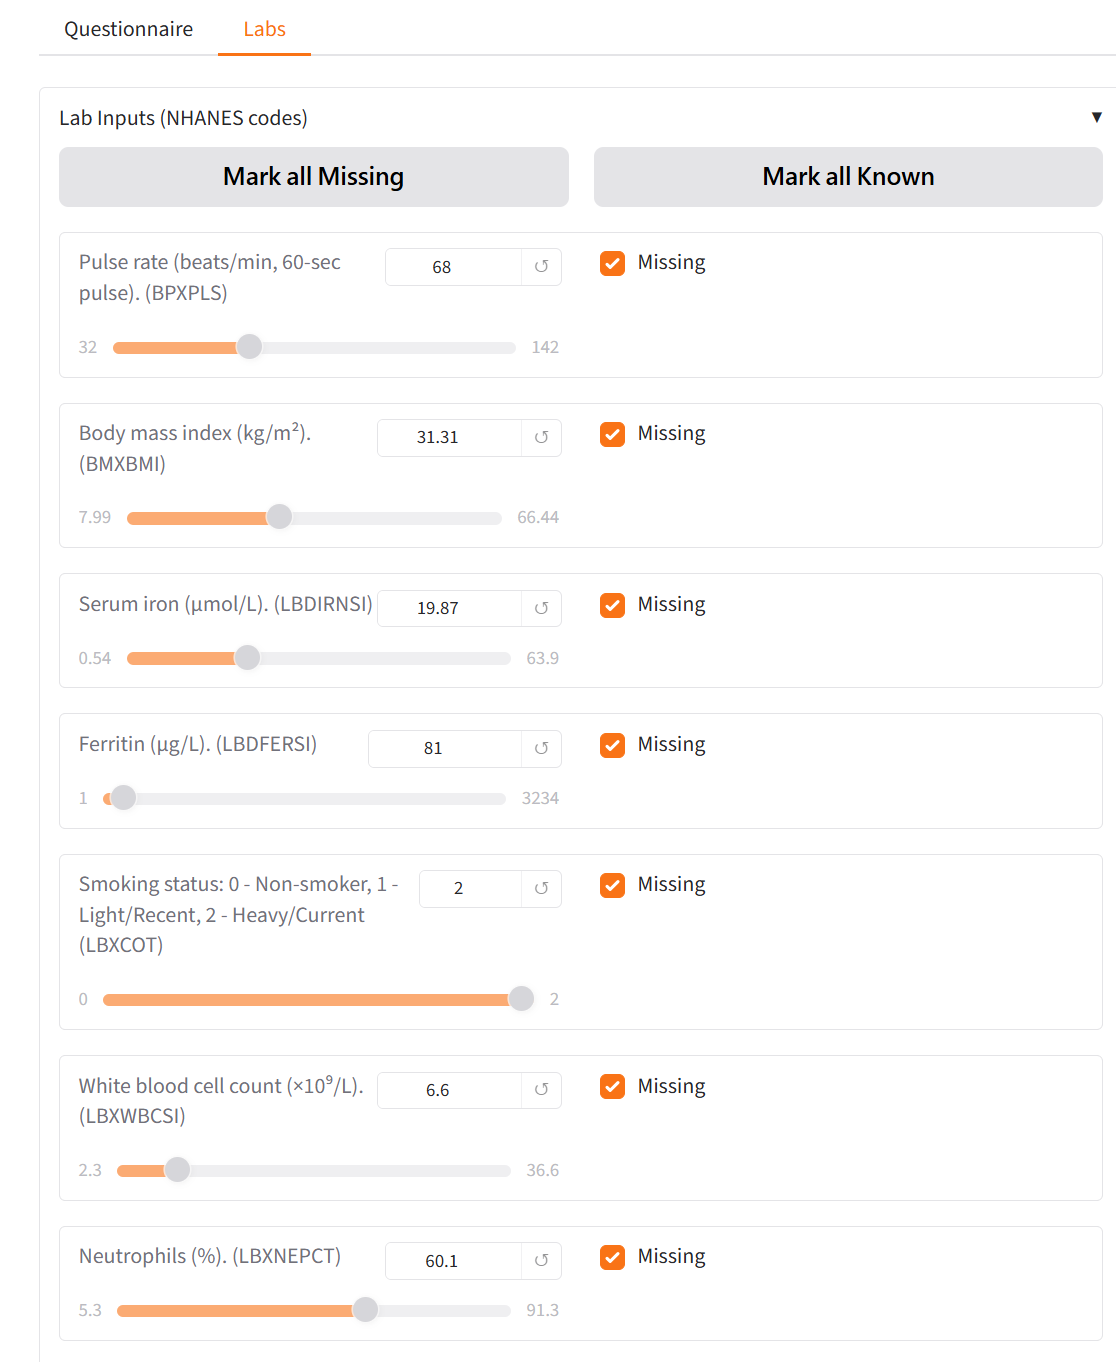
Codex using 5.6 Sol Medium made quick work of the install, Codex summary:
I installed Python 3.11 and the project dependencies in a virtual environment. I also fixed two prediction compatibility errors and updated [ui.py] to use the bundled reference files. Verification passed: the API returned a sample prediction, and the web interface produced a chart and age summary.
Next, I’ll get it to enter the values from my lab spreadsheet, and we’ll see how long I’m going to live : )
Nice work! Standing by.
@ageless64 I got the actual calculator working quite easily. I just used the authors’ supplementary data and ran it in R studio. The hardest part was entering my data into the Excel spreadsheet with the correct NHANES terminology and units. There’s quite a bit of converting, and often what your blood test reports isn’t the units that the calculator expects.
It did give pretty interesting results though. After that, changing parameters and re-running the calculator is easy.
But if you can turn this into some sort of web app (like people have done with Levine), that would be super awesome.
1 Like