We often hear that we lose muscles mass as we age, but the amount of loss across different muscle groups has never been quantified. This is a nice review paper that gives us some concrete numbers about how much muscle mass loss we should expect on average in our hamstring, trunk, leg, arms, etc. This data can inform how we should exercise so that we reduce muscle loss.
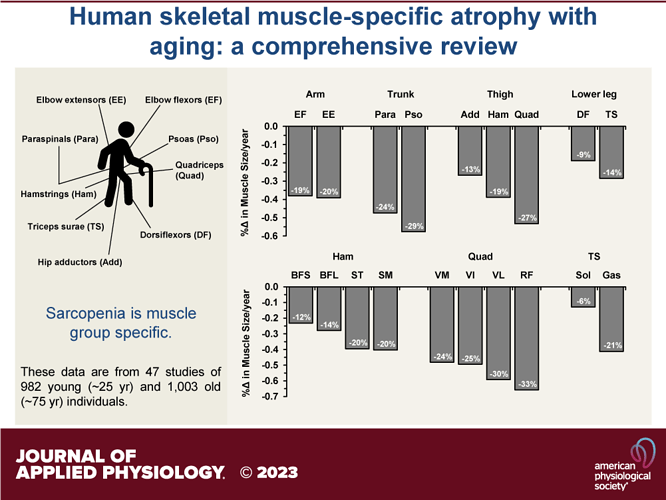
Graphical summary:
The main findings of this literature review are 1) nonquadriceps data for human skeletal muscle aging are limited and 2) with the available information, a diverse range of muscle atrophy rates with aging is apparent.
Atrophy in the Thigh region:
the quadriceps appears to have the greatest rate of atrophy with a hierarchical pattern (Fig. 1): quadriceps (−27%) > hamstrings (−19%) > hip adductors (−13%) […] In the quadriceps, the rectus femoris appears to have a greater rate of muscle atrophy than the vasti muscles. In the hamstrings, the medial muscles (semimembranosus and semitendinosus) seem more sensitive to the aging process than the lateral side of the muscle group (biceps femoris)
Atrophy in the Lower leg:
The lower leg muscles appear to be less susceptible to age-related atrophy than the thigh muscles […]. From the available data in the literature on the lower leg muscles, there seems to be a trend toward a higher rate of muscle atrophy in the gastrocnemius than the other lower leg muscles (Fig. 1). This is supported by greater activities in the soleus and tibialis anterior than gastrocnemius during walking
Atrophy in the Trunk:
Somewhat greater muscle atrophy in the psoas (−29%) than in the paraspinals (−24%) follows the suggestion that muscles with more sustained work atrophy less
Atrophy in the Arm:
available data suggest that age-related muscle atrophy does not seem to be different between elbow extensors (−19%) and elbow flexors (−20%).
Atrophy rates throughout life:
the atrophy rates are widely different across muscle groups. In addition, the greater rates of muscle atrophy in the last decade of the 50 yr age span studied in the cross-sectional examinations suggest a nonlinear decline in the size of these muscles (25–75 yr vs. 65–75 yr; paraspinals: −0.47%/yr vs. −0.79%/yr, psoas: −0.58%/yr vs. −0.83%/yr, hamstrings: −0.39%/yr vs. −1.22%/yr, quadriceps: −0.53%/yr vs. −1.32%/yr). This has also been shown in cross-sectional studies of the quadriceps that compared middle-aged to old (42, 215, 216) and old to older individuals (42, 216–218). This nonlinearity of atrophy is likely muscle specific as well.
Link to paper here:
https://journals.physiology.org/doi/full/10.1152/japplphysiol.00768.2022
