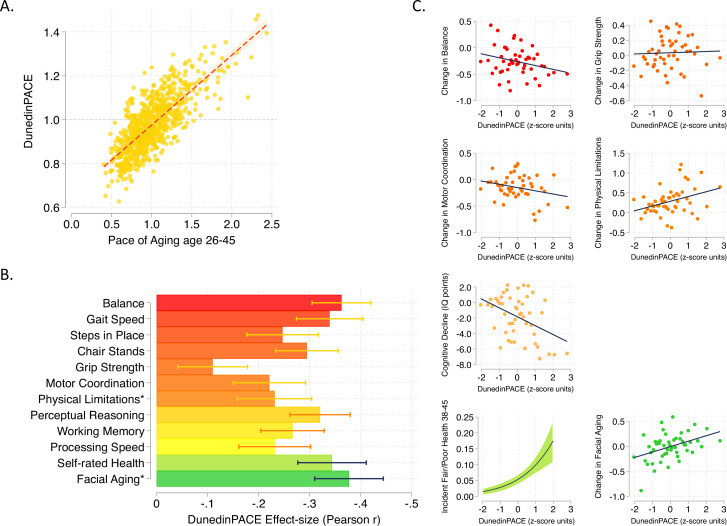
DunedinPACE tracks changes in 19 biomarkers of organ-system integrity in the 1000-member Dunedin Study birth cohort, who were first enrolled in the study at birth in 1972-1973 and have been followed up ever since, most recently at the time of their 45th birthday. This study used data collected from the participants when they were all aged 26, 32, 38, and 45 years.
I mean, they did a longitudinal study, and that longitudinal study mostly looked at markers of strength or capacity rather than markers of damage.
And if it’s strength/capacity changes with age, then [a] calorie restriction may prevent an increase, [b] they can be easily corrected with follistatin or GDF15 or whatever.
So DunedinPACE was taken out of this study
https://www.pnas.org/doi/10.1073/pnas.1506264112
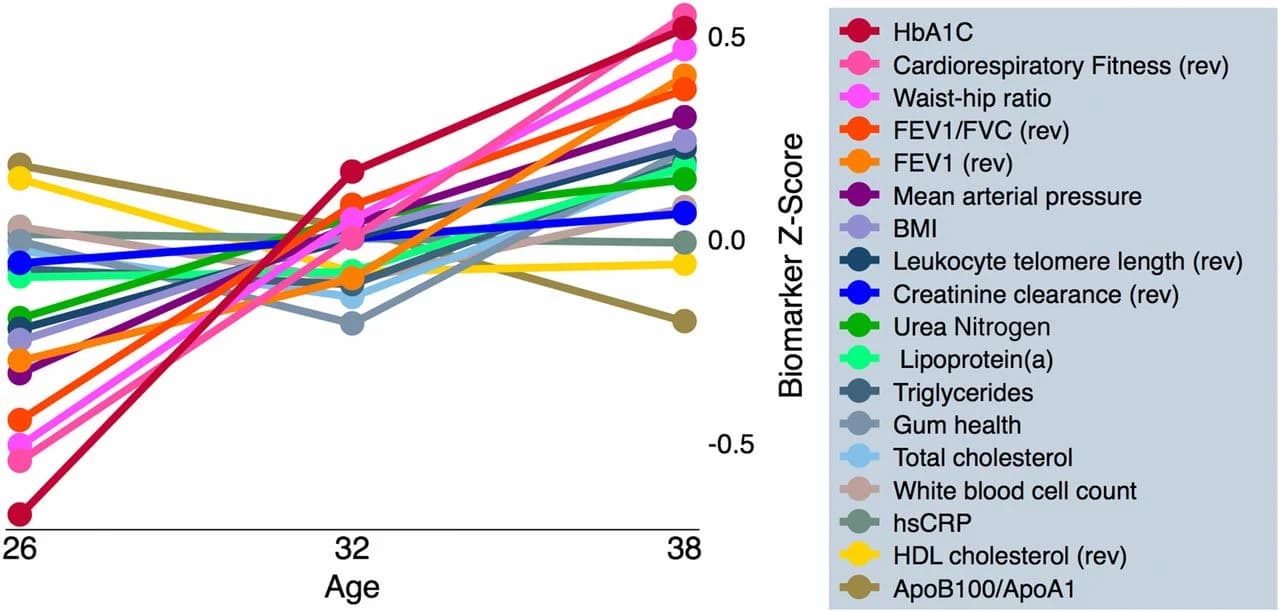
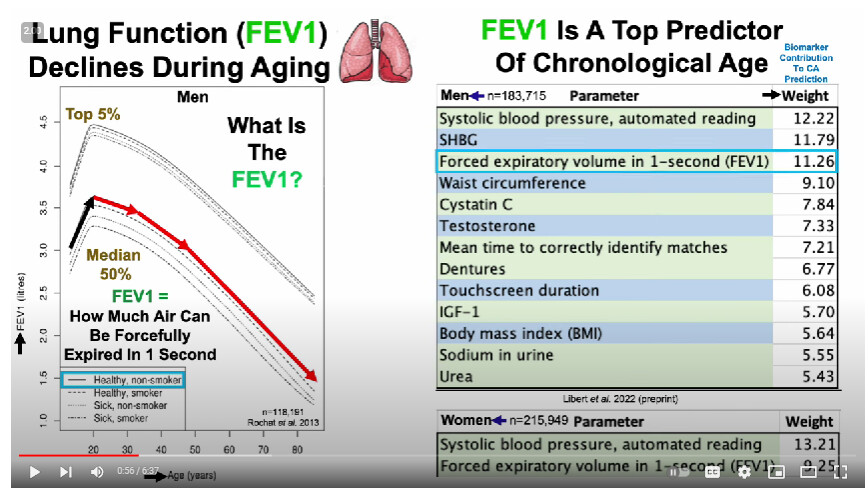
Ok, so you have to differentiate between the biomarkers that don’t change with age in super-healthy people (eg Mike Lustgarten or CRONites) [and the blood tests/blood pressure/waist to hip ratio of CRONites pretty much does not change for that entire range] from those that do change with age (which is, like, uh, just FEV1/FVC, leukocyte telomere length, and… uhh… that’s it?) [I don’t know if they used these markers to detect pace of aging change because, like, the vast majority don’t change in super-healthy people]… There are way better ones
We used data from the Dunedin Study 1972-1973 birth cohort tracking within-individual decline in 19 indicators of organ-system integrity across four time points spanning two decades to model Pace of Aging
(well, if you look at the above traits HERE, then yes, most of these DO change with age over that timecourse, even in ultra-healthy people [eg even with the best possible diet, a 35 year old is unlikely to be a grandmaster starcraft player or youthful olympic athlete]). These things are harder for someone to measure longitudinally from afar except in the context of a clinic, however. Even routine doctor visits fail to measure these…
====
Random notes on fraility and GDF15 below::
=====
- coders of longevity variants have lower GDF15 ()on effect of longevity variants on molecular aging rate)
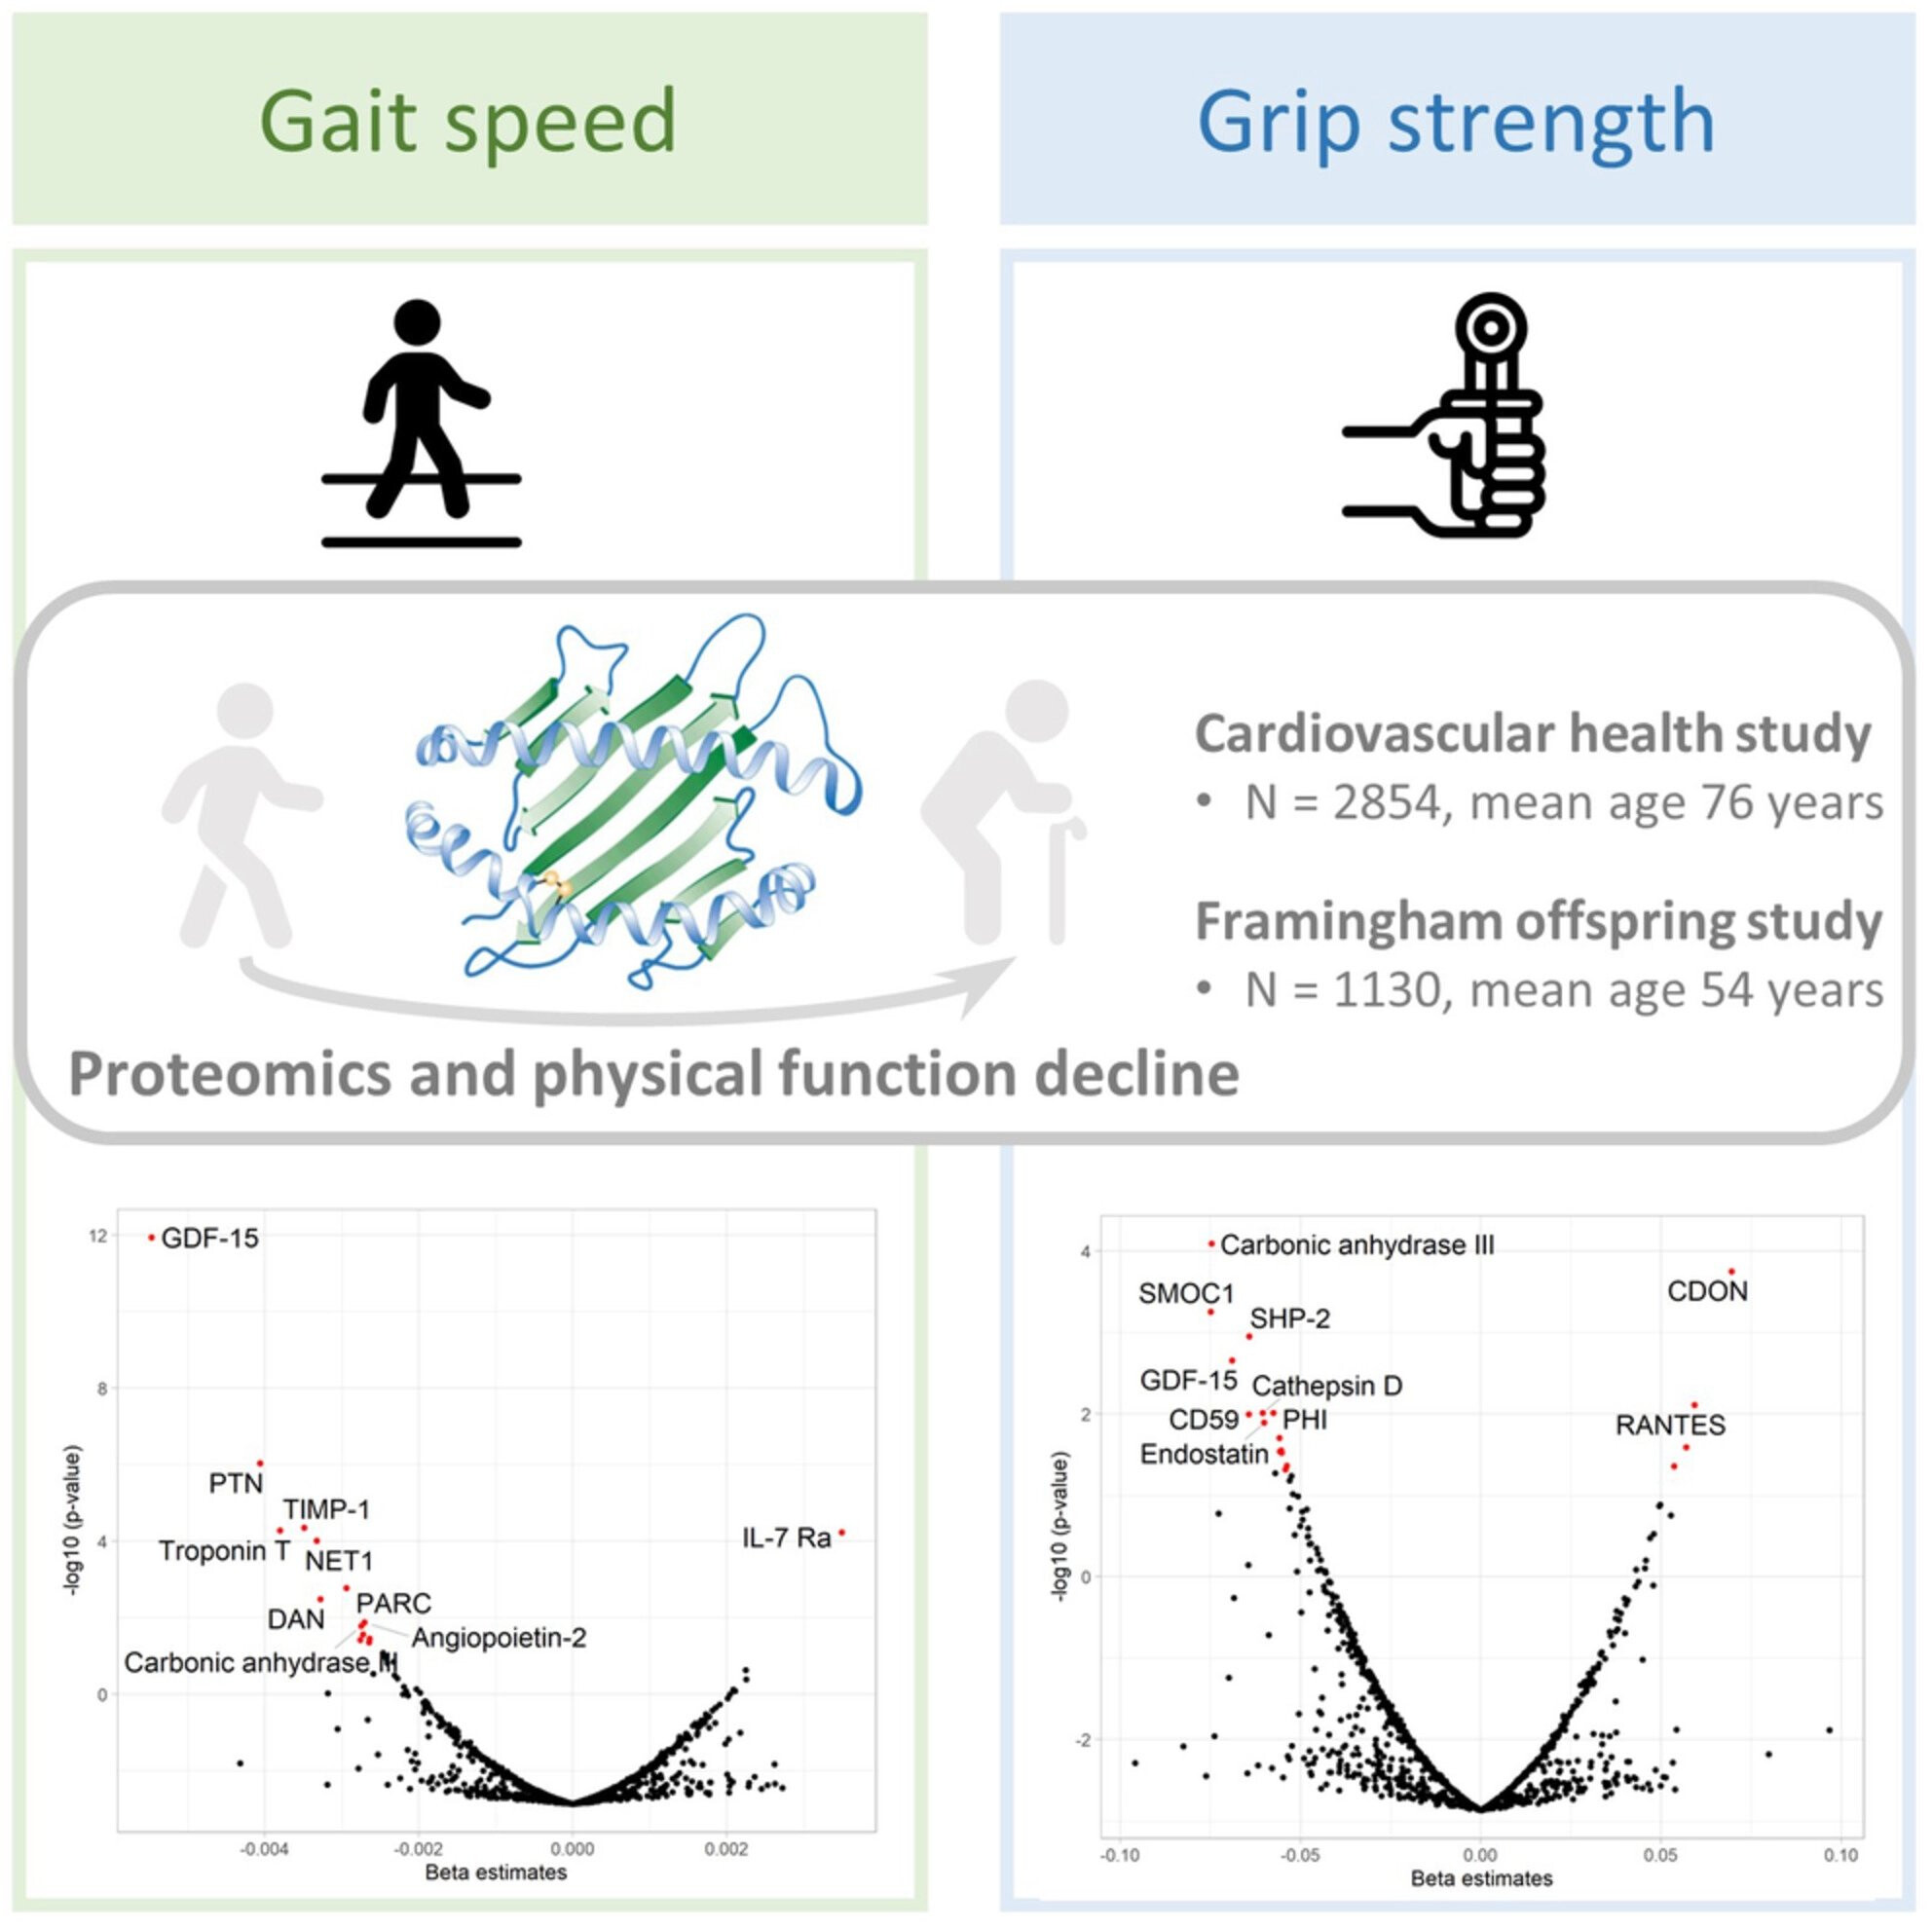
- Several proteomic studies using the SOMAscan platform have
investigated the proteomic profiles of aging-related outcomes and
reported associated observation of GDF-15, PTN, spondin-1, URB, FSTL3,
and SMOC1 with frailty and mobility disability, and mortality, in older
people (Osawa et al., 2020; Sathyan, Ayers, Gao, Milman, et al., 2020; Sathyan, Ayers, Gao, Weiss, et al., 2020).
Of these, GDF-15, a stress-induced cytokine and a divergent member of
the transforming growth factor (TGF)-β superfamily, was the protein most
strongly associated with physical function decline in our study. Recent
studies have consistently demonstrated the upregulation of GDF-15 in
aging (Tanaka et al., 2018)
and showed that higher GDF-15 relates to higher risk of diabetes,
cancer, cognitive impairment, cardiovascular diseases, and mortality
(Justice et al., 2018).
It has been proposed that GDF-15 is a stress-induced cytokine in
response to tissue injury and can be utilized as a biomarker for various
diseases (Emmerson et al., 2018).
An Italian cohort study showed that GDF-15 is associated with the
development of mobility disability in community-dwelling older adults
(Osawa et al., 2020).
Furthermore, investigators from the Baltimore Longitudinal Study of
Aging (BLSA) found that elevated plasma GDF-15 was associated with
slower gait speed and low physical performance but not with muscle
strength in community-dwelling adults (Semba et al., 2020).
However, this study included very healthy adults and adopted a
cross-sectional design and therefore is limited in revealing biomarkers
for longitudinal changes in physical function. More work is needed to
further elucidate the underlying molecular mechanisms of GDF-15 in
functional decline.