Table 3
Cox elastic net regression model.
| Covariate (X) |
Abbreviation |
Coefficients (β) |
| DNAm adrenomedullin |
DNAmADM |
0.00609 |
| DNAm beta-2-microglobulin |
DNAmB2M |
2.79E-07 |
| DNAm cystatin-C |
DNAmCystatin C |
4.08E-06 |
| DNAm growth differentiation factor 15 |
DNAmGDF-15 |
0.00035 |
| DNAm leptin |
DNAmLeptin |
-2.03E-05 |
| DNAm log C-reactive protein |
DNAmlogCRP |
1.90266 |
| DNAm log hemoglobin A1C |
DNAmlogA1C |
0.40359 |
| DNAm plasminogen activator inhibitor 1 |
DNAmPAI-1 |
0.02941 |
| DNAm tissue inhibitor metalloproteinases 1 |
DNAmTIMP-1 |
3.67E-06 |
| DNAm pack-years |
DNAmPACKYRS |
0.00014 |
| Chronological age |
Age |
0.02676 |
| Female |
Female |
-0.14212 |
Open in a separate window
The table lists the finalized covariates in the final Cox regression model with elastic net penalty and their coeffects. A linear combination of XTβ yields an estimate of logarithm of proportional hazard, which is the raw value of DNAmGrimAge2 before calibration. The finalized DNAm GrimAge2 is based on transforming the raw variable into a distribution in units of year The columns report the name of the covariate (e.g. DNAm based biomarker), its abbreviation and coefficient under the final Cox regression model with tuning parameter λ determined by 10-fold cross validation.
===
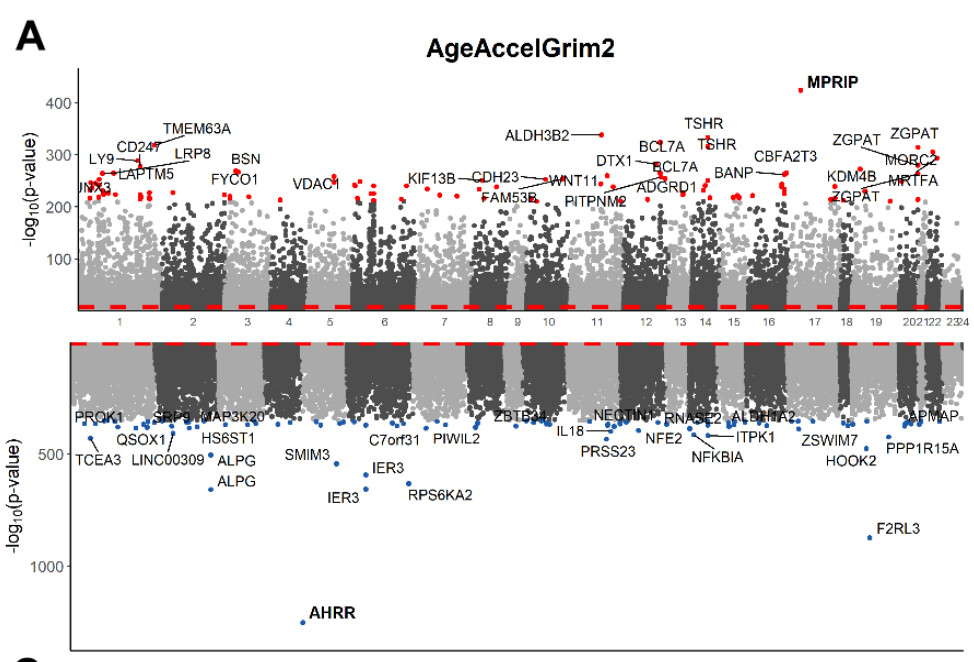
Evaluation of younger individuals
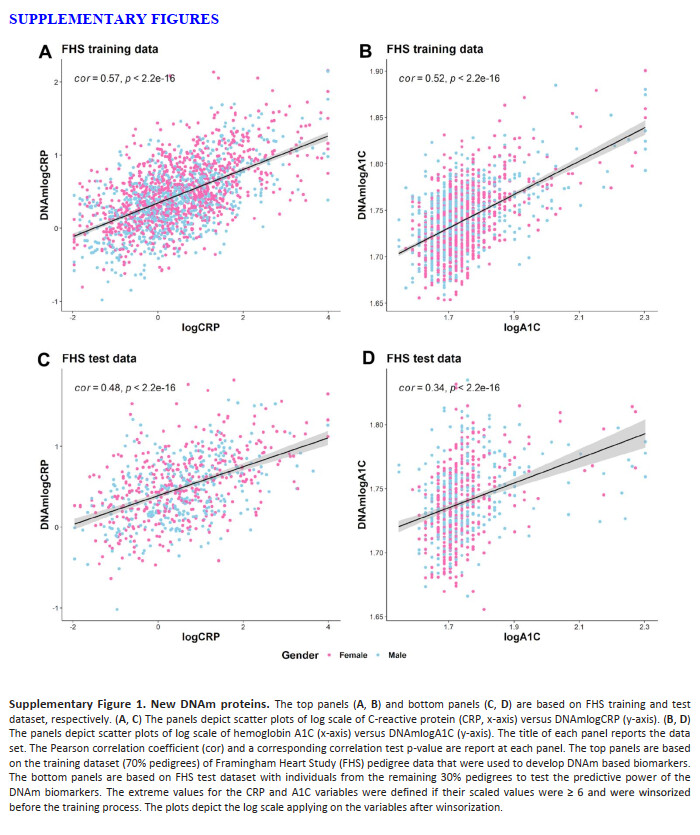
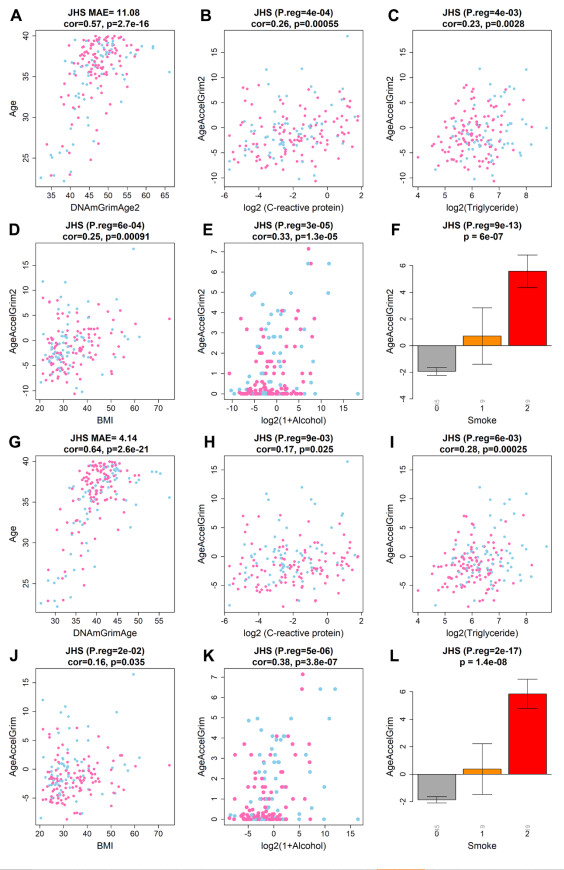
Next, we examined the performance of GrimAge clocks on younger individuals (age < 40) using 173 individuals (minimum at 22 and mean age at 35.4 years) from JHS. As expected, AgeAccelGrim2 was still associated with age-related biomarkers including inflammation marker CRP (r=0.26 and P=5.5x10⁻⁴), dyslipidemia marker triglyceride levels (r=0.23 and P=2.8x10⁻³), and body mass index (r=0.25 and P=9.1x10⁻⁴, Supplementary Figure 20B–20D). AgeAccelGrim2 is also associated with life style factors such as alcohol assumption (r=0.33 and P=1.3x10⁻⁵, Supplementary Figure 20E) and smoking (P=6.0x10⁻⁷, Supplementary Figure 20E). The associations remain significant even after adjusting for age and gender in multivariate regression analysis (Supplementary Figure 20). However, DNAmGrimAge2 is not aligned with chronological age in younger individuals. Rather, it exhibits a systematic offset resulting in a median absolute error (MAE) of 11 years (Supplementary Figure 20A). The offset was lower for the original DNAmGrimAge (MAE=4.14 years, Supplementary Figure 20G). However, the original AgeAccelGrim showed less significant associations with all age-related conditions (Supplementary Figure 20H–20K) except for smoking.
===
My values:
| DNAmadm |
DNAmB2M |
DNAmCystatin_C |
DNAmGDF_15 |
DNAmleptin |
DNAmlog.A1C |
DNAmlog.CRP |
DNAmPACKYRS |
DNAmpai_1 |
DNAmTIMP_1 |
| 256.2984699 |
791294.7258 |
416886.0024 |
96.58857561 |
4333.618852 |
1.731211957 |
-0.5672573947 |
-3.988701324 |
17683.9436 |
26111.63214 |
my DNAmCystatin_C is > 4 SDs below the dataset, but the dataset is also GrimAge2 so it only includes older people…
I have reasonably low PAI1, which is not too correlated with age. This is good, and also shows that even if I have an ASD, I don’t phenotypically match with ALL attributes matched in ALL papers about ASDs (understandably, b/c I know my case is peculiar). Ruling out high PAI-1 is a weight off my shoulders.
DNAmlog.A1c… average is 1.73769… Mine is 1.73121. SD is 0.032. … Ugh… it’s not that different… 0.00648. My A1C is always 4.8 but people have commented that my BG spikes are “thicker” than other people’s, and my spikes tend to be worse from eating an equivalent amount of food => this means I have to eat less fruit and more acarbose-receptive meals. I’m so jealous of people who can eat fruit without much of a glucose spike (and there are LOTS of people like that) - even if my inflammation is hella-low, I need way more time than other people and cannot afford to have high glycation.
My leptin is 1SD below average, damnit. I know, I’m hungry too much.
==
The DNAmlog(A1C) and CRP values are both natural-log-transformed, so it predicts e^(1.731211957) = 5.67 as my A1C and e^(-0.56) = 0.567 as my CRP, neither which are anywhere close to right…
DNAmlog(CRP) is among the lowest of anyone in the population (expected), but A1C is towards the middle. The noise is still super-super-high so these aren’t great predictors (it’s really only a good predictor at the high end…)
===
In recent years, the prevalence of macrovascular diseases has significantly increased in patients with T2DM.12 While HbA1c is a good predictor of microvascular disease in these patients, it has limitations in the prediction of macrovascular diseases.12 A previous study revealed that the progress of cardiovascular complications in patients with diabetes may be closely related to the fluctuation of blood glucose.13 However, understanding blood glucose fluctuation in patients often requires many cycles of CGM, and patient compliance is poor. Another previous study revealed that the GA/HbA1c ratio could reflect the fluctuation of blood glucose in patients with T1DM. The poorer the islet function, the higher the GA/HbA1c ratio and the greater the blood glucose fluctuation.14 However, there is still a lack of data supporting the application of the GA/HbA1c ratio in the blood glucose monitoring of patients with T2DM. The current study revealed that the GA/HbA1c ratio is positively correlated with the MAGE in patients with T2DM and negatively and significantly correlated with C-peptide levels. The increase of the GA/HbA1c ratio could be used as an alternative index to evaluate blood glucose fluctuation and islet β-cell function in patients with T2DM; its application value in this aspect is significantly higher than that of HbA1c and GA.
The mechanism of the GA/HbA1c ratio in reflecting blood glucose fluctuation is still unclear. Albumin is glycosylated 10 times faster than hemoglobin,15 making the sensitivity of GA to blood glucose change higher than that of HbA1c. Albumin has a shorter life span than hemoglobin, and GA can better reflect blood glucose changes within a short period. A great fluctuation of blood glucose can enhance the glycosylation and oxidation of albumin, increasing the GA level.16,17 Related studies have also confirmed that GA could better reflect patients’ blood glucose fluctuation than HbA1c.18,19 However, blood glucose fluctuation enhances oxidative stress,20 leading to a decrease in the lifespan of red cells.21 The greater the MAGE in patients, the higher the peak blood glucose may be, while hyperglycemia can reduce the fluidity of red cell membranes22 and reduce the lifespan of red cells, decreasing HbA1c. Therefore, when the blood glucose fluctuation increases, the GA level increases, the HbA1c decreases, and the GA/HbA1c ratio increases. However, these possible mechanisms need to be confirmed by further research.