Basically the title says it all, rather than use U-and J-shaped mortality curves I was going to see how my biochemistry compares to an20 year old.
Does anyone know where I can find such a table of reference values ?
Thanks
Basically the title says it all, rather than use U-and J-shaped mortality curves I was going to see how my biochemistry compares to an20 year old.
Does anyone know where I can find such a table of reference values ?
Thanks
Thank you ![]() so much for that, it’s just what I wanted
so much for that, it’s just what I wanted
I get an error when I go to that page, but this works and people can start from here:
https://biomarkeroptimizers.com
Wow - this is a great effort - well done Sergey and Michael.
https://biomarkeroptimizers.com/about
I encourage others to join in this effort… and enter their data.
Just take into account that some super important things in a healthy 20 year old might not be optimal for a best possible 20 year olds longevity phenotype (nor for what and older person’s phenotype would be).
As an extreme example a eunuchat age 20 would have lower testosterone and free testosterone, lower grip strength (and probably lower IGF-1 and GH, higher mTOR and SHBG) than an average 20 year old male. The average 20 year old is “more fit” at that point in time than the eunuch. But statistically the eunuch will probably be more fit in his 70 and 80 and will definitely statically live longer.
So the “compare to the 20 year old exercise might be valuable in many ways”, including to in some sense compare your “fitness”. At the same time, it could lead you to seek to optimize certain biomarkers in the wrong direction if your goal is longevity.
Similarly Apo B and glucose in an average 20 year old (in the US or other western society) are probably not at levels that are optimal for a 20 year old seeking an optimal longevity phenotype and def not for an older person where diabetes and cardiovascular risks are going up each decade.
(Same for fat mass on a Dexa scam, and so on and so forth)
What I have a problem with is all the U- and J-shaped mortality curves, which makes me a bit suspicious. When I’m taking about using the biochemical parameters of a 20 year old, what I had in mind was the scenario shown below of a mortality curve (please exclude the crude drawing)
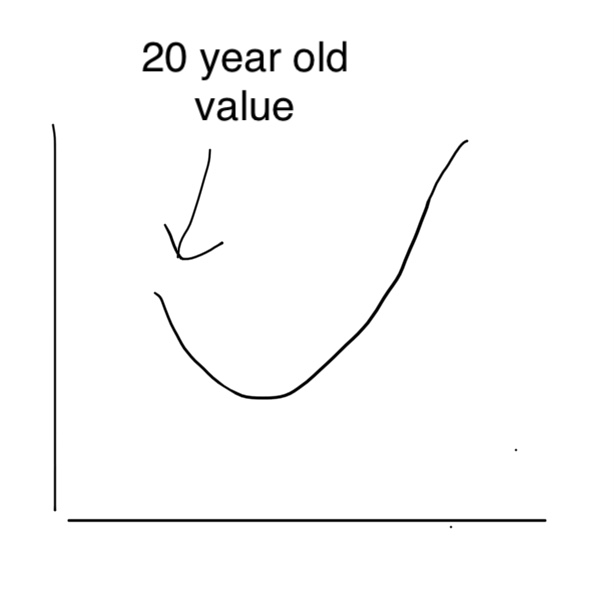
In this case, I would probably use the 20 year old value.
I’m not advocating we should ditch mortality curves only that we shouldn’t just take them as gospel.
It’s just a personal opinion.
Does this help you at all?
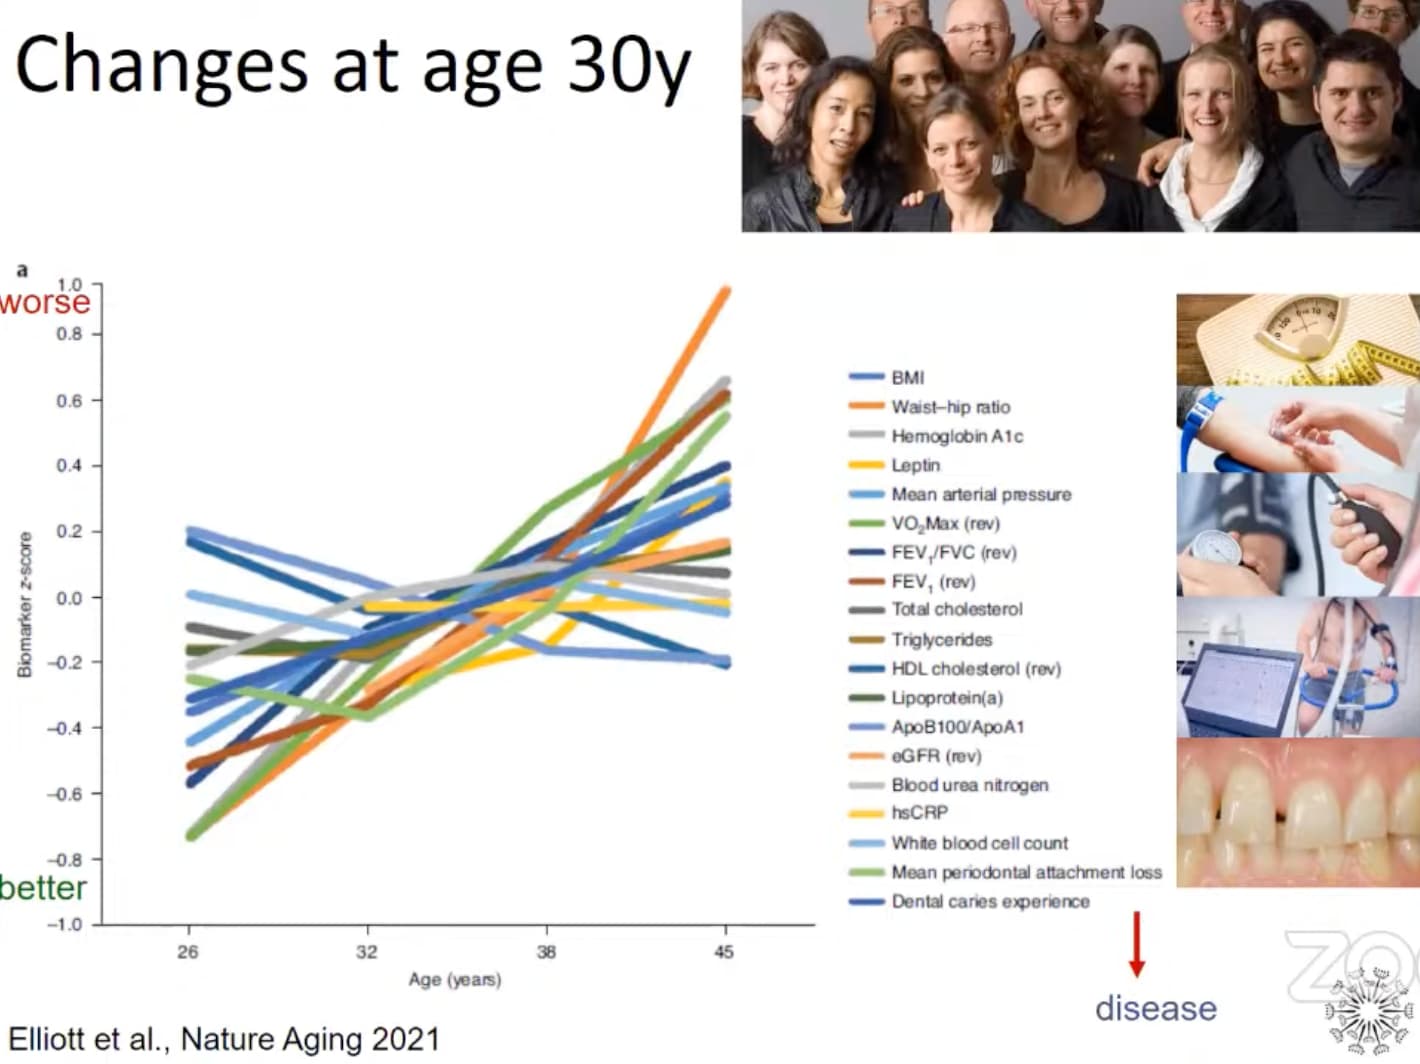
Source: Disparities in the pace of biological aging among midlife adults of the same chronological age (Nature Aging, 2021) , Full Paper PDF , Video Discussion
Ooh, that’s a very interesting graph
Yes, I one hundreds percent agree that those can be confounded in many ways and hence difficult to know “what point” on a curve to select.
I’m was trying to add on one additional consideration on top of that. One that I truly think extremely important - and that is fundamentally different that picking “where on the curve do we want to be”.
In some cases we may not actually want to pick the target we want to reach optimize from on a demographic curve. But rather look at all other data also to target what may be optimal even if that does not overlap with any age’s value.
Do you see what I mean?
Yeah I see where your coming from and totally agree with you
Make sure you are following Michael Lustgarten’s work (@ConquerAging). He is tackling this problem for himself on video for us all to follow along. And he doesn’t use supplements (much) to tweak his physiology toward optimal blood and bioage markers. It’s very impressive and educational work, even if it is n=1.
Here’s his latest