However, particularly in the age of artificial intelligence, such analyses are arguably too accessible. Web-based tools have been created that simplify the task of the analyst to simply choosing the exposure and outcome—the automated analysis is performed at the touch of a button [23]. Mendelian randomization has become an easy target for researchers who are incentivized to publish as often as they can, as well as to predatory journals which are willing to publish such articles. While the two-sample summary data approach has led to many insightful papers, it has also fuelled an explosion of poor-quality Mendelian randomization publications, which threatens to overwhelm the capacity of qualified reviewers and undermine the credibility of the whole approach.
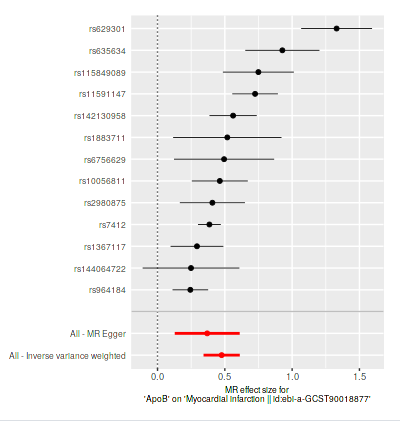
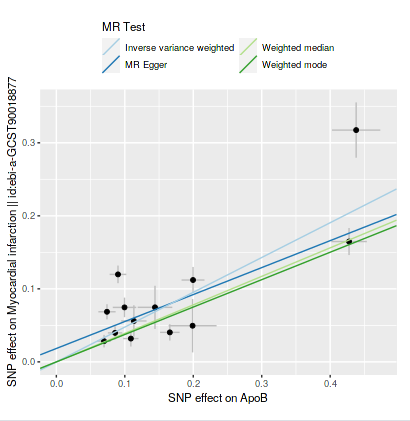
First I did one analysis (if I understood it correctly; at this moment I am like a cat walking on a keyboard or a dog at the wheel) of apoB and cardiovascular disease; 1 SD increase was only 6% increase in risk. Then I changed to metabolite QLT’s for apoB and myocardial infarction, now it was 61% (exp(0.4765)) increase in risk per SD, which seems more correct. Metabolite QLT’s according to perplexity is more related to the exposure at hand (I searched for one SNP it was related to PCSK9).
If it’s this easy to do MR I wonder if all of the big pharma companies know already all of the targets to prevent disease, or is ready for when new papers/data is published.
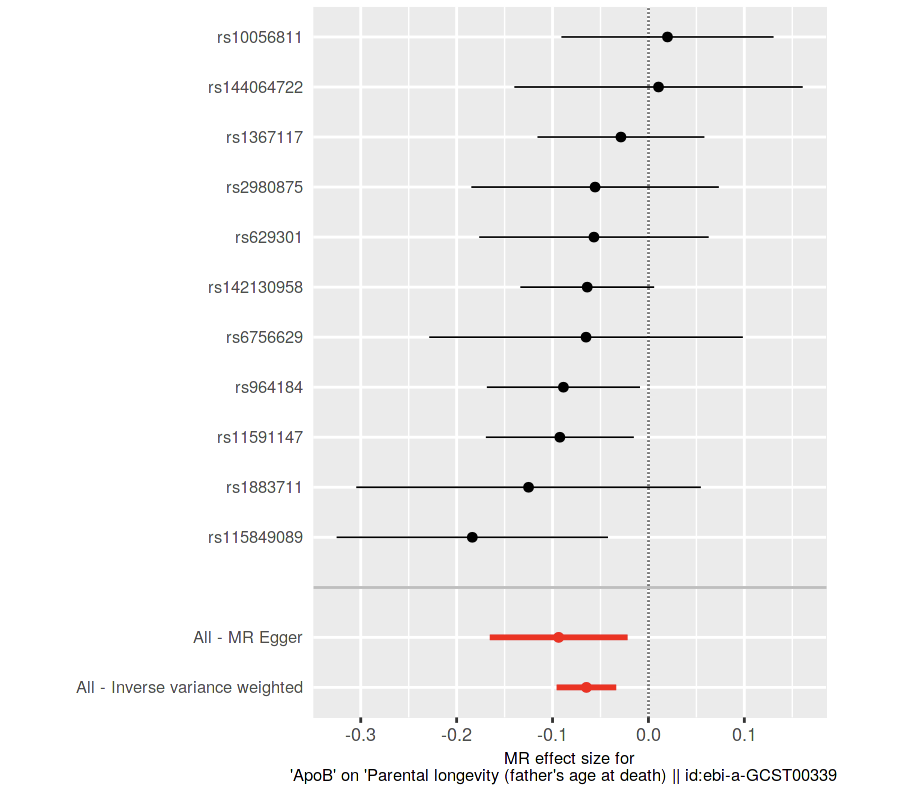
If it’s to the left that means lower risk (per 1 SD increase with IVW method according to perplexity), in this case lower risk (chance) for higher age. I think we have to verify the methods results using the other functions of the site, etc, before being sure.
It’s fun to speculate until some MR or statistical genetics expert come and say we’ve done it all wrong or someone learns how to analyze or do them properly.
Regarding the pharma companies. It seems easy to just analyze everything with each other and look at the top hits (i.e statistically significant + clinically significant (top %) + checking for some bias or false positives). I mean we or someone should be able to do this if not today in a few years maybe with better methods.
Then we have all the causal associations for all biomarkers and everything else.
So that information will probably be available…?
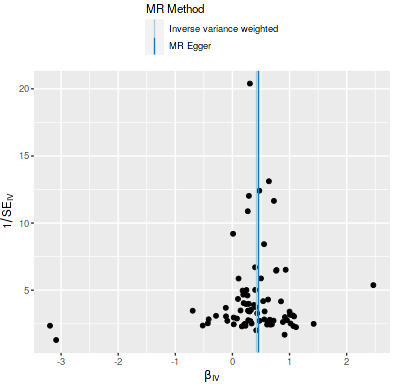
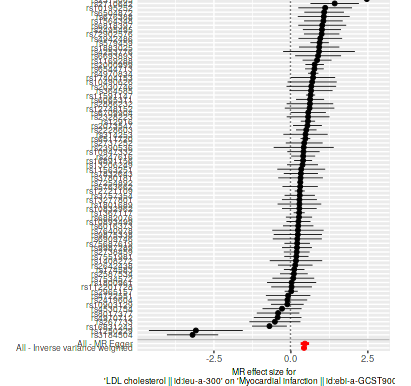
I took SNP’s for LDL cholesterol that was reported SD (mg/dl) in the row and tested it with myocardial infarction, about the same result as for apoB earlier, it used a lot more SNP’s:
https://evebio.org/ is doing something somewhat similar: mapping all existing drugs with all proteins or genes. They’ll release their findings in open data soon. So if you find that the expression of gene X is linked to longer lifespan you could find all existing drugs that tap into that pathway (to enhance or inhibit it).
Plug the MR app + EveBio’s data + all RCT data + all academic papers into one AI agent and you might find some cool low hanging fruits…
removing genetic effects from protein expression to aid biomarker discovery by removing noise due to random genetic variation. This strategy, sometimes referred to as “de-Mendelization”10, has not yet been applied at scale, but a notable example is prostate-specific antigen (PSA), where adjusting for genetic determinants of constitutive, non-cancer-related PSA variation improves screening utility11.
In this work, we first describe the conditions under which removing genetic effects from proteins can improve the discovery of disease associations. We then demonstrate that, in practice, this strategy consistently increases power to detect protein–disease