Sadly only one of the labs I use by default does ApoB. I am looking forward to the next result there as it may indicate whether high dose (equiv 50mg) Rapamycin drives up ApoB without increasing LDL-C by that much. However, this is an interesting paper.
4 Likes
Personally, I have found that the amount ApoB and LDL goes up does not increase with the dose of Rapamycin.
Very interesting paper, I wonder if anyone has access to it and can post it in this thread.
Among other things, the abstract says:
1- nontrivial variability of ApoB values in correspondence of 100 LDL ( 66 to 99 mg/dL) but that is the 2SD range (95% of distribution) which may be restricted to 1SD which would include a perhaps acceptable, as a rough estimate, 68% of the population (in the hypothesis of a normal distribution).
2- the article confirms Tom Dayspring’s words that the non-HDL is a better proxy for ApoB, since there is a lesser variability in ApoB for given values of non-HDL-C
2 Likes
The blood test I am doing on Tuesday will indicate if ApoB has come down. It could be something else, but I don’t think it is as yet.
I have a DeepDyve account (paid) which allows me to email a copy to someone, but not for it to be generally published.
If you send your email address to me in the DMs I will try to get this to work.
Thanks, I’ve sent you my address, I’d like to see if we can apply into practice the studied distributions and correlations.
Thanks for the link, the studied sample comes from the NHANES study, a first issue is that LDL-C has not been directly measured by centrifuge but calculated indirectly. This has probably widened the variability levels, according to the accuracy of the model (Martin-Hopkins equation).

I’m going to report a few details, probably editing in succession my post.
One good news is that, although the 95% variability is pretty high, the variability range from the second to the third quartile (25% to 75%) is reasonably small and this includes 50% of the population
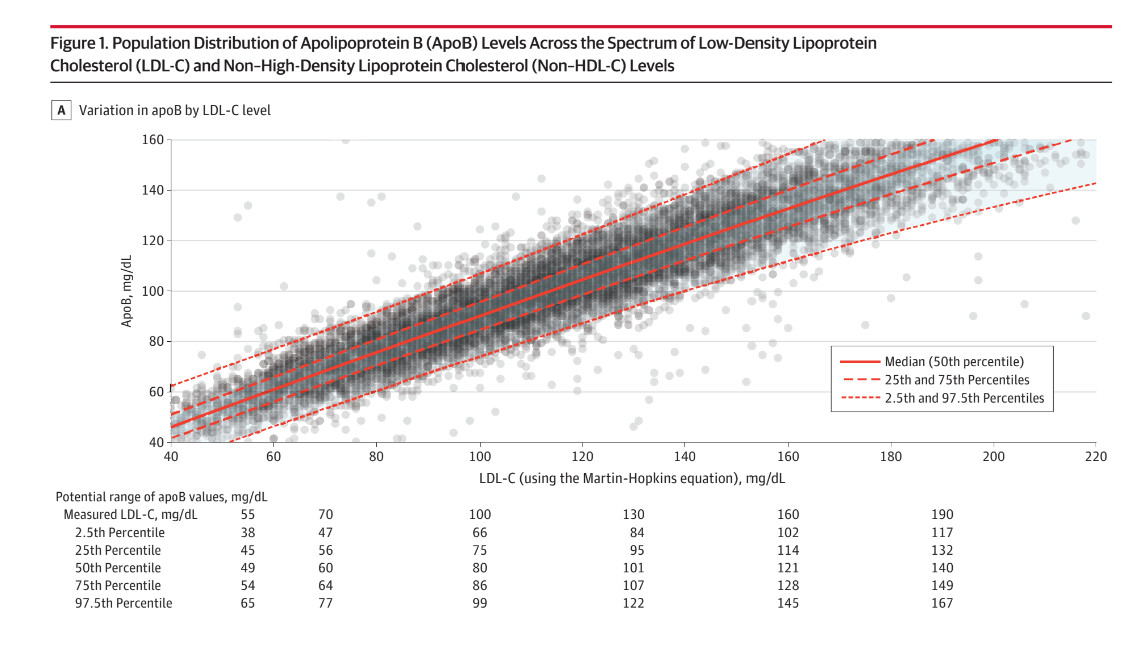
I don’t know if the values drawn in the table below the plot are accurate, it would seem not too much, the idea anyways is that in people who had a calculated LDL-c value of 100 mg/dL, most probably the ApoB value would range from about 70 to about 105 (according to the plot) and in half the population from about 75 to 86 (according to the table). BUT, if we have some peculiar makeup, we may end up within the outliers, that might have ApoB ranging, for the same value of LDL-C, from about 50 to about 125 mg/dL.
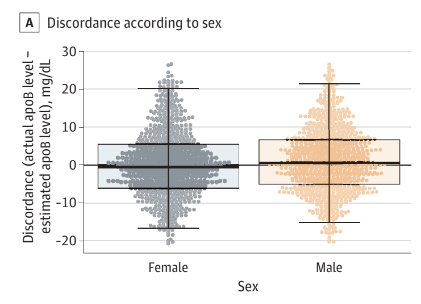
From the successive table we see that there is not much discordance within genders and that much of the discordance includes a plus or minus 10 mg/dL difference in ApoB
And this is maybe the most useful feature of this article, a graph by which we can estimate with various levels of tolerance our ApoB values from the non-HDL-C values. The variability is smaller than with LDL-C, I think a reason may be that the LDL-C is calculated so the measurement and the model errors sum up. there are sure other reasons I don’t know about, Tom Dayspring will know.
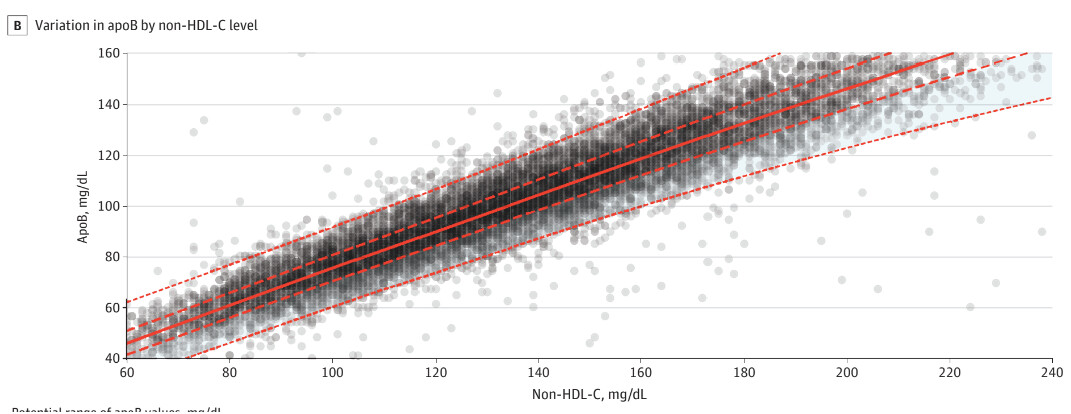
I didn’t paste the numbers in the table because for some reason they do not reflect the values depicted in the graph.
Practical application: my recent lipid panel gave me a non-HDL value of 122 mg/dL. According to the NHANES data, there is 95% probability that my ApoB values range from about 105 to about 105 mg/dL. However, there is 50% probability that ApoB values range from about 83 to about 95 mg/dL.
The median Apob value, taken as representative of the distribution would be about 90 mg/dL.
The above data may not be very accurate since the blood was drawn by a pharmacy device, of standard medical quality. Anyway, as an estimate, there is about 80% probability that my ApoB is above the suggested 80 mg/dL threshold, although non-HDL-C is below the suggested threshold of 130 mg/dL.
My final decision is that I’m going to start a personalized strategy based on mini doses of pharmaceutical drugs (statins + ezetimibe). It’s not a high-risk situation, but prevention is prevention as we all know.
2 Likes
Its an interesting thought that you can estimate ApoB from Non-HDL C. However, I need to check this pattern out with a single lab and I really need this weeks figures to see where things are going. Looking at my last two results (one of which didn’t have ApoB) I am not sure it is acceptable other than as measuring ApoB, but I need to see what happens.
One thing I find particularly helpful about frequent testing is that often for no obvious reason a biomarker jumps and then comes back into line.
Some of these are test artefacts, but others look more like real results.
I think there are serious issues with relying on a single set of results for any material decision.
1 Like
Absolutely so, a single set of results is a snapshot of the measured quantities at a determined time Ti, the time of blood extraction. Unless we examine the quantities which represent the AUC of some specific phenomenon, like HbA1C for blood glucose; the usual lipid panel has not such quantities, AFAIK.
This is why I’m relying on more frequent measurements made in my local pharmacy by a finger prick. The values are probably less reliable than the classic sample of venous blood and standard lab analysis, but I can estimate to some extent the time series of a determined quantity, like any form of cholesterol. I can only think about one man, Bryan Johnson, who has his venous blood sampled from the arm pretty frequently.
If I had at least 2 or better 3 panels with both ApoB and non-HDL-C, I would try and see if the percentile of discordance on the curve provided by the article is similar, if so I would be confident about the discordance and use it for later results without ApoB. Of course, this sort of calibration should be repeated at regular intervals, like one or two years. The discordance might be checked even with a single panel, although the application of a single measurement result would be less reliable.