https://www.nature.com/articles/s41586-024-08026-3
Abstract
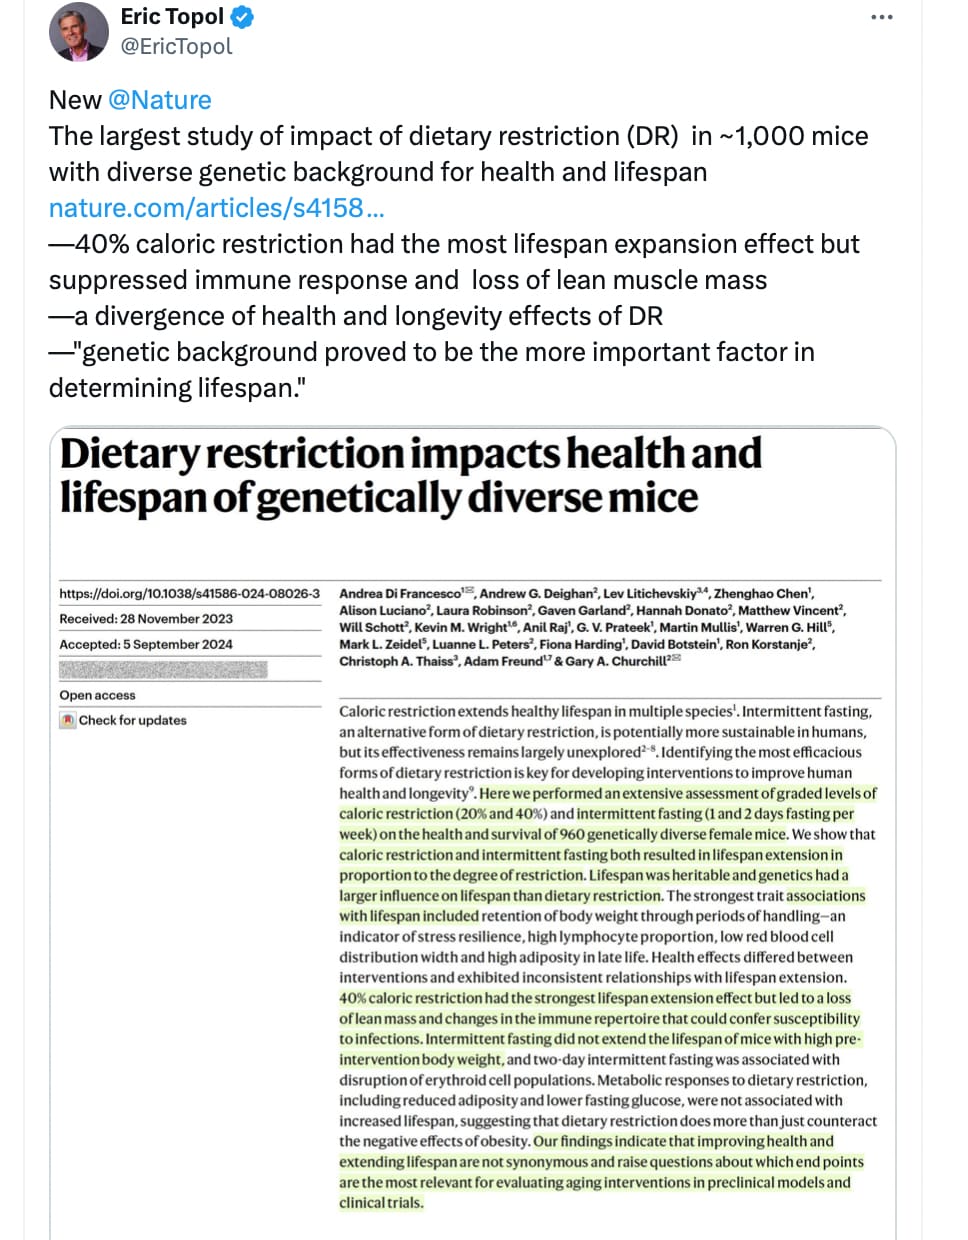
Caloric restriction extends healthy lifespan in multiple species1. Intermittent fasting, an alternative form of dietary restriction, is potentially more sustainable in humans, but its effectiveness remains largely unexplored2,3,4,5,6,7,8. Identifying the most efficacious forms of dietary restriction is key for developing interventions to improve human health and longevity9. Here we performed an extensive assessment of graded levels of caloric restriction (20% and 40%) and intermittent fasting (1 and 2 days fasting per week) on the health and survival of 960 genetically diverse female mice. We show that caloric restriction and intermittent fasting both resulted in lifespan extension in proportion to the degree of restriction. Lifespan was heritable and genetics had a larger influence on lifespan than dietary restriction. The strongest trait associations with lifespan included retention of body weight through periods of handling—an indicator of stress resilience, high lymphocyte proportion, low red blood cell distribution width and high adiposity in late life. Health effects differed between interventions and exhibited inconsistent relationships with lifespan extension. 40% caloric restriction had the strongest lifespan extension effect but led to a loss of lean mass and changes in the immune repertoire that could confer susceptibility to infections. Intermittent fasting did not extend the lifespan of mice with high pre-intervention body weight, and two-day intermittent fasting was associated with disruption of erythroid cell populations. Metabolic responses to dietary restriction, including reduced adiposity and lower fasting glucose, were not associated with increased lifespan, suggesting that dietary restriction does more than just counteract the negative effects of obesity. Our findings indicate that improving health and extending lifespan are not synonymous and raise questions about which end points are the most relevant for evaluating aging interventions in preclinical models and clinical trials.
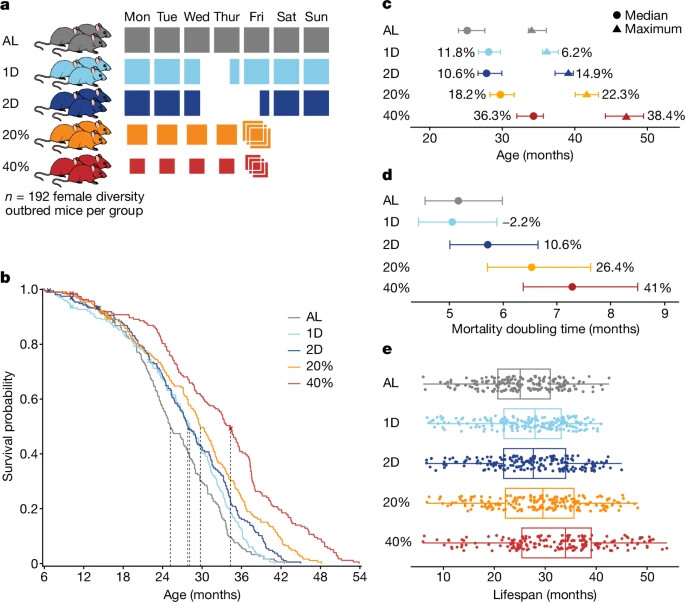
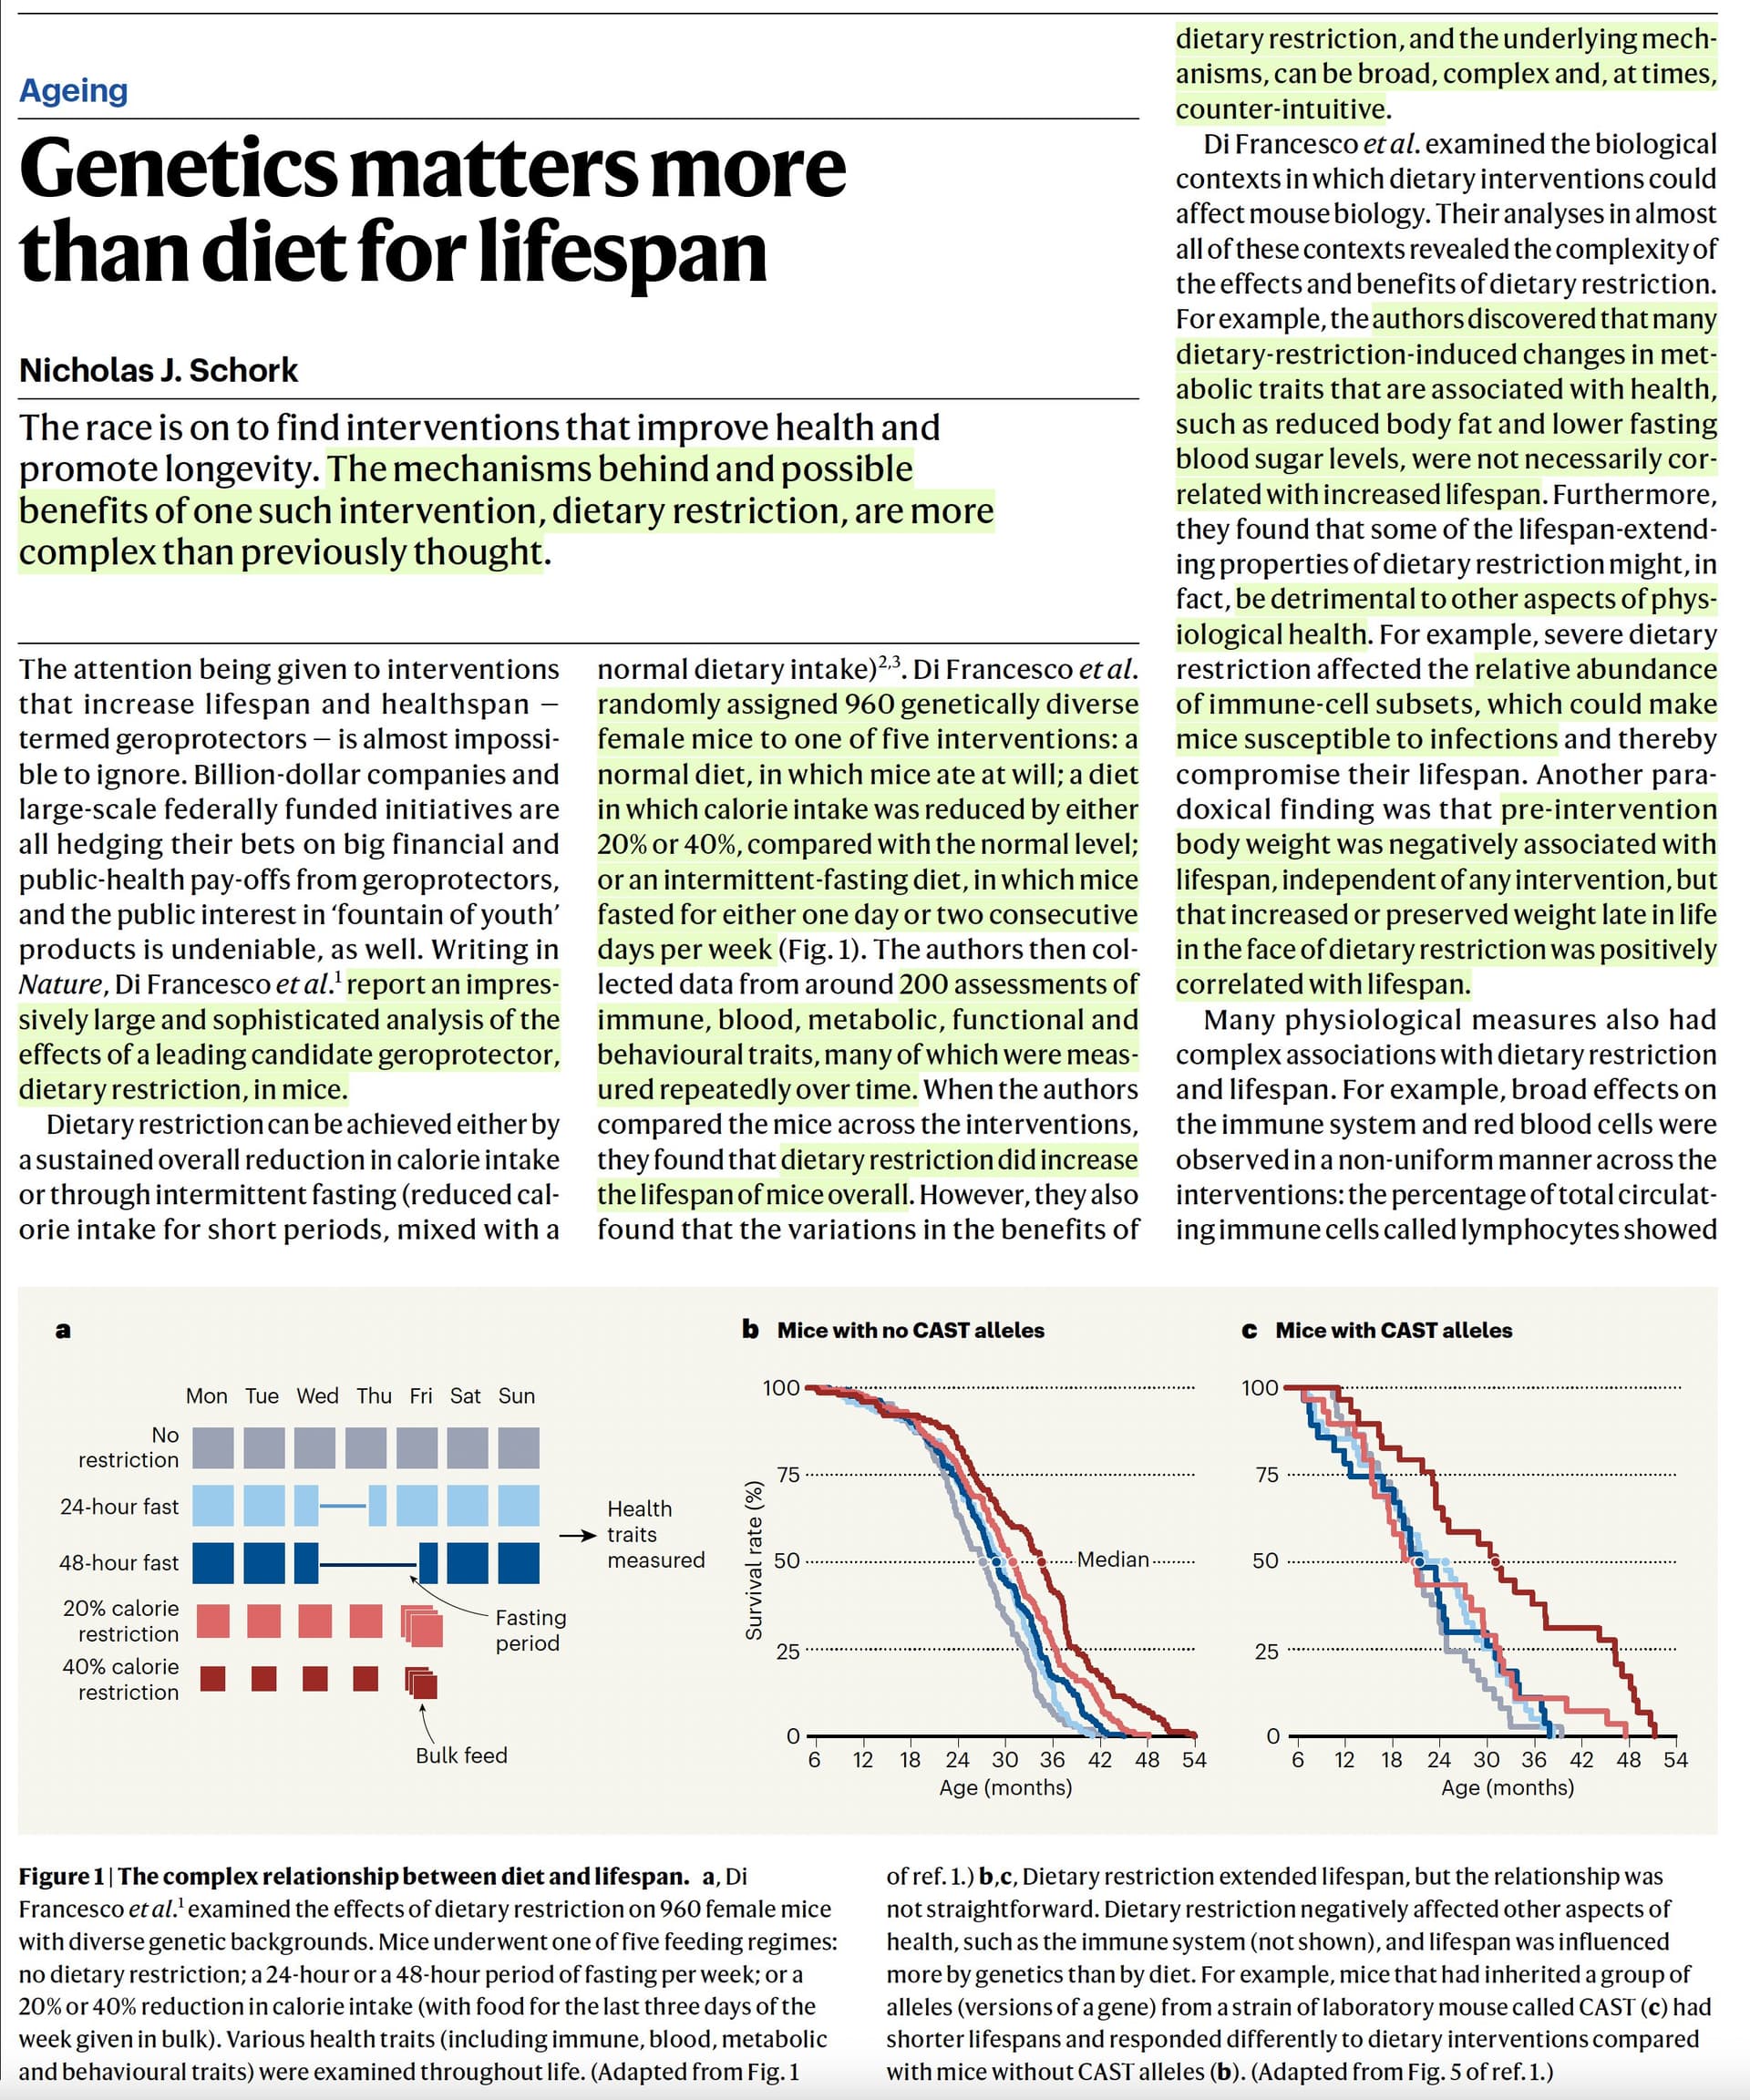
a , The study design: 960 female DO mice were randomized to one of five diet intervention groups: ad libitum (AL); one day (1D) or two consecutive days (2D) per week fasting; or CR at 20% (20%) or 40% (40%) of estimated adult food intake. b , Kaplan–Meier survival curves by diet group. The dashed lines indicate the median lifespan. Censoring events are indicated by an ‘X’. c , Kaplan–Meier estimates of median (50% mortality) and maximum (90% mortality) lifespan by diet group, showing the percentage change relative to AL and the 95% confidence intervals (computed using R/survfit). n = 937 mice. d , Mortality doubling times estimated from a Gompertz log-linear hazard model, showing the percentage change relative to AL and the 95% confidence intervals (computed using R/flexsurvreg). n = 937 mice. e , Individual mouse lifespans (points) within diet groups. n = 188 (AL), n = 188 (1D), n = 190 (2D), n = 189 (20%) and n = 182 (40%). The box plots show the median lifespan (centre line), quartiles (box limits) and range (whiskers).
Who wants to start deep-diving this? Not me ![]()