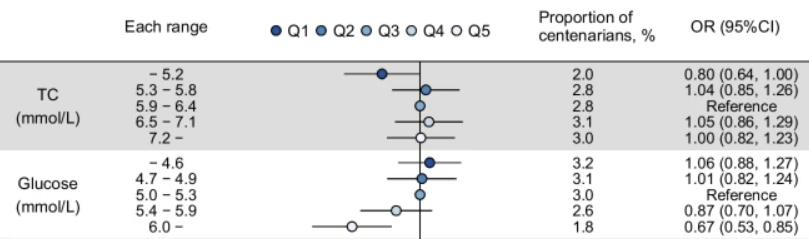
Just published. The study is an interesting read. Some surprises for sure. Especially the low cholesterol camp would need to rethink the lower the better strategy and CR seems to have no difference. Dysregulated blood sugar seems to be the worst enemy of longevity.
The 100-Year Blood Test: What Future Centenarians Already Look Like at 65
Swedish researchers tracked more than 44,000 older adults for up to 35 years and found that the roughly 1 in 37 who reached their 100th birthday already carried a distinctive blood signature decades earlier. From age 65 onward, future centenarians tended to have lower glucose, uric acid, creatinine, and liver enzymes, plus higher cholesterol and iron, than peers who died younger. The differences were consistent but modest in size, and because this is an observational study it cannot prove any of these markers cause long life. The signal is real, the levers are uncertain.
Reaching 100 has long been chalked up partly to luck and partly to good genes. A large new study from the Karolinska Institutet in Sweden adds a third piece to the picture: your routine blood work, taken decades before you get there, already hints at whether you are on the centenarian track.
The team mined the AMORIS cohort, a database of over 800,000 people who had blood drawn in Stockholm between 1985 and 1996, and followed 44,636 older adults through Swedish death and health registers until 2020. Of these, 1,224 people, about 2.7 percent, lived to 100. The researchers then rewound the tape to compare the blood chemistry of these eventual centenarians against their shorter-lived peers at the same ages, some measurements taken more than a decade before death.
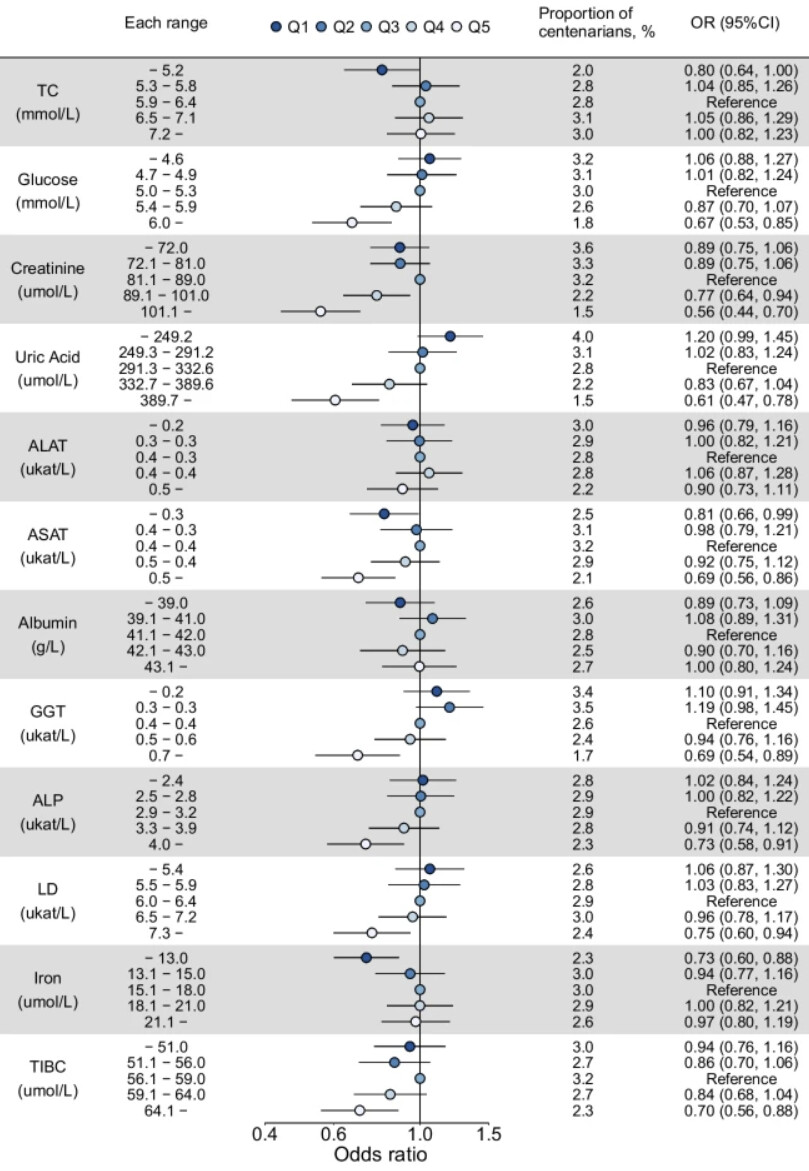
The big idea is that exceptional longevity does not switch on at 99. It is visible in the body’s metabolic and organ-function chemistry as early as age 65. Future centenarians tended to run lower glucose, uric acid, and creatinine, lower liver enzymes such as GGT, ALP, ASAT, and LD, and lower total iron-binding capacity. They also tended to have higher total cholesterol and higher iron. Ten of the twelve markers studied predicted the odds of reaching 100. Only two, alanine aminotransferase and albumin, showed no association.
None of these values were exotic. Almost all sat inside or near standard clinical reference ranges. The centenarians were not metabolic outliers so much as people clustered toward the healthier end of normal, and they were strikingly uniform as a group. When the researchers looked for hidden subtypes, they found only two, distinguished mainly by nutrition-related markers, and even those differences were small.
The cautions are as important as the findings. This is a correlation study. It cannot tell you whether nudging your uric acid down would buy you extra years, or whether these numbers simply reflect underlying genetics and lifestyle already baked in. The effect sizes are small, the population is Swedish and overwhelmingly female among the centenarians, and lifestyle data such as smoking, alcohol, and exercise were missing. What it does establish, on the largest sample yet assembled for this question, is that the biological divergence toward extreme old age begins earlier and looks more orderly than many assumed. [Confidence: High for the association, Low for causation]
Actionable Insights
The practical message is modest but real: the blood markers linked to reaching 100 are the same ones your doctor already measures, and future centenarians sat toward the healthier end of the normal range rather than in any special zone. Lower fasting glucose, lower uric acid, lower creatinine, and lower liver enzymes (GGT, ALP, ASAT, LD) all tracked with better odds. These are broadly influenced by diet quality, alcohol intake, body weight, hydration, and physical activity, which gives you plausible, low-risk levers.
To picture the magnitude, think of the base rate: about 2.7 percent of this group reached 100. Among people in the lowest uric acid fifth, 4.0 percent became centenarians, versus 1.5 percent in the highest fifth. That is roughly a doubling of the odds, but only a 2.5 percentage point shift in absolute chance. In statistical terms the effect is small (a Cohen’s d of roughly 0.2 to 0.35 for the strongest markers). So these are meaningful population-level signals, not personal guarantees.
One counterintuitive point: higher total cholesterol was associated with better odds in this very old group, which runs against midlife guidance. Do not reverse your cardiologist’s advice based on this. [Confidence: Medium]
Context and Source
Full title of the paper: “Blood biomarker profiles and exceptional longevity: comparison of centenarians and non-centenarians in a 35-year follow-up of the Swedish AMORIS cohort.”
Access status: Open access. The article is published under a Creative Commons Attribution 4.0 International License, with open access funding provided by Karolinska Institute. It is freely readable, not paywalled.
Institution: Karolinska Institutet, Institute of Environmental Medicine (Unit of Epidemiology), Stockholm, with collaboration from the Max Planck Institute for Demographic Research in Rostock, Germany.
Country: Sweden (data source and lead institution).
Journal: GeroScience, the official journal of the American Aging Association (AGE). Published 2024, volume 46, pages 1693 to 1702.
Impact evaluation: The impact score of this journal is approximately 5.3 (2024 Journal Impact Factor, reported between 4.9 and 6.0 across Clarivate and Scopus-derived sources), evaluated against a typical high-end range of 0 to 60+ for top general science, therefore this is a Medium impact journal.