Biological age captures physiological deterioration better than chronological age and is amenable to interventions. Blood-based biomarkers have been identified as suitable candidates for biological age estimation. This study aims to improve biological age estimation using machine learning models and a feature-set of 60 circulating biomarkers available from the UK Biobank (n = 306,116).
We implement an Elastic-Net derived Cox model with 25 selected biomarkers to predict mortality risk (C-Index = 0.778; 95% CI [0.767–0.788]), which outperforms the well-known blood-biomarker based PhenoAge model (C-Index = 0.750; 95% CI [0.739–0.761]), providing a C-Index lift of 0.028 representing an 11% relative increase in predictive value.
Importantly, we then show that using common clinical assay panels, with few biomarkers, alongside imputation and the model derived on the full set of biomarkers, does not substantially degrade predictive accuracy from the theoretical maximum achievable for the available biomarkers. Biological age is estimated as the equivalent age within the same-sex population which corresponds to an individual’s mortality risk. Values ranged between 20-years younger and 20-years older than individuals’ chronological age, exposing the magnitude of ageing signals contained in blood markers. Thus, we demonstrate a practical and cost-efficient method of estimating an improved measure of Biological Age, available to the general population.
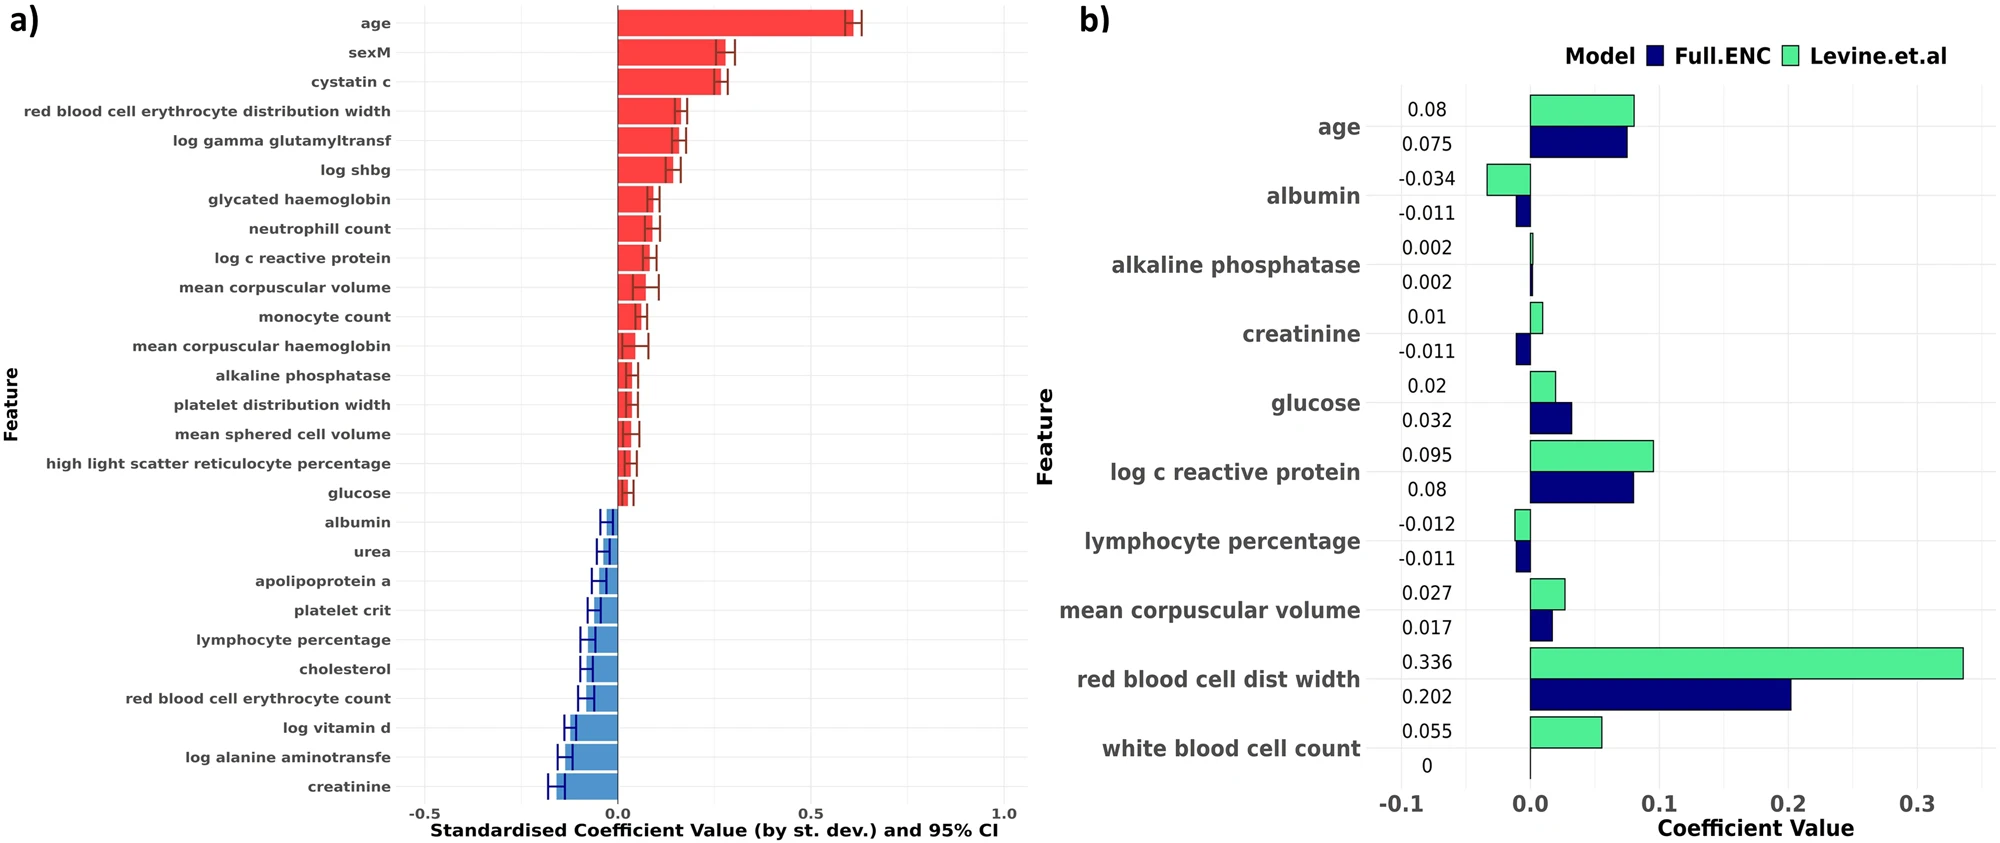
Fig. 3: Our results confirm relationships suggested by Levine et al.’s PhenoAge model, and additionally suggest that cystatin C is the biomarker of primary importance in biological age estimation.
a Bar chart showing standardised Cox model coefficients and 95% confidence intervals (log hazard scale) of the Full ENC model developed using stably selected variables, ranked in descending order. Coefficients are standardised (i.e. rescaled) by multiplying by the standard deviation of the variable concerned. Red indicates that higher levels increase mortality hazard; blue indicates that higher levels reduce mortality hazard. Apart from age and sex, cystatin C appears to have the strongest effect size. b Comparison of coefficient values between Levine et. al’s PhenoAge coefficients (green) and our Elastic-Net derived Cox model (blue). Model coefficients are similar across both models. Our ENC model selected individual WBC components (monocytes, neutrophils and lymphocytes) rather than overall WBC count. Measurement units for biomarkers were the same across both models.
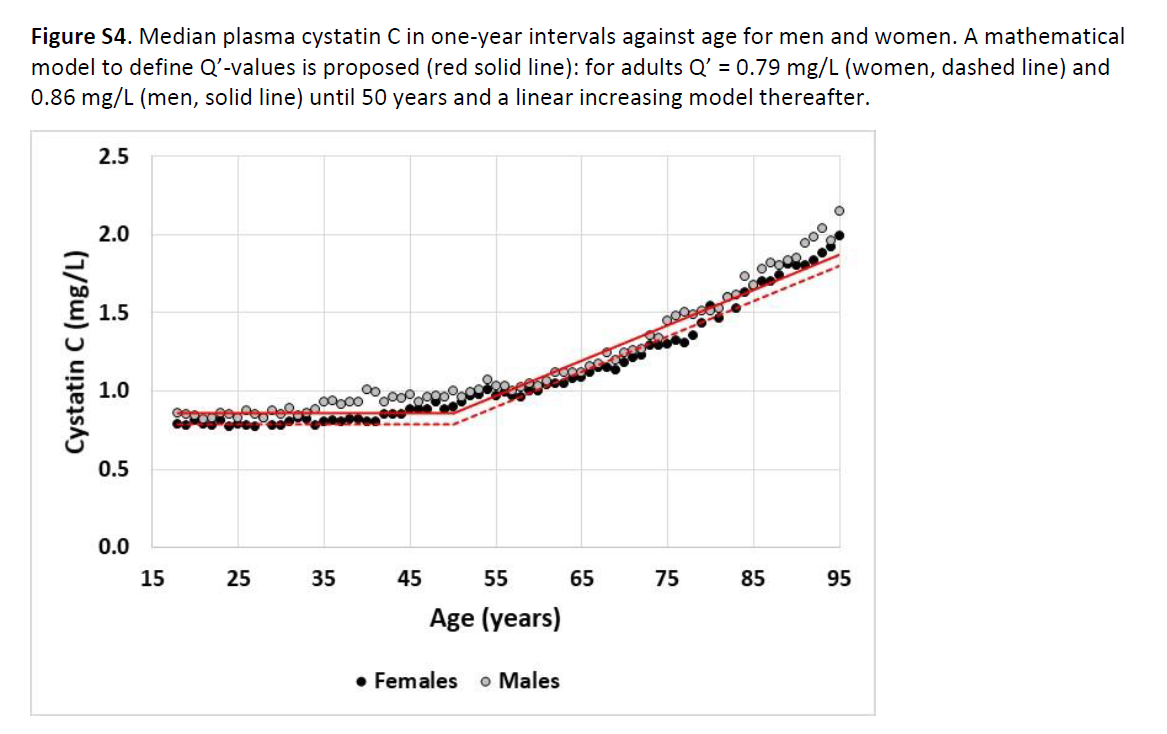
This was a particularly nice chart about Cystatin-C which basically says it floats along pretty well static until people are around 50 and then goes up in a sort of linearish manner. However, it gives a good target for healthy kidney function in the realm of 0.75 mg/l.
My son and I are working on a website which should do all of these things. What we have so far is Levine and PcAge
The idea is you put your values in once (ordinarily they are stored in local storage on your computer) and then it will calculate the biological age with a number of formulae.
We also intend to have information about the individual biomarkers.
Personally I think Cystatin-C is very important as is CRP.
if you create an account it is possible to add your own custom tests, and if you wish post it for review with articles attached so that I can add it to the public side of the website.
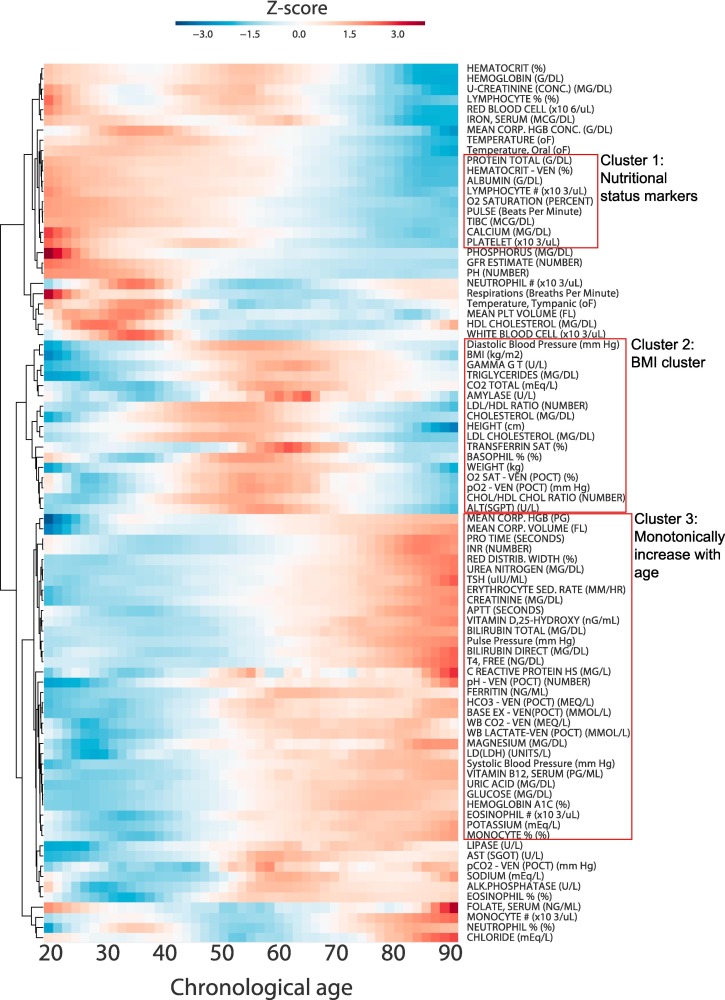
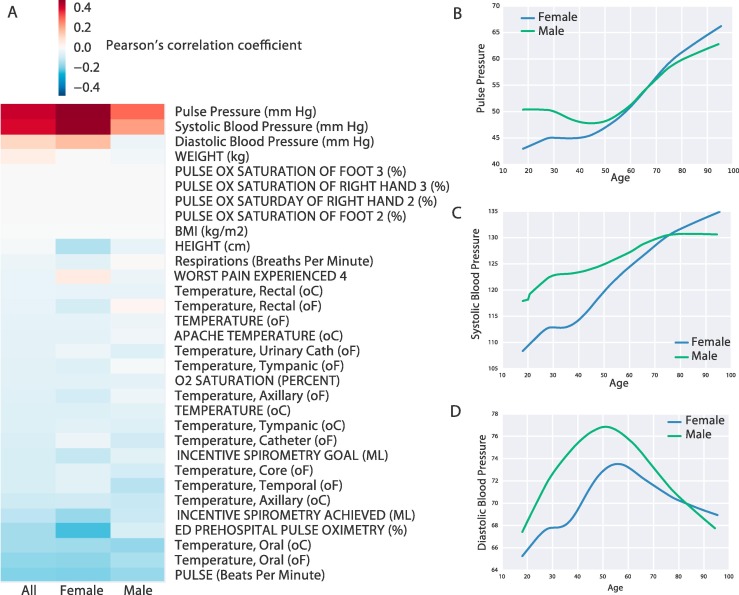
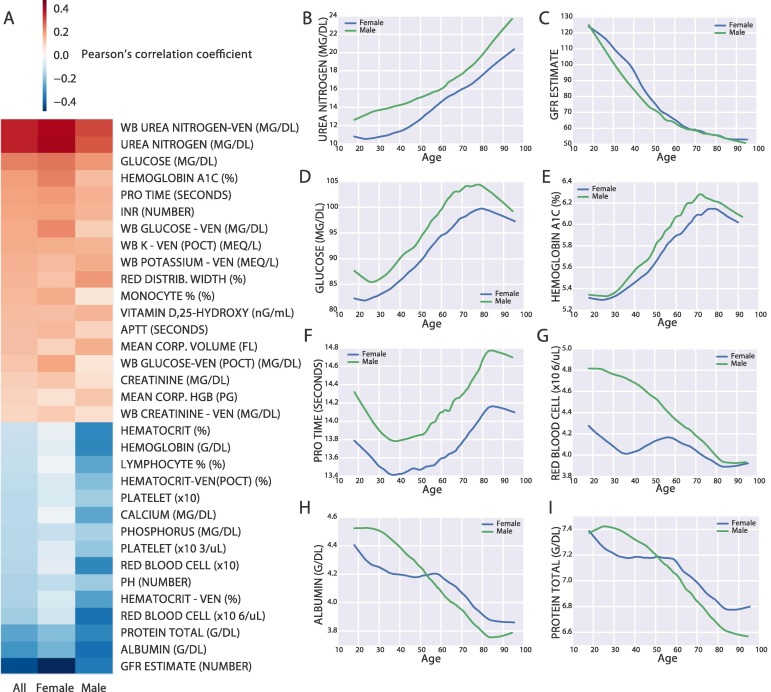
Here’s a paper I found via @ConquerAging recent video. It show “aging curves” (my term) for various Biomarkers, and provides summary descriptions of people who are biologically younger and those older.
FYI, Goodlabs (great blood test pricing) does this (Bortz) bioage calculation based on blood test results along with the Phenoage calculation. I believe you can upload blood test results from non-goodlabs tests.
Mine was very good also. I kept seeing the big negative value and decided to see what the “bortz” biological age formula was only to find that I had wanted to see it used with my data since the paper was posted here a couple years ago.