Hey all, first post, please pardon formatting errors. Also, I stole this from my post on the crsociety forums; sue me ![]()
I haven’t seen discussion of this recent paper on the forum, and it has shaped how I think about the relationship between BMI and disease risk, and I thought I’d briefly summarize it and ask for your perspective.
Ryan K. Masters (2023) Sources and severity of bias in estimates of the BMI–mortality association, Population Studies, 77:1, 35-53, DOI:10.1080/00324728.2023.2168035
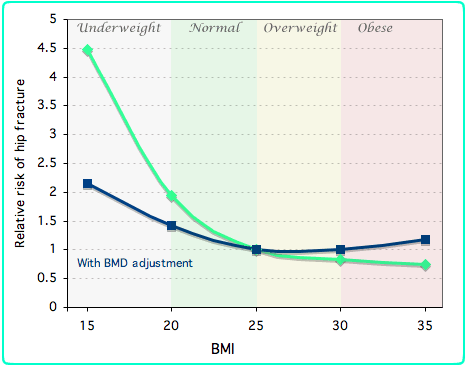
I have seen discussion here of papers that adjust BMI analyses for health-status (e.g. number of risk factors or healthy lifestyle factors, here and the lancet analysis referenced earlier in this thread, here).
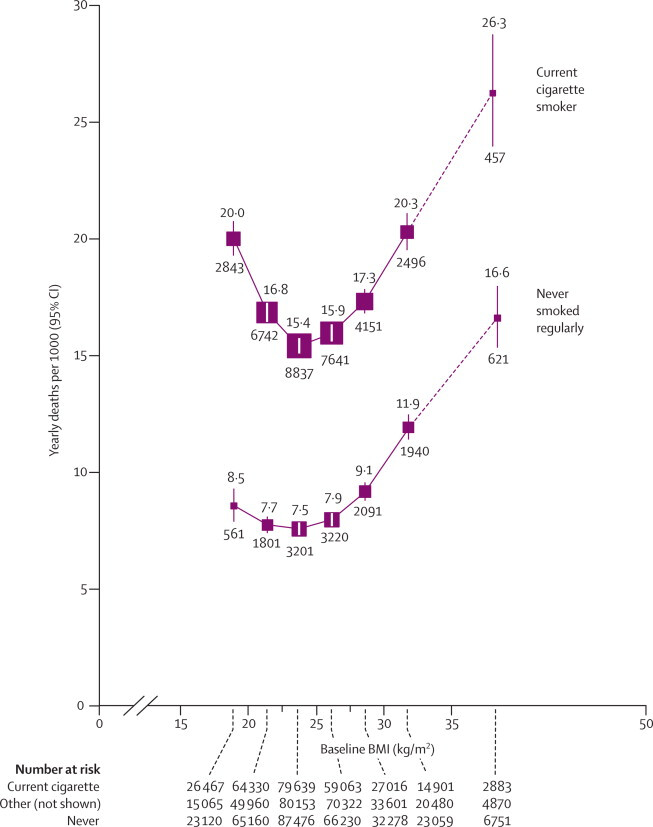
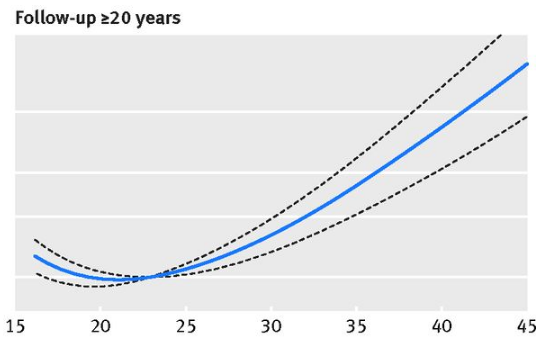
We have also seen discussions of having a longer follow-up time, to eliminate those whose weight was due to an active disease status, further reducing the J shaped relationship (here)
Colloquially, body fat % as a marker for adiposity, quantity of visceral fat approximated via body shape indices (e.g. waist-to-hip ratio, waist circumference, etc) are relevant as well (I can cite later if you’d like, I’m in a bit of a rush). Further, the time-dependence of BMI (thinking of time-integrated obesity, similar to cigarette ‘pack-years’) is shown to be relevant as well, with many of these studies giving just a single measurement.
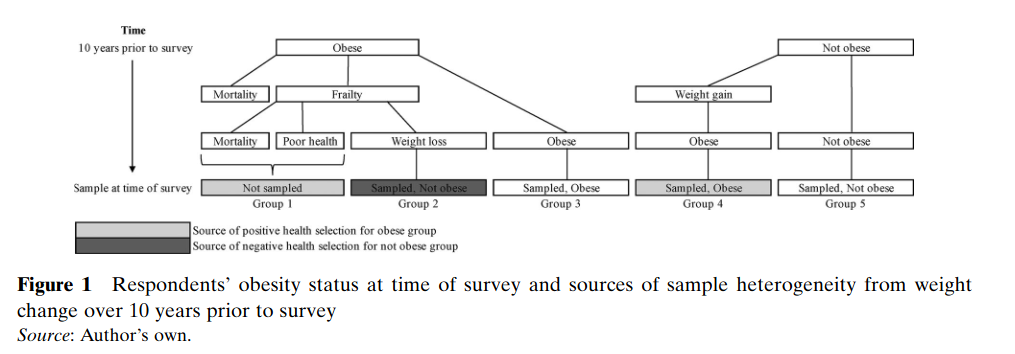
Masters claims that leaving any one of these factors out leads to substantial bias in the data. He wrote this flowchart where, assuming we have a perfect metric for someone’s level of obesity/overweight (which we do not), what measurement biases arise in typical analyses.
Based on this, he did the following (long, tl;dr below)
Aims
This study explores three sources of bias in estimates of the BMI–mortality association: (1) confounding bias from within-BMI-group variation in body shape; (2) positive survival bias among high-BMI samples due to recent weight gain; and (3) negative survival bias among low-BMI samples due to illness-related weight loss (i.e. reverse causation). First, because variation in body shape not captured in standard BMI categories likely confounds the BMI–mortality association, I document variation in body shape within BMI groups and examine the extent to which this variation is associated with poor health, biomarkers of cardiometabolic diseases, and mortality risk. Second, I examine how recent weight gain and recent weight loss affect the composition of BMI groups at time of survey. Obesity rates among the US adult population have increased since the 1980s due to rising exposure to an obesogenic environment (Wang and Beydoun 2007; Reither et al. 2009, 2015; Ljungvall and Zimmerman 2012; Masters, Reither et al. 2013). Rising prevalence likely means that large subsets of overweight and obese samples have spent relatively short durations of time at these BMI levels. Also, long durations of time spent obese can increase risk of disease (Abdullah et al. 2012; Reis et al. 2013; NASEM 2021) and may lead to illness-related weight loss, resulting in reverse causation bias whereby samples with low BMI are composed partly of respondents whose BMI levels were at one time overweight and/or obese (Lawlor et al. 2006; Preston et al. 2013; Cao 2015; Stokes and Preston 2016b). Thus, on the one hand, health profiles of samples with low BMI are likely biased downwards by a subset of respondents whose BMI is low due to recent weight loss. On the other hand, health profiles of samples with over- weight and obese BMI levels are likely biased upwards by a subset of respondents with high BMI from recent weight gain. After documenting the sources of these biases in NHANES 1988–2006, I examine the severity of these biases on estimates
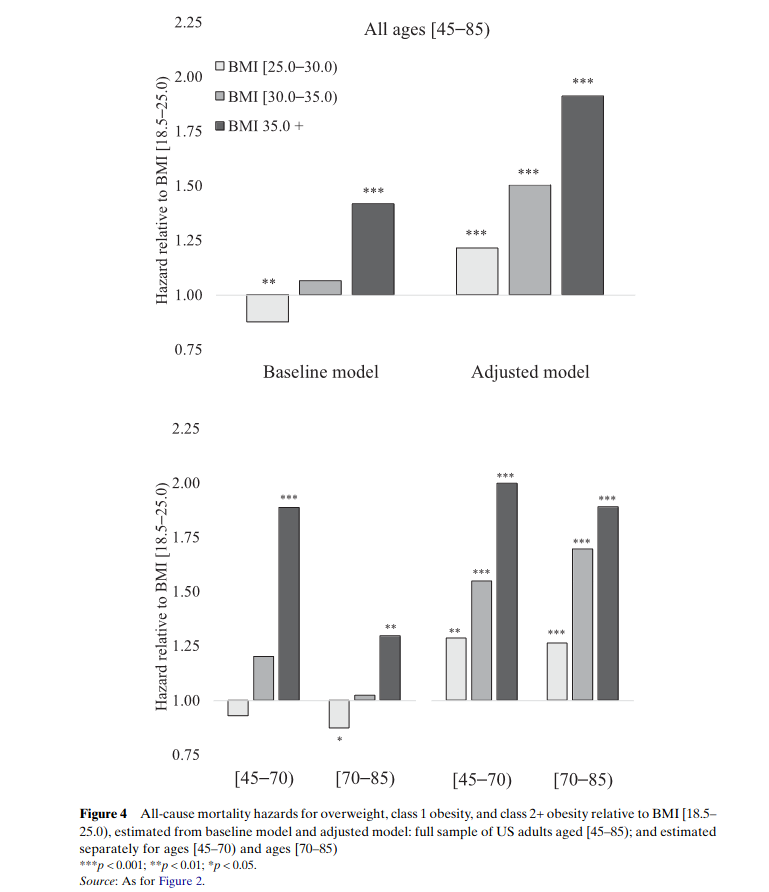
of the US BMI–mortality association. I compare estimates of BMI differences in all-cause mortality risks among US adults aged [45–85) from two different models. I fit the first model using baseline BMI measures to indicate five categorical levels of BMI (<18.5, [18.5–25.0), overweight, class 1 obesity, and class 2+ obesity), and I fit the second model using these five categorical levels of BMI while adjusting for all three sources of bias. I test for age-based differences in the BMI–mortality associations by refitting both models separately to ages [45–70) vs [70–85), and I identify the functional form of the BMI–mortality association by refitting both models using nine categories of BMI. Finally, I use estimates from both models are to calculate the percentage of US adult deaths attributable to overweight and obesity.
Masters combined all of these potential confounders, used the NHANES cohort (both the '88-'94 and '99-'06 data), and performed principal component analysis (PCA) on them. This produced a new model labeled ‘adjusted’ in the following plots. Note: he fit the model separately for the groups [45-70) and [70-85), providing some supporting evidence for discussions here about the appropriate body weight for those considered elderly. A caveat is he doesn’t show an age-specific analysis for BMI within the normal range, only between normal/overweight/obese/obese+. When he does show more fine-grained BMI metrics, it’s for the whole population.
First, headline results
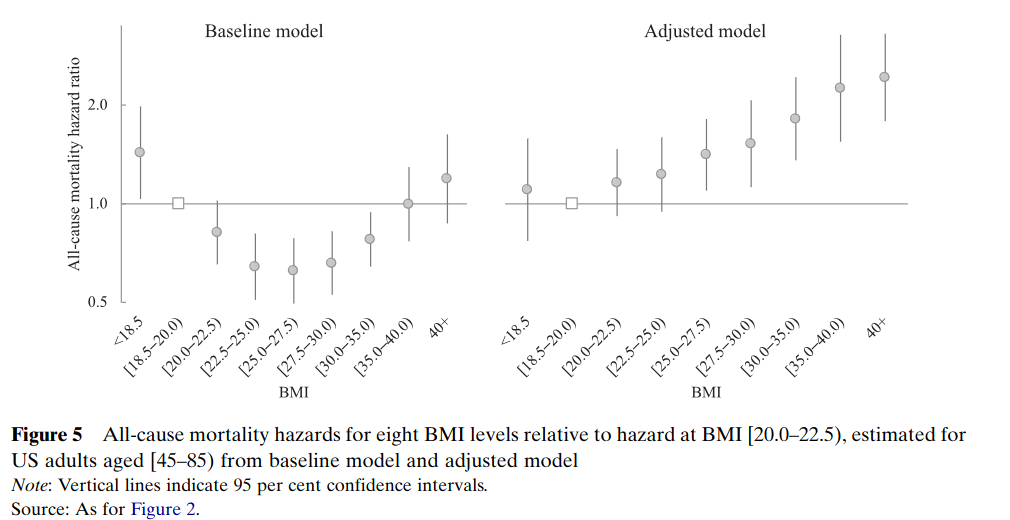
The range of 18.5-20.0 being the lowest risk is likely a relief to those here, but that depends on how you’re doing in terms of the adjusted model. What did he control for?
Quote
The Baseline model shown in this paper includes five categories measured from base- line BMI at time of survey: underweight, overweight, class 1 obesity, and class 2+ obesity, with BMI [18.5– 25.0) as the reference category. The Adjusted model includes 10-factor indicators of the PCs of body shape and includes underweight, overweight, class 1 obesity, and class 2+ obesity measured from weight 10 years prior to survey, with BMI [18.5–25.0) 10 years prior to survey as the reference category.
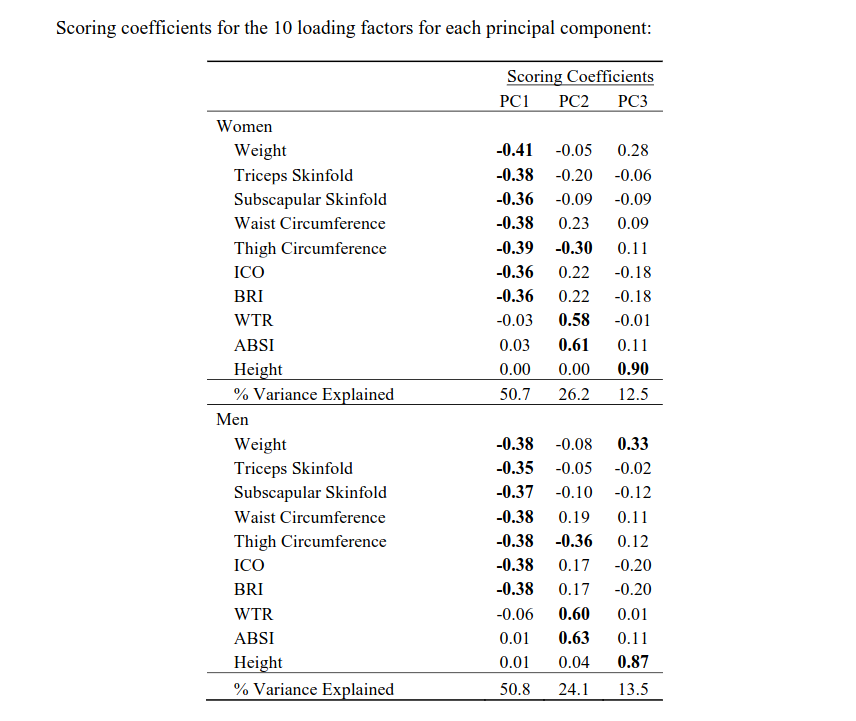
Unfortunately, when actually describing his principal components, he was a bit vague. (Edit: I just found the supplementary materials, and there’s too much there to share here but it’s a good read. Brief summary - the PCs are the same between sexes, the PCs are independent of each other, the body shape indices he used were all highly correlated with each other so only one came out in the PCs, ABSI has the lowest correlation to BMI).
Three principal components are estimated to account for about 90 per cent of variation in US adult body shape. PC1 accounts for about 51 percent of variation and is negately associated with indicators of general adiposity (e.g. −0.40 loadings for weight and skinfold measures). PC2 accounts for about 25 per cent of variation and is associated with indicators of body shape and central adiposity (e.g. 0.60 loading for ABSI and −0.30 loading for thigh circumference) (Reis et al. 2009; Maessen et al. 2014). PC3 accounts for about 13 per cent of variation and indicates stature (e.g. 0.90 loading for height).
Where, from the “marginal effects of PC1/2” below, the PC based on general adiposity is highly inversely correlated to BMI and the lower values it has the worse health status you have. PC2 which grows with ABSI (“A Body Shape Index”, (ABSI) = waist(cm) / (BMI^{2/3} × height(cm)^{1/2}) and shrinks with thigh circumference. As PC2 grows, you have worse health, and it is generally much less correlated with BMI. Therefore, this PC which is mostly explained by having a smaller ABSI and larger thigh circumference, explains the majority of in-BMI variation in health status. That is, if I’m interpreting this right!
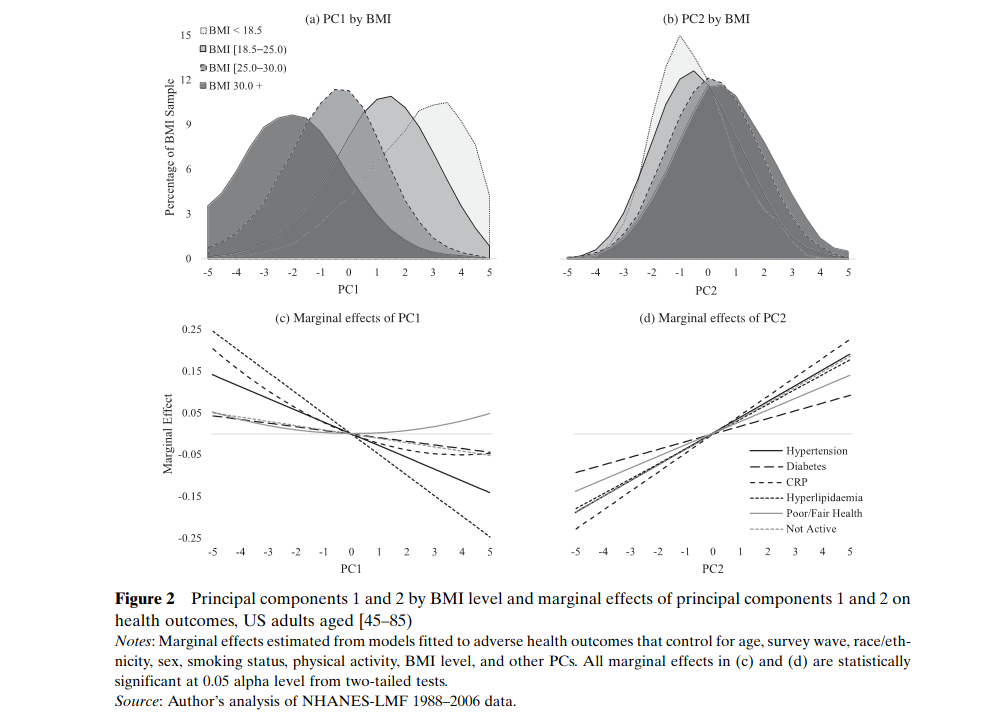
More information on the PCs I found in the supplementary material. Waist to thigh ratio also quite good! The thigh circumference having a two-way relationship (recall, PC2 we want to be small and PC1 we want to be big) comes from adiposity vs muscle-mass, obviously. For PC3 it is unclear if larger or smaller values are good, but it’s almost entirely defined by height and weight, so I suspect that lower values are more desirable but he should have made this more clear.
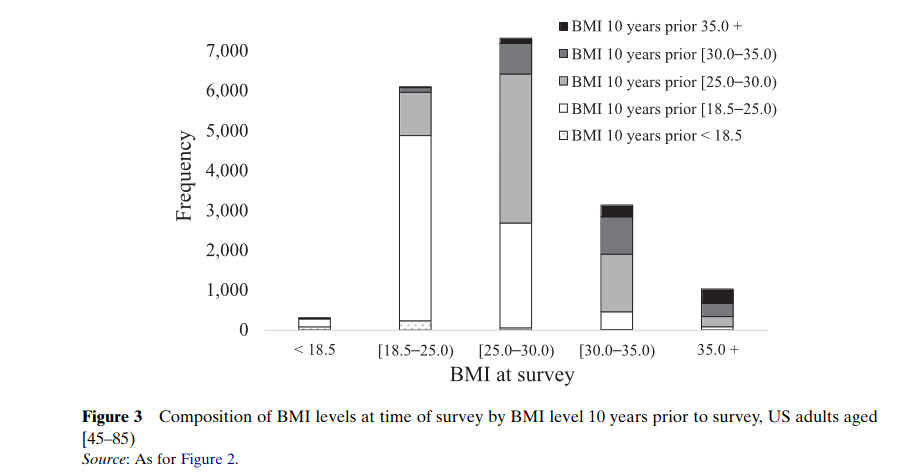
He then shows that recent changes in BMI can lead to bias as well. Note: he only has 2 measurements, 10 years apart. If he had more frequent measurements, it’s likely that the magnitude of this bias could be even greater. Either way, the results are significant!
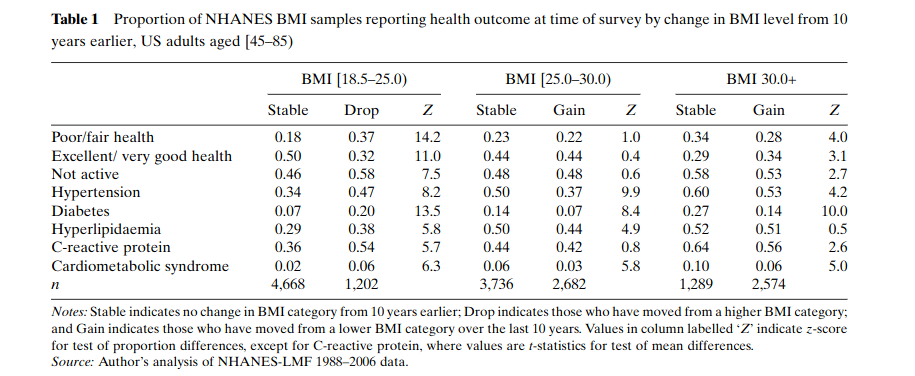
These losers/gainers are a significant proportion of the database! Big confounder!
Then he produced the headline plots I linked at the top (though I wish there were more of them), and proposed a new analysis of
Conclusions I have taken: BMI of 18.5-20.0 is likely optimal, though the HR from 20-22.5 or 22.5-25 is small enough that I’m comfortable with it. Within that BMI range, maximizing thigh circumference (leg muscle mass, we’ve known this is significant) and minimizing ABSI = waist(cm) / (BMI^{2/3} × height(cm)^{1/2}), i.e. minimizing waist circumference, is ideal (though measuring ABSI on its own and reading the paper that it came from might have some value). Maintain that body weight, and stay active. Stuff we already knew, but this paper points out that much of the epidemiology of BMI is biased due to those losing weight for reasons of disease, a population-wide weight gain like we’ve seen over the last 50 years, and body shape.
One other thing I’ll point out is, much like in the original ABSI paper, hip measurements did not come out of this (e.g. waist to hip ratio did not give independent value). The hip measurement always seemed odd to me, as it seems quite genetically dependent on bone structure. Thigh circumference as a marker that we have a lot more agency over.
Recall, also, that this is not a population with optimal or even reasonable nutrition. This paper did not look at that whatsoever. I suspect that the relative effect would only grow with healthy diet, but that’s my bias talking.
Think, also, about how this relates to epidemiology based on biomarkers more generally. In a population with growing factors that we expect to cause more harm over time (obesity, hypercholesterolemia, inflammatory markers, etc), we are likely underestimating their harm when we perform simple correlations. Be cautious, y’all.
What do y’all think? Interesting paper? Illuminating? Or are the author’s own biases showing too strongly?