This site lists optimal ranges for most if not all biomarkers, including with citations, including how to prepare for blood tests and the calculator on the site is based on the Bortz Blood Age paper published in the scientific journal Nature Communications Biology from 2023. It’s 11% better than PhenoAge.
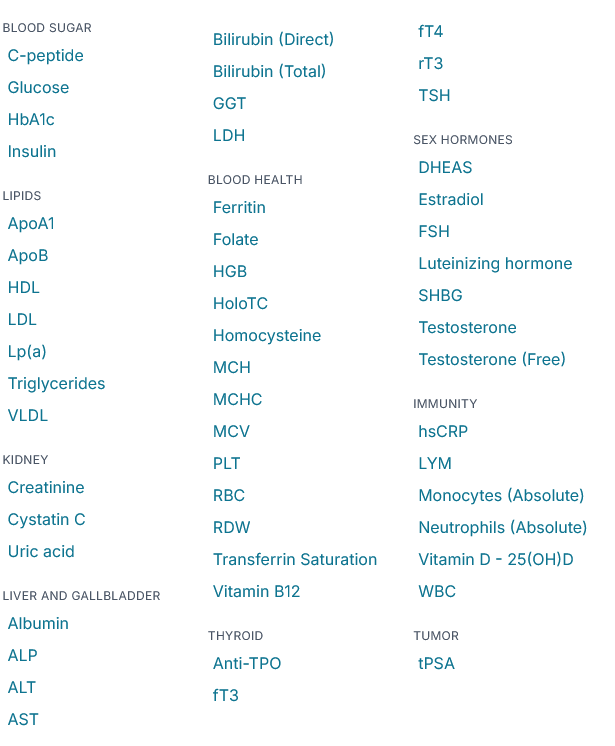
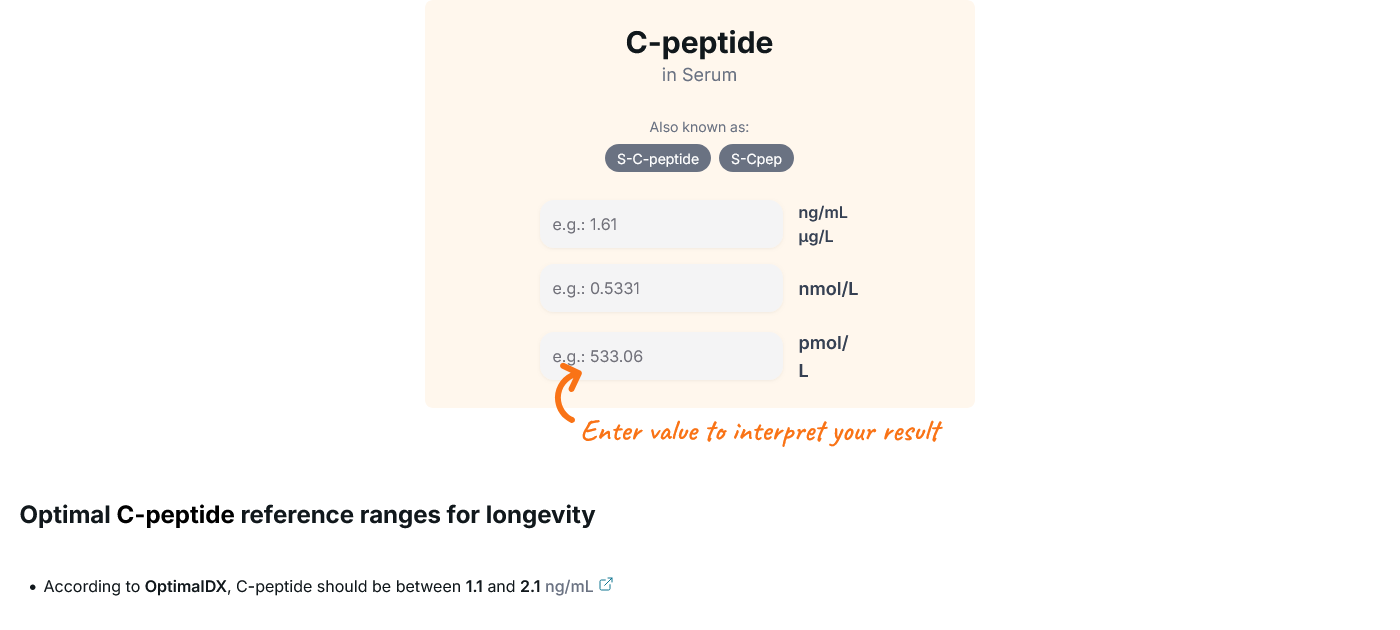
Excellent site to explore optimal values for individual blood markers. I appreciate the effort that went into gathering the data and producing tools to help us optimize our biomarkers.
One of the main benefits of the site is the ability to explore our individual markers and see how much effort we need to improve them. For example, improving Cystatin C is more important for most people than fasting glucose. We have countless posts about improving fasting glucose as compared to cystatin C posts.
As for the Humanity’s Bortz Blood Age Calculator, the test accuracy is unknown for people older than 73 years. This is unfortunate because there are many members of the forum that are older than 73 years.
The 11% increased accuracy would only make it differ from the Levine model by less than 2 years for most of us.
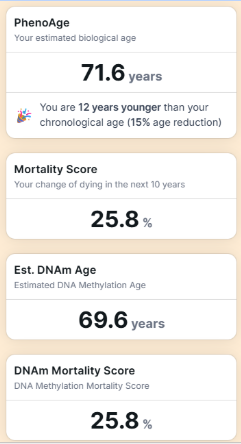
So, for fun, I put in my latest test results into the Levine calculator. As I understand it now, the biological age is more of a predictor. In other words, if I am 80 and the calculator indicates that I am biologically 70, I would have a mortality prediction of an average 70-year-old, not that I have the body of a 70-year-old. Correct me if I am wrong.
My latest:
So, I have a 75% chance of living another 10 years?
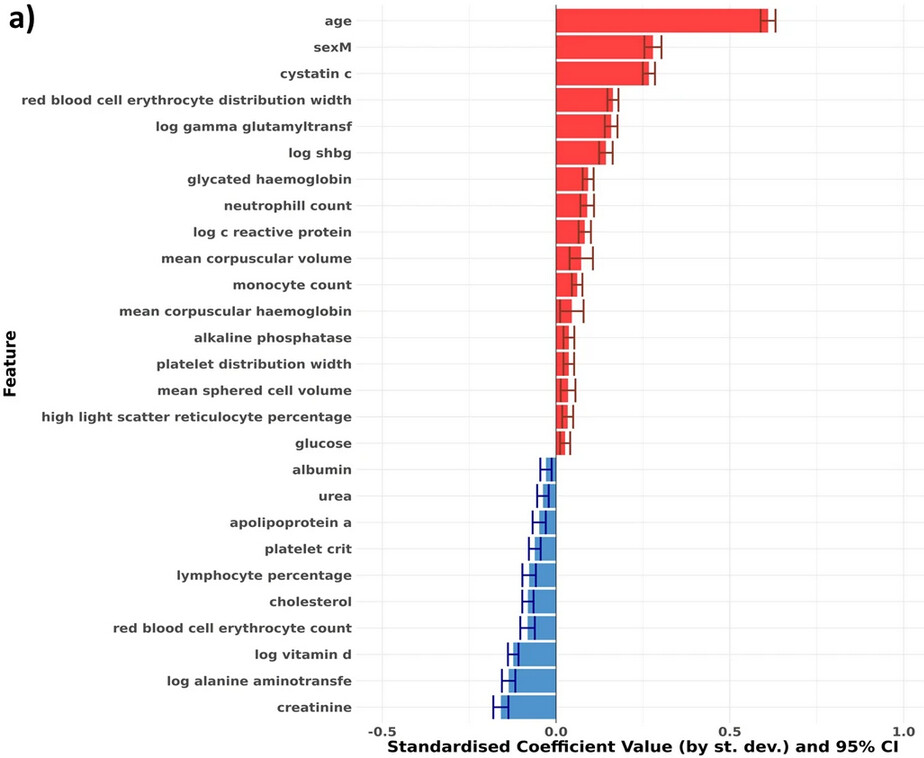
Here’s the different markers in Bortz Blood Age sorted by importance (red means higher is worse – while blue higher is better). It’s always when all other markers are equal, so higher creatinine is only better if cystatin c didn’t change – because it’s a marker of higher muscle mass in that case, for instance.
I’m ~12 years under my 81 chronological age too @desertshores. according to the narrative, the largest single reduction I can make (more than the other four combined) is lowering Cystatin-C. Last month is the first time I measured it but I’m not sure how much it can be improved.
My comment related to lowering Cystatin-C was poorly expressed. The accepted view is that most kidney functions cannot be increased but specific actions can slow the rate of decline. Those of us who have BP at least at the mid-point of the target can benefit in multiple ways by taking an ARB like telmisartan, keeping in mind that they lower eGFR by 15-20%. (The fact that this decline results in improved kidney health requires explanation to someone looking at that fact for the first time.) The next level of intervention is an SGLGT2 inhibitor, which further lowers eGFR and preserves kidney function.
The Bortz Biological Age Clock: Better Than PhenoAge?
Transcript Analysis: The Bortz Biological Age Clock vs. PhenoAge
The core thesis of this investigation centers on the technical architecture, predictive validity, and systemic limitations of the Bortz biological age clock, a phenotypic aging algorithm developed by Dr. Peter Joshi, Jordan Bortz, and colleagues (Bortz et al., 2023). Trained on the extensive UK Biobank dataset comprising approximately 306,000 individuals across 60 initial circulating analytes, the Bortz clock isolates 25 core blood biomarkers through an elastic-net Cox proportional hazards regression model utilizing stability selection. The parameters are subsequently evaluated via an unpenalized Cox model to ensure unbiased risk estimates, implementing an actuarial rule of thumb where every 10% increase in mortality hazard ratio translates linearly to a one-year increase in calculated biological age. Dr. Joshi demonstrates that the Bortz clock achieves a concordance index (C-index) of 0.778, statistically outperforming Morgan Levine’s established PhenoAge model (C-index 0.750) and capturing 2.5 times the excess predictive power for all-cause mortality relative to a baseline model restricted to chronological age and sex.
Despite this heightened predictive capacity, critical analysis exposes substantial translational flares and mathematical blind spots inherent to unstratified linear phenotypic clocks. Because the model relies on a strictly linear framework, it misinterprets non-linear, U-shaped, and bi-directional biomarker distributions. For instance, the training dataset contains late-life reverse causation artifacts where severe illness, frailty, and oncological cachexia drastically lower circulating lipids; consequently, the linear model erroneously registers extreme total cholesterol levels (up to 385 mg/dL) as biologically “youthful” while penalizing optimal, low-risk lipid profiles. Similarly, Sex Hormone-Binding Globulin (SHBG) is coded as a linear aging accelerator due to population-level correlations with metabolic decline. However, highly adapted individuals practicing long-term calorie restriction or intense physical training exhibit elevated SHBG alongside superior insulin sensitivity, resulting in an artificial inflation of their calculated biological age. Mean Corpuscular Hemoglobin Concentration (MCH) display similar vulnerabilities, where advanced metabolic syndrome presentations confound red blood cell indices to yield false-positive youthful readouts. To resolve these vulnerabilities, future iterations must transition away from unstratified population models, integrating age-group stratification, non-linear interaction terms, clinical comorbidity filters, and hard data caps to insulate phenotypic metrics against structural distortions and intentional biohacking.
II. Insight Bullets
Cohort Scale and Training Foundations: The Bortz biological age clock was constructed using data from 306,116 individuals within the UK Biobank, leveraging a comprehensive panel of circulating blood biomarkers to track systemic physiological decline (Bortz et al., 2023).
Concordance Index Superiority: The 25-biomarker Bortz model demonstrates a C-index of 0.778, significantly outperforming the 9-biomarker PhenoAge baseline of 0.750 in predicting true all-cause mortality trajectories (Bortz et al., 2023).
Elastic-Net Stability Protocol: Candidate features were strictly filtered using penalized Cox regression across 100 iterative sub-samples; a biomarker required a selection proportion greater than 80% to be integrated into the final clock architecture.
Elimination of Regularization Bias: To prevent mathematical distortion from shrinkage penalties, the final 25 selected biomarkers were re-fitted into an unpenalized Cox proportional hazards model to yield unbiased coefficient estimates.
Mathematical Actuarial Alignment: The model operationalizes risk through a simplified linear metric: a 10% elevation in an individual’s true mortality hazard ratio is defined as exactly a one-year acceleration in biological age.
Population Variance Spectrum: Within the standardized UK Biobank validation sets, individual biological age scores exhibited massive physiological divergence, spanning up to a plus or minus 20-year variance from true chronological age.
Geographical Generalizability Verification: Algorithms trained exclusively on regional cohorts from England and Wales generalized seamlessly to independent populations in Scotland without loss of predictive statistical significance.
Imputation Fidelity via Multivariate Normal (MVN): Utilizing MVN imputation allows the model to approximate full 25-marker profiles from sparse clinical blood panels, matching the predictive performance of bespoke models without requiring costly complete assay workflows.
Cystatin C as a Critical Node: Cystatin C serves as a dominant vector within the model; independent data confirms it acts not only as a renal metric but tracks closely with neurodegenerative axonal damage markers like neurofilament light chain (Plasma Cystatin C, 2022).
The Chronic Disease Subpop Paradox: The clock displays heightened predictive precision when applied to chronically ill cohorts compared to healthy populations, despite not being explicitly optimized for pathological tracking during development.
Townsend Deprivation Index Variance: The biological age acceleration signal tracks unevenly across socioeconomic boundaries, exhibiting higher mortality alignment in socioeconomically deprived populations than in affluent sub-groups.
The Cholesterol Reverse-Causation Trap: Because terminal cachexia and liver frailty drop lipids late in life, the linear model inappropriately codes pathological total cholesterol elevations (up to 385 mg/dL) as indicators of biological youth (BMJ Open, 2024).
SHBG Calibration Failure: The model penalizes higher SHBG levels as markers of advanced age, completely misclassifying the safe, highly insulin-sensitive elevations in SHBG induced by long-term calorie restriction or physical exercise (Fontana et al., 2012).
MCH Metabolic Syndrome Distortion: Lower MCH is mathematically interpreted as youthful, but severe metabolic syndrome can paradoxically increase total red blood cell count and hemoglobin concentration to depress MCH, generating a false-positive youthful score.
Biohacking Vulnerability and Data Caps: Phenotypic clocks are highly susceptible to artificial manipulation via targeted megadosing (e.g., exogenous testosterone or supra-physiological Vitamin D), necessitating the implementation of algorithmic data caps to maintain clinical realism.
IV. Actionable Protocol (Prioritized)
High Confidence Tier (Level A/B Evidence)
Multi-System Biomarker Composite Tracking: Transition away from monitoring isolated health metrics. Deploy integrated tracking of comprehensive blood panels containing functional biomarkers representing distinct physiological pillars: renal function (Cystatin C, Creatinine), metabolic health (HbA1c, Glucose), inflammation (hs-CRP), and hematology (Red Cell Distribution Width, Albumin) to evaluate overall mortality risk trajectories (Bortz et al., 2023).
Glycemic and Hyperinsulinemia Suppression: Maintain strict glycemic targets to minimize circulating insulin exposure and preserve beta-cell kinetics. Lowering HbA1c and fasting glucose downregulates the fundamental metabolic drivers of somatic aging acceleration and chronic disease pathogenesis (Hyperinsulinemia, 2021).
Absolute Risk Clinical Stratification: Interpret individual biomarker fluctuations through absolute risk curves rather than purely relative laboratory reference ranges. A biomarker can sit within a standard “normal” band while displaying a clear trajectory toward accelerated physiological decline.
Experimental Tier (Level C/D Evidence)
Calorie Restriction with Nutrient Sufficiency: Implement moderate calorie restriction (a 10–20% energetic deficit while maintaining micronutrient and protein density) to optimize cellular stress resistance, maximize insulin sensitivity (Matsuda Index metrics), and downregulate pro-aging growth pathways (IGF-1). Practitioners must expect a concurrent, benign elevation in circulating SHBG levels (Fontana et al., 2012).
Dual Organ-Neural Surveillance via Cystatin C: Utilize regular Cystatin C monitoring as a high-sensitivity proxy for glomerular filtration rates and a subclinical marker of neurodegenerative progression and neurofilament light chain (NfL) elevations, targeting optimal youthful functional bands rather than lenient clinical thresholds (Plasma Cystatin C, 2022).
Red Flag Zone (Debunked or Safety Data Absent)
Clock Gaming via Supra-Physiological Substrate Dosing (“Safety Data Absent”): Avoid the practice of consuming supra-physiological doses of Vitamin D, exogenous testosterone, or other hormones purely to manipulate specific downstream biomarkers and force an artificially low biological age calculation. This behavior introduces profound risks of hypercalcemia, renal calcification, and cardiovascular events while masking true systemic aging status.
Dietary Lipid Manipulation to Match Linear Artifacts (Debunked): Do not deliberately increase saturated fatty acid intake or eliminate dietary fiber to intentionally elevate total cholesterol toward the clock’s artifactual “youthful” target zone (>300 mg/dL). This ignores late-life reverse causation curves and directly accelerates atherogenesis and long-term cardiovascular mortality risk (The BMJ, 2020).
Ignoring Extreme Red Cell Distribution Deviations: Do not treat abnormal drops in MCH or extreme shifts in red blood cell volume as benign indicators of youthfulness if they occur outside of a balanced, non-pathological context. These metrics can be clear structural indicators of underlying iron deficiency anemia or active metabolic syndrome components.
I started monitoring Cystatin C last year. My first blood draw showed 1.32 which is pretty high and outside the range of 0.6 to 1.2. Have been trying to figure out what may affect it. I hoped it was not Rapamycin which is my life support. I stopped taking all supplements and after a month break remeasured Cystatin C. It dropped to 1.15 which is a huge progress for me and my transplanted kidney. Will continue avoiding supplements, besides vit D3/K2, for another month and then remeasure Cystatin C.
Created a spreadsheet with some reference and optimal ranges for longevity and healthspan markers as best I (and Claude) could manage. Claude (with an MCP connection) was able to create a spreadsheet with these and changes the cell fill color based on being in the optimal or outside then reference range. Here are the (excessive) tests and ranges I found:
The calculator is cool, but seems biased towards men? Inserting a very normal female SHBG flags as high and adds several years to the biological age. If you click the suggestions for SHBG, then select “female” it shows the result is perfectly within range. Bit of a shame, falsely elevating most women’s biological ages.
I can’t speak to the accuracy of the calculator, but I happen to have results for all of those labs and plug them in. It tells me that I’m nine years younger than I am on the biological clock, about a 20% difference from my actual age.