http://aging.ai/ Any one use the Aging.AI calculator? Impressions on accuracy? Other low cost tools to monitor progress?
1 Like
Its difficult to say how accurate it is. We don’t know the methodology. It is nice to have a system which does not take in the chronological age, but you cannot be certain it works properly.
I just did an experiment loading one of their examples and varying Albumin. At the default 49 the age was 37 at 55 it was 34 and at 40 it was 66. The problem with that is Albumin is a u shaped curve for mortality and 55 is probably worse than 49.
Levine’s phenoage is more reliable and the methodology has been published.
My personal view is to use these as a guide, but to concentrate on the values of the various biomarkers themselves.
Things like Blood Pressure, Resting Heart Rate and Heart Rate variability have meaning so do things like MCV, HBA1c, ALP, Creatinine etc etc,
3 Likes
All the biological / epigenetic clocks are still in their early days of development and none are validated with lifespan studies (in animals) or even physiological functioning in humans (to the best of my knowledge) - so I don’t believe its worthwhile to put money into them yet.
So - yes - I use aging.ai, and also the Levine phenotypic age calculations. More details and links to the spreadsheet, etc here: A Friendly, Biological Age Reduction Competition?
Please post your results over time (and ideally pre and post rapamycin).
I don’t think the Ageing.Ai calculator is to be dismissed lightly.
IMO: They have more scientific research behind their calculator than the Levine clock.
They have crunched a lot of data from tens of thousands of blood tests. They are in collaboration with Nividia deep learning AI.
Check out the website of Insilico Medicine.
This Doctor Michael Levitt is a Nobel Prize winner in chemistry
"Now, says Dr. Levitt, Insilico Medicine is using AI to create an entirely new AI-driven drug discovery pipeline from A to Z. Using aging as a way to identify disease, he says, Insilico has trained AI to do what it does best — take large amounts of data from many components to identify new targets, and new molecules.
IMO, this article is a must read to understand their clock.
“This is a deep-learned predictor of your age made with a deep neural network trained on hundreds of thousands anonymized human blood tests.”
“The performance of models was also evaluated on publicly available samples of the American population from the National Health and Nutrition Examination Survey (NHANES).”
" In total, four datasets containing 20,699 samples for the Canadian population, 65,760 samples for the South Korean population, and 55,920 samples for the Eastern European population."
2 Likes
FWIW

Alex Zhavoronkov, PhD (aka Aleksandrs Zavoronkovs)
We are very far from one aging clock to rule them all, but now there are many aging clocks available in one cloud as SaaS from
- Register for the JuvAge clock cloud launch.
I really hope Aging.ai is accurate as it says I am 18 years younger than my chronological age!
1 Like
I do look at aging.ai and have written an interface to it. I think biomarker based systems are good tools, but it and levine have issues (both with albumin definitely)
I will look at writing an interface to juvage as well.
The key question is what useful information people get to guide what they do.
Putting a more detailed response. If we take two biomarkers Albumin and White Blood Cell numbers.
In both levine and aging.ai more Albumin is considered to be a good thing. Lets ignore the U shaped curve for now. In Levine WBC count is considered to be a bad thing (in the sense of a higher biological age for a higher quantity of WBC)
Now one might conclude from those two things that we should try to increase Albumin and reduce WBC.
Looking at this personally, however, I have a lowish Albumin and WBC. As far as Albumin is concerned my level is low almost certainly because I am constraining my inputs (CR) in order to lose weight (incidentally this morning my weight was lower than it has been for decades - I don’t know how many decades at least 4 maybe 4.5)
Hence if I am to be guided strongly by the biological clocks what I am doing is wrong.
Similarly my WBC is low (not because of chronic Rapamycin use as I use it intermittently). I should celebrate this, but I am not entirely happy about it and have been looking at what can be done to facilitate WBC production.
CR (Calorie Restriction) is supposed to be a good tool for longevity. However, it would be expected to reduce Albumin. What should people do.
I think the Biological clocks are a good initial tool, but our objective should not be to improve mortality merely as measured by the biological clocks.
3 Likes
I agree, but it is somewhat useful to keep track of how we are doing.
Apparently, I am one of the few who was using the clocks before taking rapamycin.
What is not clear to me and what has not been answered to my satisfaction is why my “clock” age took such a dump after starting rapamycin.
But, with the clocks and information from some of the gurus like Michael Lustgarten, I have some indication of what to aim for.
This guy from Tuft University has been using these clocks for years, testing his blood 6 times a year. Uses aging Ai, and Levine Phenotype. I believe he said Levine was better. Many videos from him on all these clocks. Quantifying Biological Age: Blood Test #3 in 2021 - YouTube
1 Like
I dont know how to find your post with your clock results, but if you post the biomarker changes i will give a view as to which are affected by rapa. Probably fasting glucose which has a big inpact on both.
Some food for thought here: https://joshmitteldorf.scienceblog.com/2022/10/20/designing-a-methylation-clock-that-reliably-evaluates-anti-aging-interventions/
I have been following Josh for several years now and his posts are definitely thoughtful, you can agree totally or not with him but his comments always follow an interesting line of logic thinking, IMHO.
2 Likes
To really get anti aging mainstream, a good clock is needed. How else can you evaluate your interventions? It also needs to be cheap enough for widespread adoption. That’s why I am really hopeful that Tally Health is successful.
However with clocks, I am always worried that there are “cheats” that make you appear younger or older than you really are.
1 Like
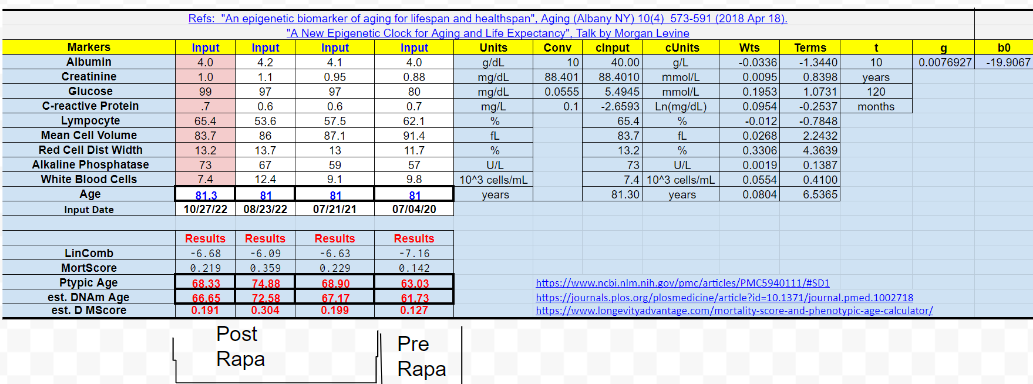
Comparing specifically 4th July to 21st July, but the issues are the same:
Albumin, this initially went positive than negative, Albumin is, however, a u shaped curve although the bad part starts after 5.
Creatinine is a really difficult biomarker. It has a big problem in that delays between taking blood and testing it can increase creatinine by quite a bit. Hence you need to exclude that. It is used to monitor kidney function and says that kidney function had deteriorated a bit although it is in the margins of error. This has a negative effect in biological age. Creatinine also goes up with more muscle mass. Hence short term movements where testing is good are reliable. Others are useful, but not necessarily that useful.
Glucose is a big one for Aging.ai and levine and an increase in fasting glucose (make sure it was fasting glucose) is I think a known issue for Rapa and something which increases biological age.
CRP was a slight improvement intially, please check that it is a value in mg/L not mg/dL on your blood tests. You have a good CRP and personally I think it is in part an indicator of senescent cell load. Hence this reduced your biological age intially, but then it went up on the last one.
Lymphycytes % better is good. Hence better, better, worse. I have commented about whether you have an underlying issue to look at here.
MCV is really good progress it is a slow thing to move, but your biological age would have improved here. (MCV requires all the blood cells to renew to change completely to a new context which is about 120 days).
RDW went up and increased your biological age. However, RDW will go up when you are improving MCV and should then come down if you maintain the position in terms of RBC creation. Hence the fact that it went up and increased your biological age should be ignored as bad data.
ALP is more worrying as it implies a gradual, but normally within testing errorish deterioration in liver function. If it keeps getting bigger and increasing your biological age then you need to consider why.
WBC - more WBC is considered by Levine as to increase your biological age. It actually went down to start, but then went up. I wonder if you are fighting some form of chronic infection somewhere.
Is that any use?
The big value shift is probably glucose.
If you use Levine on my website at
http://www.biohacking.tools
you can see the change in the biological age as you change values so you could see what it would have been had glucose not changed for example. This can also be done with the spreadsheet versions, but many of the web systems don’t work that way.
Aging.ai’s user interface is not very good for what if types of things although it is possible. I have managed to get it to work via my website, but if they set up a good API using juvage I will aim to link to that which enables putting the data in once and getting results from multiple systems.
2 Likes
As a matter of interest here are my recent ALP figures 74 74 70 76 76 70 76 74 77 73 81.92 75 83.91 74 92.01 query effects of earler blood draw 76 136.22 87.07 67 62 75 65 90.61 87.56 78.52 78.21 75.5 76.55 58
The 58 was last week (I am doing another blood test today) and the initial 74 was May last year. I started weekly blood tests on 5th May 2022. I am actually quite pleased with 58, but from time to time I am a heavy drinker. The 136 figure was in a set of figures affected by what in the UK is really hot weather that changed so many of my biomarkers as a result of vasopressin (and possibly other changes) that initially I thought I had the wrong test results.
The vasopressin issue is why I really like weekly blood tests as it enables tracking changes from relatively small numbers of exogenous factors.
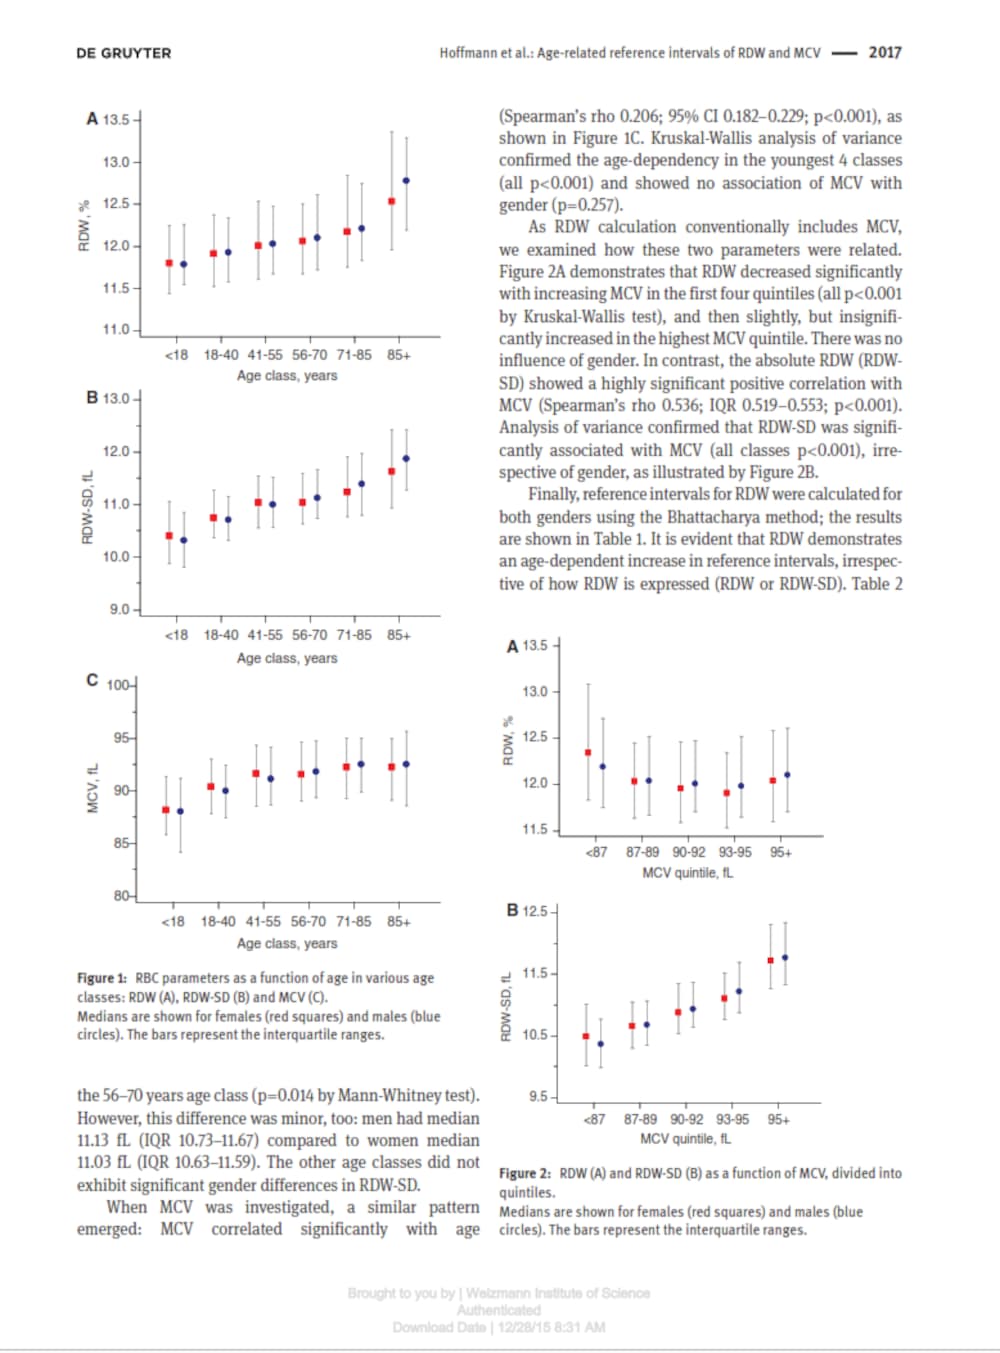
If I am interpreting the tables correctly, I have an MCV of less than 18-year-olds and an RDW of a 100-plus-year-old.
Also, it says that when MCV goes down RDW goes up.
Please explain.
1 Like
Ignoring for the moment test errors. RDW measures the variation in the size of red blood cells. The health of a RBC is inversely associated with its size (normally measured in femto litres).
If you are producing cells of around 95 fl and then start producing cells of a size of around 85 fl then the variation in the sizes RDW will increase until about 60 days have elapsed (because they last about 120 days) and then it will decrease.
MCV tends to be bigger for people who drink Alcohol, but also other people with various problems with their blood.
Incidentally I use four labs relatively frequently and one lab infrequently. Today I had blood sent to three of the labs so I can compare results (from essentially the same sample).
3 Likes
Interesting… Please let us know the variation between the three labs. This is an interesting experiment… and I have heard anecdotally that there can be a significant difference, but I’m not sure how common that issue is. Of course you are in the UK and things may be different there.
1 Like