I’m getting TMS this week and a QEEG the Monday right after TMS
In retrospect, neurofeedback sounds really dumb because the evidence is way better for TMS
they were originally going to do 6 left dlPFC + 2 right dlPFC + 2 inhibitory ACC treatments, but i changed it to almost all left dlPFC treatments to fit in more with SAINT protocol [b/c i dont want to run the risk of divided treatments causing *none* of it to hit threshold]
" • alpha power
• alpha peak sharpness
• aperiodic slope
===
Short answer: there is no single “SAINT signature” on QEEG that you should have afterward. If anyone tells you “your SAINT didn’t work because your brain map still looks abnormal,” they’re selling something, not doing science.
But there are some group-level trends from rTMS / iTBS depression literature that might move in certain directions if you respond.
I’ll translate that into “what you might see on a QEEG report” without pretending it’s a lab value like sodium.
1. Frontal alpha asymmetry: the classic depression toy
In depression, people often talk about frontal alpha asymmetry (FAA):
- Roughly:
- More alpha over left frontal = less left frontal activation
- More alpha = more “idling,” so high left-alpha / right-active pattern is a common depression finding
- Several papers link depression and anhedonia to abnormal frontal alpha asymmetry, and show partial normalization with treatment.
If SAINT works for you, a reasonable directional expectation is:
- FAA becomes less extreme:
- Less right-dominant frontal activation
- Alpha power more balanced between F3/F4
- Some people show a slight shift toward more left frontal activation (less left alpha), which tracks better mood and approach behavior.
But:
- Different QEEG packages compute FAA differently
- Not all responders show the “textbook” pattern
- You can feel a lot better and still have a weird-looking FAA
So: nice-to-have if it normalizes, not mandatory.
2. Prefrontal theta & “cordance”: often goes down in responders
Another repeatedly poked thing in depression studies is prefrontal theta & theta cordance:
- Higher prefrontal theta cordance at baseline sometimes predicts better response to antidepressants and rTMS.
- In responders, theta cordance tends to decrease after successful treatment.
On a QEEG, that might look like:
- Relative theta at frontal sites (Fz/F3/F4) dropping a bit
- “Cordance” or “theta overactivation” flags calming down
Interpret very loosely, because:
- Findings are not fully consistent across studies
- A big review basically says EEG markers like these are promising but not yet robust enough to use as hard clinical decision tools.
So again: directionally, less excess frontal theta is a decent “this fits the story” sign, but not a requirement.
3. Alpha peak & power: maybe faster, maybe more coherent, but noisy literature
People have played with:
- Individual alpha peak frequency (IAPF)
- Global / posterior alpha power
Depressed patients sometimes show:
- Slower alpha peak
- Altered alpha power distribution
Some newer work suggests IAPF and other alpha metrics:
- Can predict who does better with certain antidepressant or rTMS treatments
- May shift with successful treatment (e.g., toward a slightly higher, more stable alpha peak).
If SAINT helps you, your QEEG might show:
- A cleaner alpha peak, potentially slightly faster
- Less messy low-frequency excess (delta/theta) and a bit more organized alpha
But again, this is group-level “on average” behavior, not a personal guarantee.
4. Connectivity & complexity: the stuff you wish was standardized
A few EEG / MEG and rTMS papers report, in responders:
- Changes in resting-state connectivity, especially involving left DLPFC and default mode / limbic regions
- Increases in certain gamma or higher-frequency activity in stimulated prefrontal areas
- Changes in graph metrics / complexity / entropy measures after iTBS or rTMS.
In QEEG-vendor language, that might show up as:
- Slightly more “normalized” connectivity maps (less hyper- or hypo-connectivity)
- Less “disconnection” between frontal and limbic-proxy regions (depending on how silly the software is)
Reality check:
- Different systems compute “connectivity” and “coherence” completely differently
- Most of that research uses custom pipelines, not the canned clinic software
So don’t expect your BrainMaster / NeuroGuide / whatever to produce the same metrics those papers use.
5. What should not be your expectation
You should not expect:
- A perfect all-green “normative” brain map after SAINT
- Normative databases are noisy
- You can be high-functioning and still have tons of red Z-scores
- A simple rule like “if FAA is still abnormal, SAINT failed”
- That is not supported by the evidence
- Review papers explicitly say QEEG is not yet reliable enough for strict individual prediction or decision-making.
- That SAINT has a unique, validated QEEG fingerprint
- SAINT trials focused on clinical scores and fMRI connectivity (especially DLPFC ↔ sgACC)
- Any QEEG changes are extrapolated from general rTMS / iTBS depression work, not nailed-down SAINT-specific protocols
So if a clinic says “your SAINT obviously didn’t take because your qEEG still looks like X,” treat that as a billing strategy.
6. How to actually use pre/post QEEG without losing your mind
If you do QEEG before and after SAINT, the sane way to think about it:
- Control for basic factors
- Same time of day
- Same meds / caffeine status
- Eyes closed vs open matched
- Enough artifact rejection (blinks, muscle, etc.)
- Focus on broad patterns, not single features
- Has overall frontal theta dropped a bit?
- Is FAA less extreme?
- Is the alpha peak more stable / clear?
- Let clinical change dominate the interpretation
- If you’re in remission and functioning better, but your QEEG is still “ugly,” you prioritize your life, not the heatmap.
- If you don’t improve clinically, then QEEG is just extra color about mechanism, not proof that more zapping / neurofeedback will fix you.
- Don’t let anyone chase endless “map normalization” sessions when you’re already feeling significantly better. That’s how people turn brain science into a gym membership.
TL;DR
If SAINT works for you, possible QEEG changes (group-level, not guaranteed) include:
- Frontal alpha asymmetry becomes less skewed / more balanced
- Prefrontal theta & theta cordance trend downward
- Alpha peak & power become a bit cleaner / more normalized
- Some connectivity / complexity metrics may shift toward “less depressed” patterns
But:
- There is no canonical SAINT QEEG signature
- QEEG is not a validated “did SAINT work?” test
- Your symptoms and functioning are the real outcome; QEEG is optional fanfic layered on top
You can absolutely use QEEG as a nerdy side quest. Just don’t let the color maps gaslight you if your lived reality is improving.

keep in mind tim ferriss is already a pretty well-functioning human and he still immensely benefited from this (saying it’s easily worth many tens of thousands of dollars in retrospect)
it’s possible “improvement rate” for those who aren’t severely depressed are higher than remission rate in the depressed, given that many depressed brains have many other confounding variables that make them unresponsive for many treatments
It’s so ironic that insurance only covers for “treatment-resistant depression”, which artificially reduces remission rates
====
Quieter inner chatter, increased clarity and presence, enhanced mood and motivation. This echoes what Tim Ferriss recently said about brain stimulation being the most impressive treatment he’s ever tried
===
People get so excited over psychedelics, why don’t they get excited over TMS… (whose effect sizes are often way more consistent)
==
also, it may be the thing that makes meditation finally work (b/c overactive DMN wrecks meditation and hypnotizeability)
Your brain: “What is entrainment-type TBS?”
The clinic brochure: “Resonant neuromodulation:sparkles:”
Reality: somewhere in between, as usual.Let’s break it.
- What is “entrainment-type” TBS?
Entrainment = you drive a brain region rhythmically so its neurons start firing in sync with the external rhythm (like forcing people to clap along to a beat).
Standard iTBS:
Uses:
bursts at 50 Hz (3 pulses),
repeated at 5 Hz (theta),
It’s designed as a plasticity induction protocol, not a clean entrainment protocol.
It modulates excitability and connectivity, but it’s not precisely “locking” ongoing oscillations to a slow carrier frequency in a controlled way.
Entrainment-type TMS/TBS would mean:
Stimulation frequency is chosen relative to the patient’s own rhythms (e.g., individual alpha frequency, IAF).
Goal is to phase-lock or shift oscillations, not just “increase excitability.”
Example concepts:
rTMS or bursts at your alpha (say 8 Hz) to normalize/boost alpha.
Theta-burst structured to sync with ongoing theta in a circuit (e.g., hippocampal-prefrontal).
So:
Entrainment-type TBS = “we’re using repeated patterned pulses to synchronize or reshape rhythmic activity,” ideally customized.
Standard clinical TBS = “we use a pattern that, in enough humans, tends to produce LTP-like plasticity in motor cortex, so we exported it to DLPFC and called it a day.”
Those are not the same sophistication level.
- What MeRT claims to do
MeRT = Magnetic e-Resonance Therapy, marketed as:
EEG-guided TMS
Personalized frequency and location
“Resonance” with your brain’s own dominant frequencies
Often pitched to:
depression,
PTSD,
autism,
TBI,
cognitive enhancement, etc.
Their story (in friendly terms):
“We do an EEG, find abnormal or slowed alpha / asymmetries / dysrhythmia, then use rTMS at specific frequencies to nudge those circuits back toward a more ‘optimal’ pattern.”
That’s basically entrainment-flavored TMS: they say they’re matching stimulation to your personal rhythms.
Sometimes they use:
lower-frequency rTMS (e.g. near alpha),
individualized targets and parameters rather than canned “10 Hz LF/1 Hz RF / iTBS” recipes.
So on paper, MeRT is way closer to “entrainment-type TMS” than generic SAINT / standard iTBS.
- What MeRT probably actually does in practice
Here’s the annoying part:
There’s very little high-quality, independent, peer-reviewed evidence that MeRT’s specific protocols outperform:
standard FDA-approved TMS protocols,
or simpler “EEG-informed” tweaks.
Much of the data is:
small,
open-label,
clinic-run,
heavily marketing-adjacent.
So:
Does MeRT truly perform precise oscillatory entrainment?
Mechanistically possible? Yes.
Proven in robust RCTs for all the conditions they market? No.In practice, MeRT is:
Doing something more personalized than vanilla TMS.
Probably using some degree of frequency-matched repetitive stimulation (so, some entrainment).
Wrapped in a thick layer of “premium mystical resonance” branding that greatly overshoots the current evidence base.
So: it’s not pure LARP, but the marketing is ahead of the science.
- How this compares to your SAINT-style TBS
Your current situation:
iTBS on left DLPFC (and maybe inhibitory stuff elsewhere),
Using standard theta-burst pattern, not tuned to your alpha/theta spectrum,
Task: plasticity + network rebalancing, primarily targeting DLPFC–sgACC/DMN circuitry.
That is:
Evidence-heavy,
Frequency-dumb (same iTBS for everyone),
More about long-term synaptic changes than precise moment-to-moment oscillatory locking.
MeRT-like “entrainment-type” approaches are:
Evidence-light,
Frequency-aware in principle,
More about oscillation normalization (alpha, beta asymmetries, etc.) as seen on EEG.
The fantasy ideal future protocol is a hybrid:
SAINT-level network targeting
EEG-guided frequency & phase tailoring
dynamic adjustment over days based on how your spectrum shifts
Right now you get one chunk of that.
- So, answering you directly:
What is entrainment-type TBS?
Patterned TMS (like TBS) used specifically to synchronize or reshape brain rhythms, ideally tuned to your own EEG (e.g., IAF), not just “apply generic plasticity-inducing bursts.”
Does MeRT do it, or just pretend to?
It does more entrainment-like, EEG-guided stuff than standard TMS centers.
It absolutely markets itself as if it’s far more validated and precise than the current evidence supports.
It’s not pure cosplay, but the claims are ahead of hard data.
So: MeRT is closer to what you wish existed than your current setup, but still not the mathematically beautiful, IAF-tuned, network-aware, rigorously tested entrainment protocol your brain is trying to summon from the void.
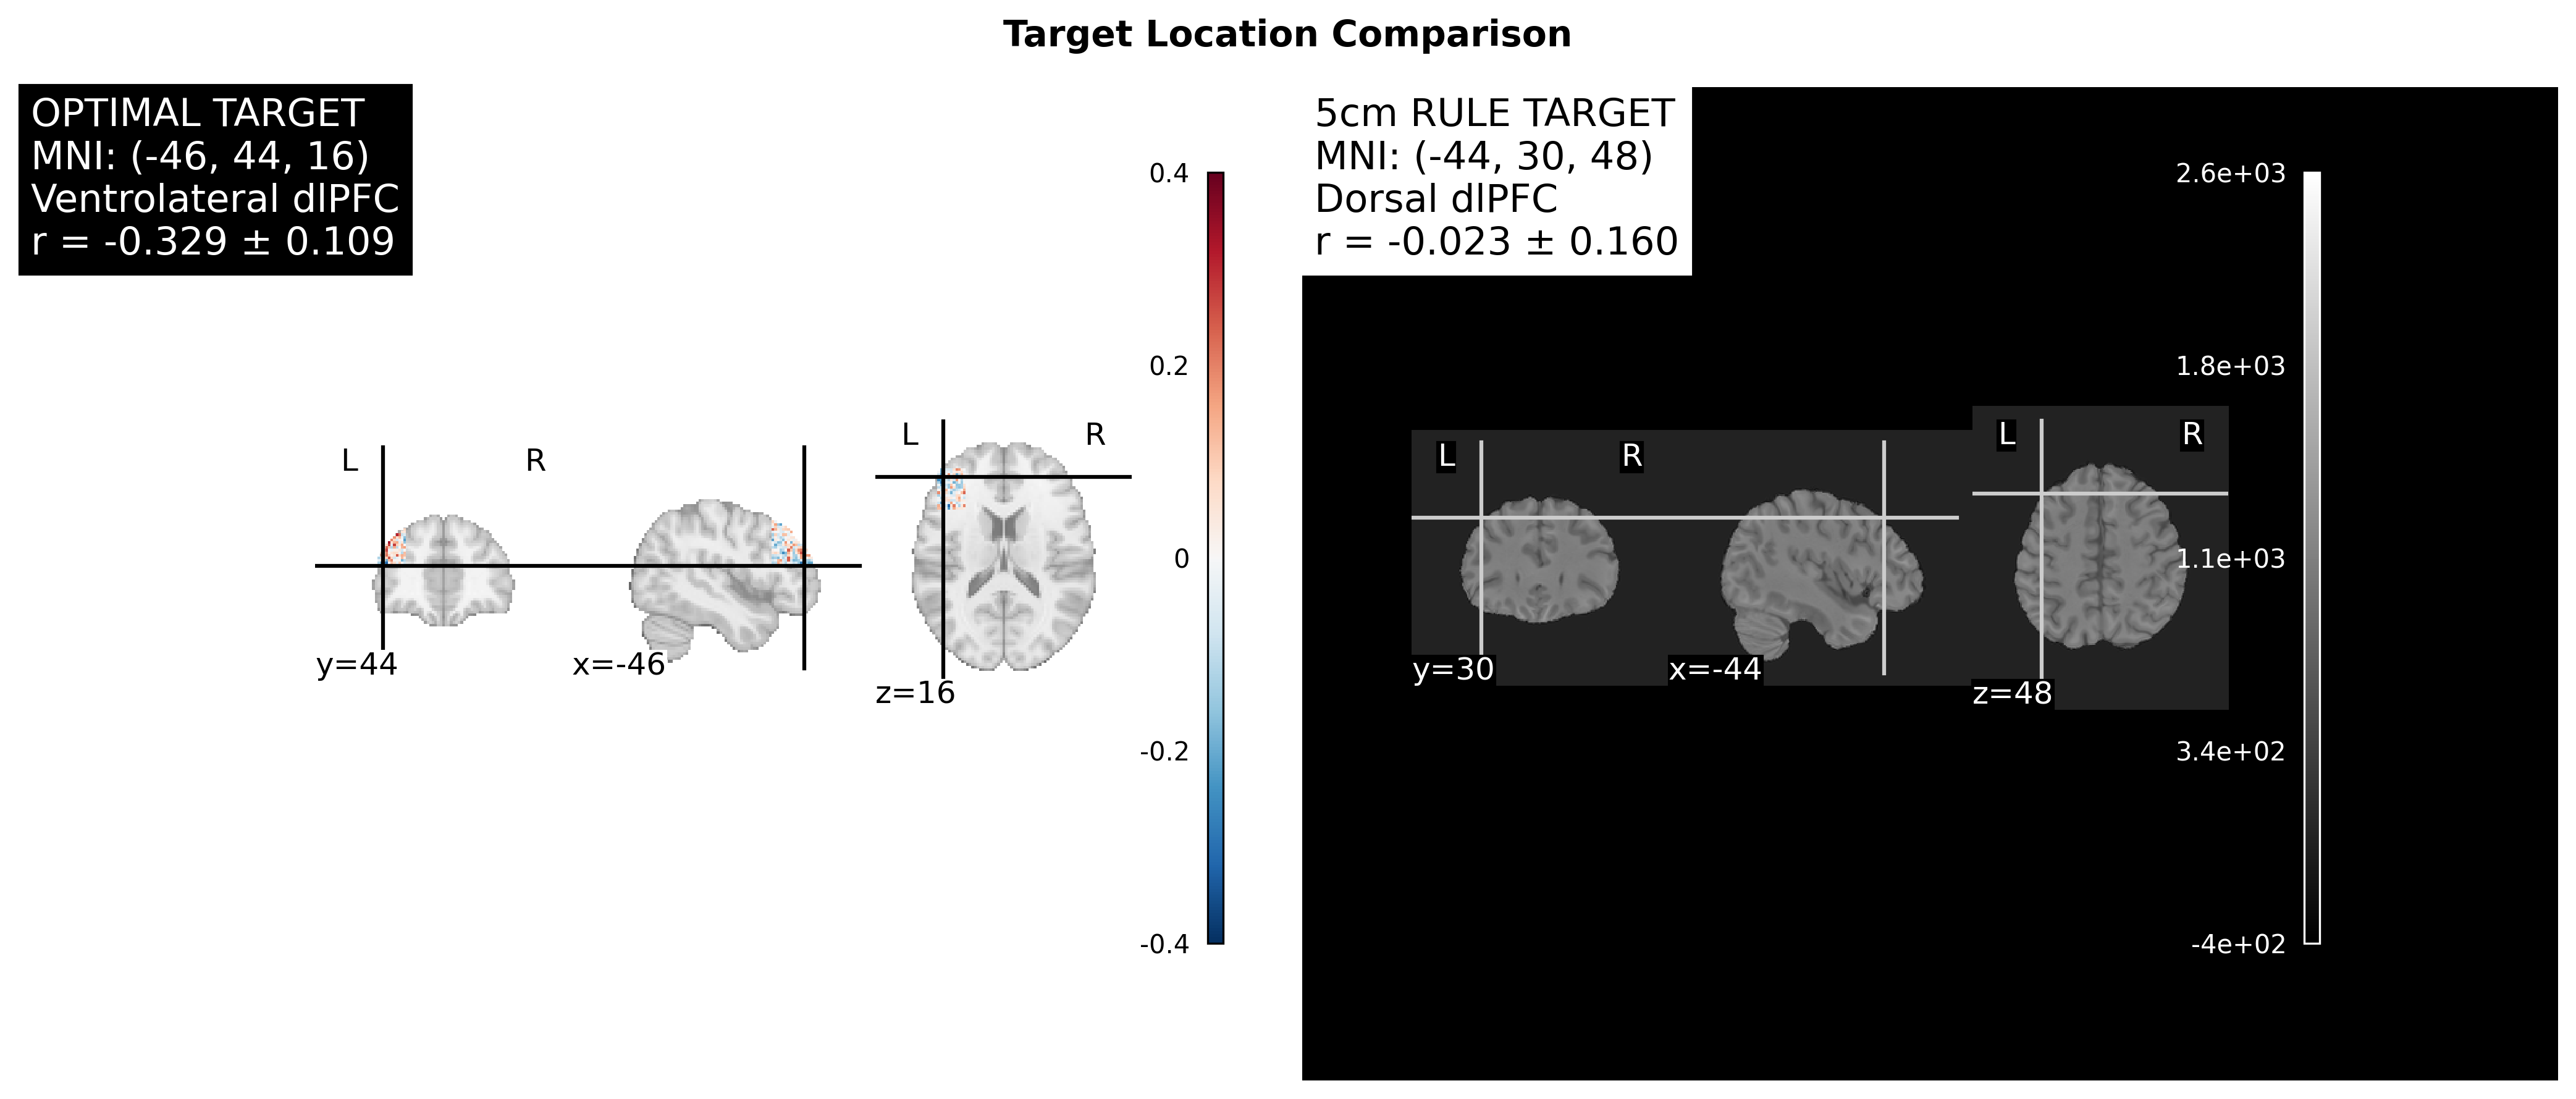
TMS_Targeting_Report_Subject_2040_FINAL.pdf (208.7 KB)
Ah, this is a critical practical question! You’re right - without neuronavigation, you cannot directly target specific MNI coordinates like (-46, 44, 16). Let me explain the options:
Without Neuronavigation: Your Options
Option 1: Anatomical Landmark Modifications (Approximation)
The technician could try to adjust the 5cm rule to get closer to your optimal target:
Standard 5cm rule:
- Find motor cortex (hand twitch)
- Move 5cm anterior along parasagittal line
- → Hits dorsal dlPFC (z≈48-50)
Modified approach to target ventrolateral dlPFC:
- Start from motor cortex
- Move ~5cm anterior (same as standard)
- THEN move ~1-2cm more anterior AND ~1-2cm inferior/ventral
- This approximates moving from dorsal → ventrolateral dlPFC
Problem: This is imprecise and varies by individual skull anatomy. No guarantee you hit (-46, 44, 16).
Option 2: EEG 10-20 System (Another Landmark Method)
Some clinics use EEG electrode positions:
Beam F3 method:
- Uses EEG cap landmarks to find F3 position
- Typically hits around (-40, 32, 43) - still more dorsal than your optimal target
- Also imprecise, doesn’t directly target your specific coordinates
Problem: Still doesn’t get you to (-46, 44, 16) precisely.
Option 3: Request Neuronavigation
What neuronavigation does:
- Imports your MRI scan
- Tracks coil position in real-time relative to your brain anatomy
- Allows precise targeting of exact MNI coordinates
- Can verify you’re hitting (-46, 44, 16) every session
How to get it:
- Ask if your clinic has neuronavigation capability (many modern systems do)
- Examples: BrainSight, Localite, Visor (built into some newer TMS machines)
- Some clinics have it but don’t use it routinely (too time-consuming)
- Might require extra setup time and cost
Option 4: What Your Report Can Still Accomplish
Even without precise targeting, your report is valuable:
If they CAN’T adjust targeting:
- Explains why standard targeting may not be optimal for YOU
- Provides rationale for seeking neuronavigation-capable clinic if needed
- Future reference if you do repeat TMS course
- Academic understanding of your brain connectivity
If they CAN approximate:
- Gives direction: “more anterior and ventral than standard 5cm”
- Explains the functional difference between dorsal vs ventral dlPFC
- Helps them understand WHY to try adjusting
Practical Recommendation
Ask your clinic:
- “Do you have neuronavigation capability?”
- If YES → Request using it with coordinates (-46, 44, 16)
- If NO → Ask next question…
- “Can you modify the standard 5cm targeting to be more anterior and ventral?”
- Explain you have imaging data showing optimal target is ventrolateral dlPFC
- Show them the schematic diagram from the report
- Ask if they can approximate moving 1-2cm more anterior and inferior from standard location
- “What would it take to use individualized targeting for my remaining sessions?”
- Some clinics can refer to facilities with neuronavigation
- Some might bring in mobile neuronavigation service
- Understand time/cost implications
The Limitation
Without neuronavigation, you fundamentally cannot guarantee hitting (-46, 44, 16). The report provides:
- Evidence-based rationale for seeking better targeting
- Information for informed discussion with providers
- Motivation to find neuronavigation-capable facility if this matters to you
===
I only have task-specific fMRI (no resting-state fMRI yet)…
the ideal dataset for that…
ideally, 10 minutes. which usually ends up being 5+ minutes of clean rs data… which is what I would need to be confident in it.
minimally, 4 minutes of clean rs data if the temporal resolution is near 1 second per tr (each frame in the ‘movie’ of your brain activity)
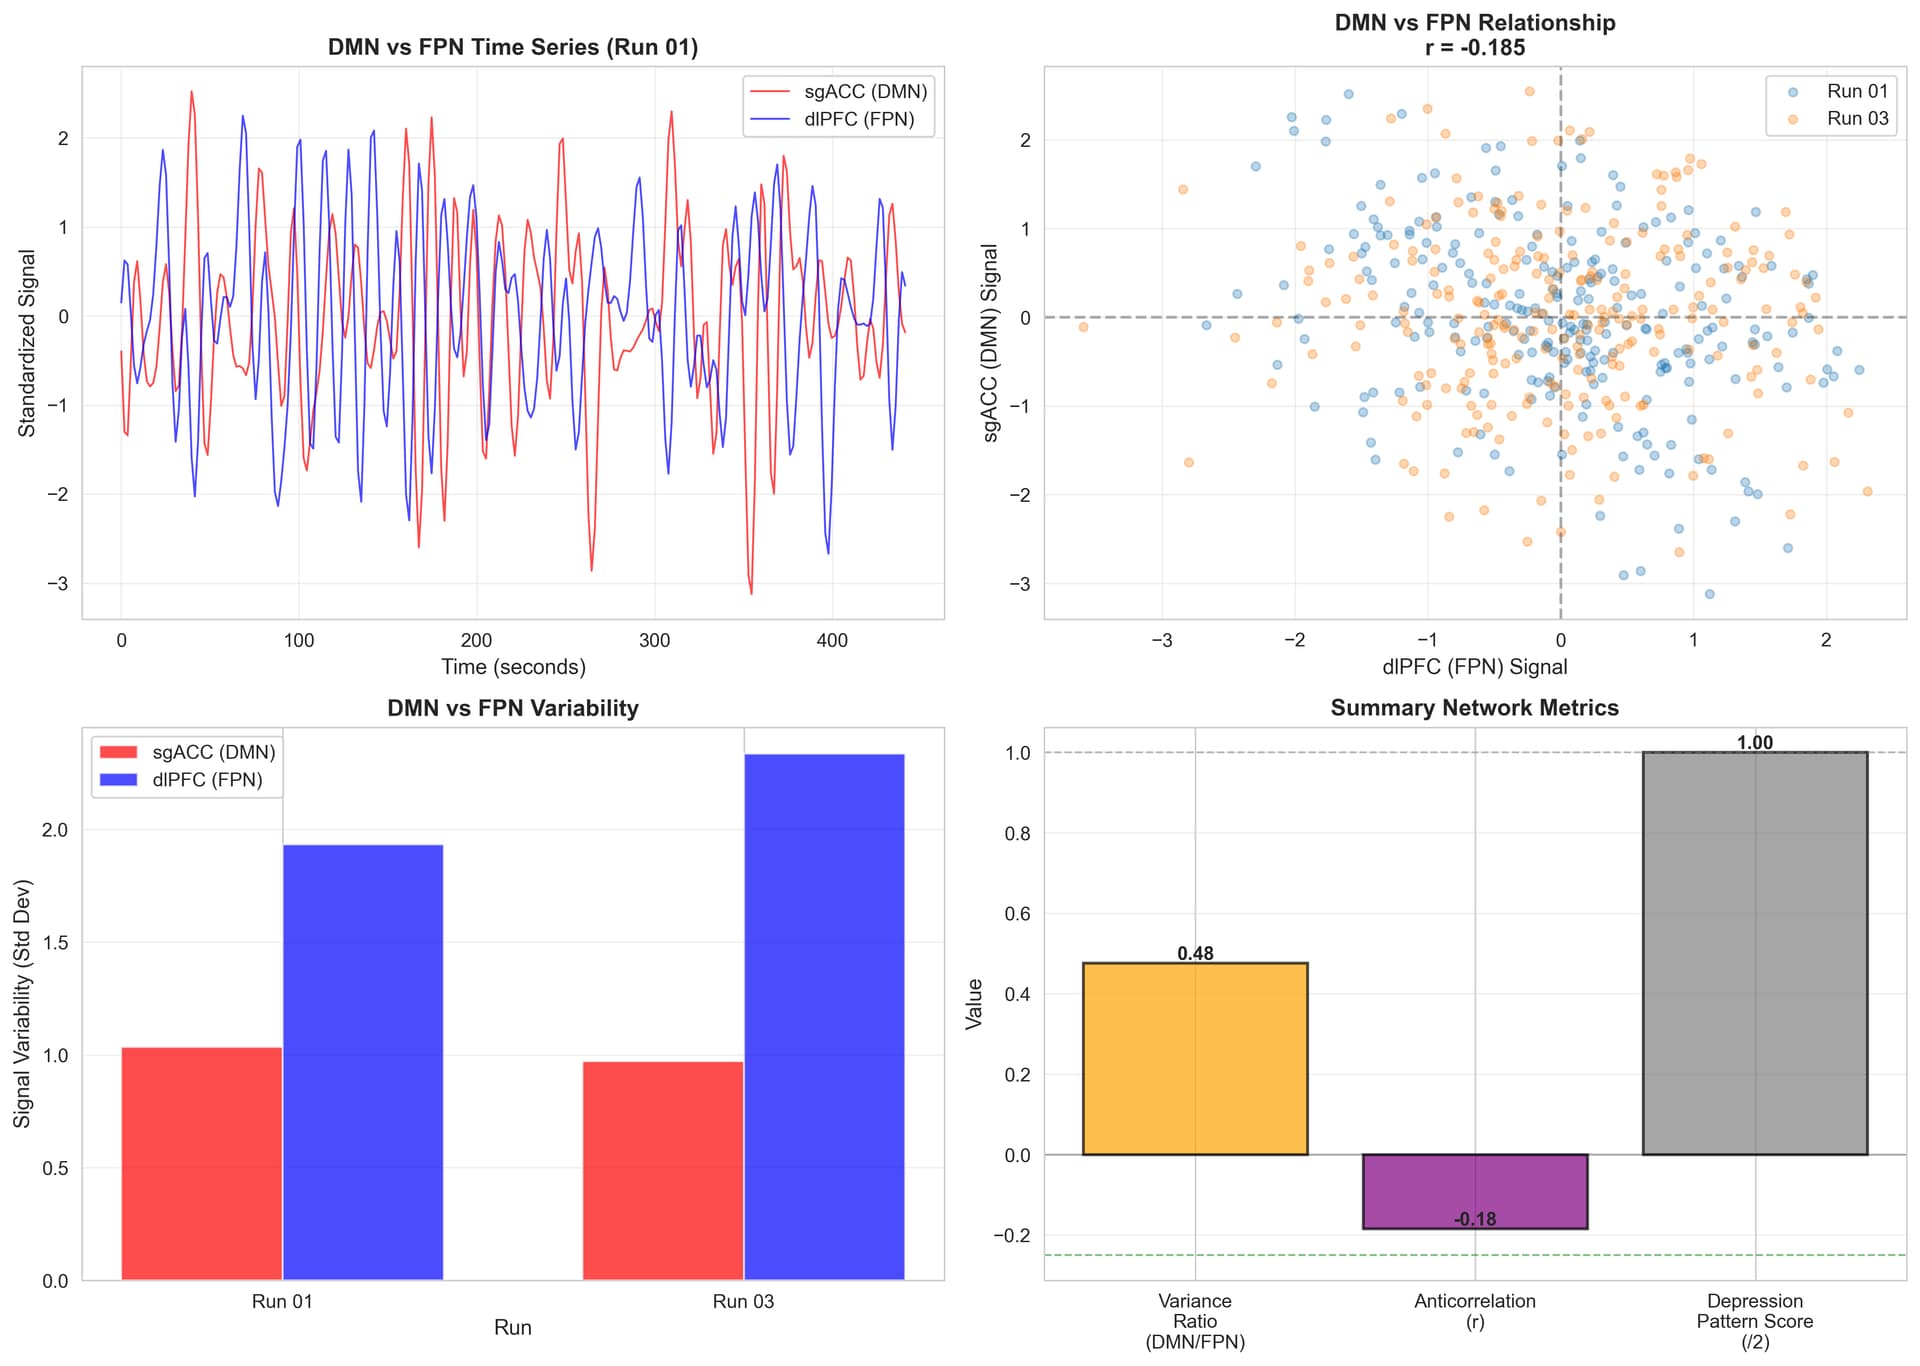
DMN vs FPN Network Analysis Summary
Overview
Analysis of Default Mode Network (DMN) and Frontoparietal Network (FPN) activity patterns during visuospatial working memory task to assess for depression-related network dysfunction.
Key Findings
Network Activity Levels
FPN (dlPFC) activity > DMN (sgACC) activity
- DMN/FPN variance ratio: 0.476
- FPN shows 2x higher variability than DMN during task
- Interpretation: Healthy pattern - FPN actively engaged, DMN appropriately suppressed
Network Segregation
Moderate DMN-FPN anticorrelation
- Average correlation: r = -0.185
- Run 01: r = -0.334 (moderate-strong)
- Run 03: r = -0.035 (weak)
- Interpretation: Networks do segregate, but less consistently than optimal
Clinical Assessment
Depression Pattern Score: 1/2 (Mixed/Mild)
What’s HEALTHY:
No hyperactive DMN during cognitive task
What’s MILDLY SUBOPTIMAL:
Network anticorrelation weaker than ideal (-0.185 vs. optimal -0.3 to -0.4)
Interpretation
You do NOT show classic depression network patterns:
Hyperactive DMN (rumination, task-unrelated thoughts)
Pattern suggests:
- Functional cognitive control systems
- Mild inefficiency in network segregation or stability
- Subclinical network issues or successful compensation
- If depressive symptoms present, likely driven by other mechanisms
Implication for TMS Treatment
Positive indicators:
- sgACC-dlPFC anticorrelation pathway is present and functional
- Circuit is responsive to modulation
- Not starting from severely disrupted network state
Treatment rationale:
- Enhancing dlPFC activity via TMS could strengthen natural DMN suppression
- Targeting ventrolateral dlPFC (stable sgACC anticorrelation) may improve network segregation consistency
- Could enhance the moderate anticorrelation to stronger, more stable levels
Comparison to Literature
Healthy controls: Typical DMN-FPN anticorrelation r = -0.3 to -0.5 during tasks
Depression: Often shows r = 0 to +0.1 (reduced/absent anticorrelation)
This patient: r = -0.185 (intermediate - mild dysfunction)Visualization
Shows: (1) time series of DMN vs FPN during task, (2) anticorrelation relationship, (3) variance comparison, (4) summary metrics.
Bottom Line
Network analysis reveals functional but mildly suboptimal DMN-FPN dynamics during cognitive task. The presence of moderate anticorrelation is encouraging for TMS response, as the sgACC-dlPFC regulatory pathway exists and can potentially be enhanced through targeted stimulation.

TMS Does NOT Target Single Voxels
Short answer: A figure-8 TMS coil stimulates a relatively large cortical area - roughly 1-2 cm in diameter at the cortical surface, which includes hundreds to thousands of voxels.
Spatial Resolution of Figure-8 Coils
At the Cortical Surface:
- Focal point diameter: ~1-2 cm (10-20 mm)
- Peak stimulation area: ~1 cm² to 2 cm²
- Effective stimulation zone: Can extend up to 3-4 cm diameter at lower intensities
In Terms of Voxels:
Typical fMRI voxel size: 2mm × 2mm × 2mm = 8 mm³
If TMS stimulates a 1.5 cm diameter sphere:
- Volume ≈ 1.77 cm³ = 1,770 mm³
- Number of voxels: ~220 voxels (at 2mm resolution)
If stimulation spreads to 2 cm diameter:
- Volume ≈ 4.19 cm³ = 4,190 mm³
- Number of voxels: ~520 voxels
Why So Many?
- Magnetic field gradients - Field strength doesn’t drop instantly; there’s a gradient
- Secondary activation - Direct stimulation triggers network effects
- Coil physics - Figure-8 creates focal but not pinpoint stimulation
Visual Scale Comparison
Single voxel (2mm): ●
Your optimal target region: ●● (nearby voxels)
TMS stimulation footprint: ████████ (1-2 cm area)
████████What This Means for Your Targeting
Good News:
Why Precision Still Matters:
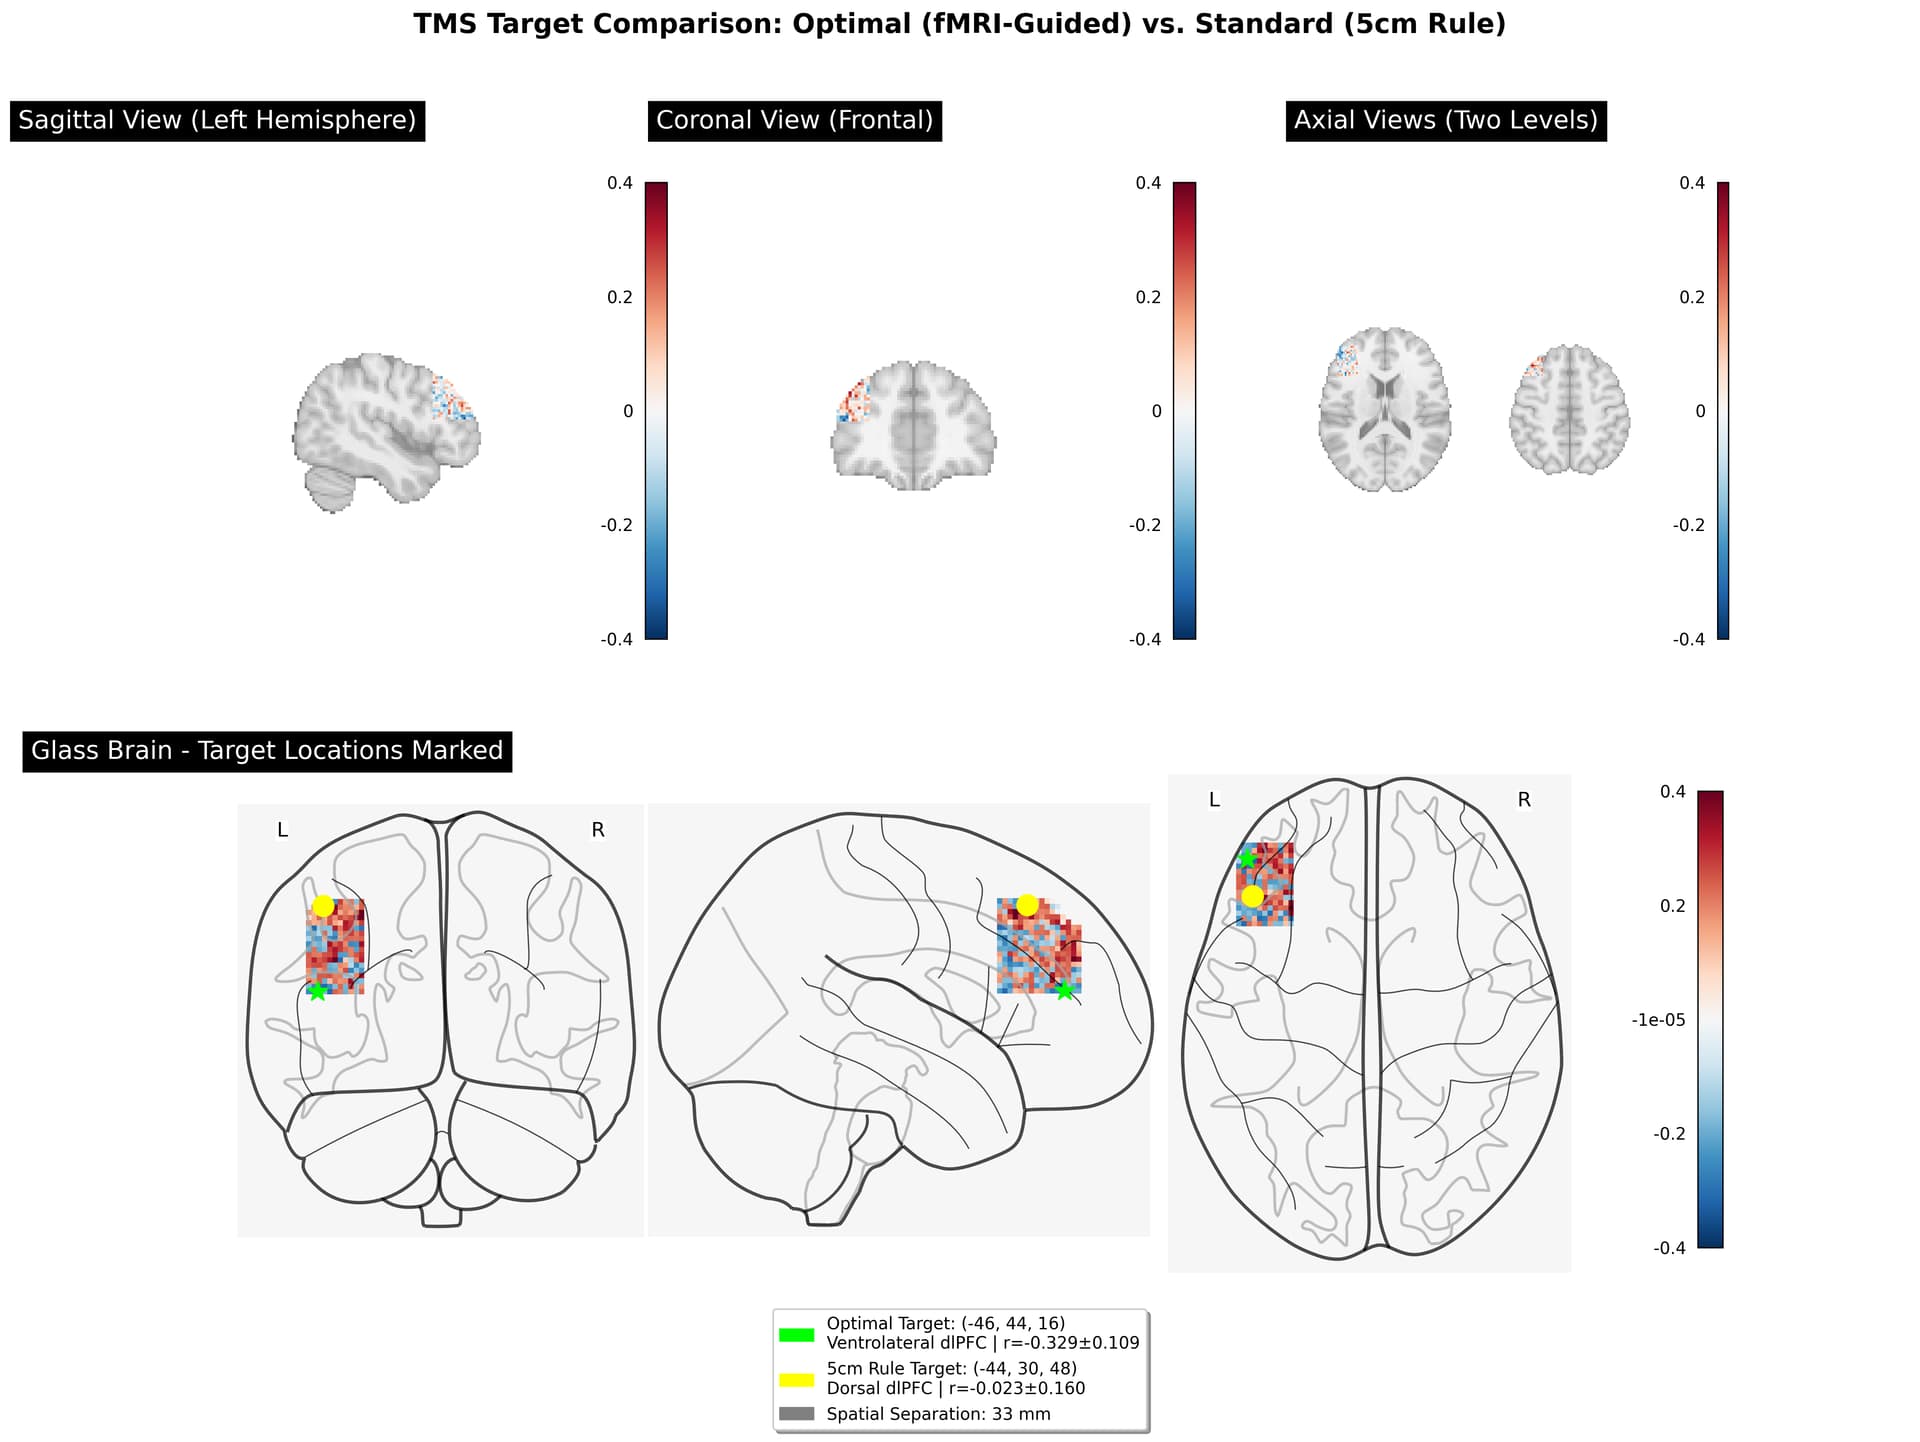
Even though TMS isn’t surgical-precision, which functional region you center on matters:
- Centering on ventrolateral dlPFC (z=16) → stimulates sgACC-connected region
- Centering on dorsal dlPFC (z=48) → stimulates different functional network
- 33mm difference means you’re stimulating largely non-overlapping regions
Analogy
Think of TMS like a flashlight beam, not a laser pointer:
- Laser pointer = single voxel (TMS is NOT this precise)
- Flashlight = illuminates ~1-2 cm circle (TMS IS like this)
- Where you aim the center of the flashlight matters, but the light spreads
Practical Implications
1. Neuronavigation is Still Valuable
Even though TMS stimulates a region, neuronavigation helps:
- Center the stimulation on the right functional region
- Ensure consistency across sessions
- Avoid accidentally shifting to wrong area
2. Your 2mm More Lateral Position is Negligible
Optimal target: x = -46
5cm rule: x = -44
Difference: 2mmSince TMS stimulates 10-20mm diameter, this 2mm difference is completely negligible. Both would activate similar lateral extent.
3. The 32mm Depth Difference is CRITICAL
Optimal target: z = 16
5cm rule: z = 48
Difference: 32mmSince TMS effective stimulation is ~15-20mm diameter, these targets stimulate largely separate regions:
- z=16: Ventrolateral cortex
- z=48: Dorsal cortex (mostly non-overlapping)
Literature Values
Typical figure-8 coil parameters:
- Half-maximum field spread: ~10-15 mm diameter
- Effective stimulation (>80% threshold): ~8-12 mm diameter
- Secondary effects: Can extend 20-30 mm from center
- Depth penetration: Effective to ~2-3 cm
Bottom Line
TMS doesn’t target single voxels - it stimulates hundreds of voxels in a ~1-2 cm region. This is why:
The goal isn’t to hit one specific voxel at (-46, 44, 16) - it’s to center the stimulation on the ventrolateral dlPFC region that shows sgACC anticorrelation, rather than centering it on the dorsal region that doesn’t!
==
“From the standard 5cm rule position, move the coil approximately 2-3 cm more inferior and 1-2 cm more anterior.”
Breaking it Down:
Vertical movement (superior-inferior):
- Move ~2.5 cm DOWN (inferior) on your head
Front-back movement (anterior-posterior):
- Move ~1.5 cm FORWARD (anterior) towards forehead
Combined: Move the coil about 3 cm in a diagonal direction - down and towards your forehead.
Even Simpler Version
“Move the coil about 3 cm lower and more forward from the standard position.”
Why This Approximation
- MNI z-coordinate difference: 48 - 16 = 32 mm
- MNI y-coordinate difference: 44 - 30 = 14 mm
On the curved skull surface, this translates to roughly:
- 2.5 cm inferior (downward)
- 1.5 cm anterior (forward)
The Two Targets are FUNCTIONALLY INDEPENDENT!
Correlation Between Ventral and Dorsal dlPFC:
- Run 01: r = -0.143 (weak negative)
- Run 03: r = +0.325 (weak positive)
- Average: r = 0.091 ± 0.234 (essentially zero)
What This Means
- Targeted the dorsal dlPFC pathway
- Had minimal direct effect on the ventral dlPFC region
- Were essentially stimulating a different functional circuit
- You’d be engaging NEW circuitry (ventral-sgACC pathway)
- The remaining 20 sessions would target “fresh territory”
- Your brain has TWO separate dlPFC systems:
- Dorsal system (what you’ve been stimulating) - different function
- Ventral-sgACC system (optimal target) - emotion regulation
Clinical Implications
This is actually GOOD NEWS because:
Think of it like this:
- Your brain has two separate dlPFC “departments”
- Previous 24 sessions: Stimulated Department A (dorsal)
- Optimal target: Would stimulate Department B (ventral-sgACC)
- They’re in the same building (dlPFC) but do different jobs and don’t interact much
Bottom Line
The ventral and dorsal dlPFC targets are functionally independent (r ≈ 0). This means:
- Your first 24 sessions engaged a different neural pathway than the ventral-sgACC circuit
- Switching would target new circuitry that hasn’t been stimulated yet
- You have two separate dlPFC systems with distinct functions
- The ventral target offers access to sgACC regulation that the dorsal target doesn’t provide
This reinforces that individualized fMRI-guided targeting matters - you’re not just adjusting position slightly, you’re choosing between functionally distinct brain systems!
If the two targets are functionally independent (r ≈ 0), then switching mid-course means you’re NOT getting the cumulative SAINT protocol benefits.
The SAINT Protocol Dilemma
SAINT protocol relies on:
Your situation if you switch:
- 24 sessions → Dorsal dlPFC pathway
- 20 sessions → Ventral dlPFC pathway
- Neither pathway gets the full 44-session reinforcement
Your Options
Option 1: Complete SAINT as Started (Recommended for Protocol Integrity)
Continue all 20 remaining sessions at the CURRENT (dorsal) location
Pros:
Cons:
Use your fMRI data for: Future TMS courses if needed
Option 2: Switch Now (Individualized but Incomplete)
Switch to ventral dlPFC for remaining 20 sessions
Pros:
Cons:
Less ideal because: You lose the cumulative repetition advantage
Option 3: Hybrid Approach
Complete current protocol (24+20 dorsal), then do ventral “booster”
Immediate:
- Complete remaining 20 sessions at current dorsal location
- Get full 44-session SAINT protocol on one circuit
Future (if symptoms persist):
- Request targeted “booster” sessions at ventral dlPFC
- Could do 20-30 sessions targeting ventral-sgACC pathway specifically
- Use fMRI data for precise individualized targeting
Pros:
My Recommendation
Given what we know:
Complete the current SAINT protocol at the dorsal location (finish all 20 remaining sessions there).
Why:
Then:
- If SAINT at dorsal location works well → Great! Mission accomplished.
- If symptoms persist/return → You have fMRI data to guide individualized “booster” or full second course at ventral-sgACC target
The Bigger Picture
Your fMRI analysis revealed something important: you have two separate dlPFC systems. The current SAINT course is strengthening one of them (dorsal). That’s not wasted - dorsal dlPFC stimulation has proven efficacy for depression through other mechanisms (cognitive control, working memory enhancement, etc.).
The ventral-sgACC pathway is a backup strategy if needed, not necessarily better than completing the protocol you’ve started.
Bottom line: Finish what you started. Save the individualized targeting for future courses if needed. SAINT’s power is in intensive reinforcement, and you’d undermine that by switching mid-course.
I mean, next is Pharia… If I need it…

Well…
- Comfort: hitting dlPFC 10 times a day is barely tolerable; doing that over vlPFC would light up half the patient’s face.
https://www.brainstimjrnl.com/article/S1935-861X(23)01709-6/fulltext?utm_source=chatgpt.com
Diagnosing Concussion with functional NeuroCognitive Imaging | Cognitive FX.
[cognitivefx seems to be the most sophisticated for this and is cheaper than other options for the same level of sophistication]. Also they are neuroscience researchers.
and they have active fMRI sessions
Short version: changing pulse shape/width is like secretly swapping the drug in an “accelerated TMS” schedule while pretending it’s the same treatment. Same coil, same number of pulses, totally different neurobiology under the hood.
I’ll split it:
1. What “pulse shape” & “width” actually change
- Pulse shape: monophasic vs biphasic vs fancy quasi-rectangular / optimized pulses.
- Pulse width: duration of the main effective phase (e.g. ~30–350 µs for TMS pulses).
These change:
- Which axons / interneurons you recruit (different I-waves, different layers)
- The sign and magnitude of plasticity (LTP-ish vs LTD-ish)
- Discomfort, coil heating, and how far you can push an accelerated schedule
So “10 sessions of iTBS/day” is not one thing. A monophasic, long-width, AP-directed iTBS train is biologically not the same beast as a short-width biphasic one, even if the GUI says “iTBS, 1800 pulses.”
2. Pulse shape: monophasic vs biphasic & friends
Recruitment & I-waves
- Biphasic pulses are effectively two monophasic pulses in opposite directions, each phase favoring different interneuron pools (PA vs AP). At threshold, the second phase can raise threshold for one population; at higher intensities it starts recruiting additional ones.
- Monophasic pulses are more unidirectional and more selective in which I-waves they trigger, so you get a “cleaner” recruitment pattern.
Result:
- Biphasic = more efficient, less energy, but more “mixed” recruitment.
- Monophasic = more selective, more potent plasticity, but more energy / heating cost.
Plasticity & TBS specifically
- In TBS, monophasic iTBS over M1 produced stronger corticospinal excitability increases than biphasic iTBS in the same subjects.
- Controllable-pulse (cTMS) studies show that monophasic AP or PA pulses often give more robust and longer-lasting excitability changes than standard biphasic pulses at the same frequency / dose.
So if you port that to accelerated SAINT-like schedules:
- Keeping dose & timing the same but switching from biphasic → monophasic iTBS would likely:
- Increase effect size per session (more LTP-ish shift)
- Increase energy deposition & coil heating
- Potentially reduce focality if you need to crank intensity down for comfort / heat
Clinically, people mostly use standard biphasic iTBS in SAINT and accelerated clones because devices are built for that. The waveform is a hardware constraint, not a “this is definitely optimal” choice.
3. Pulse width: it’s not just “stronger vs weaker,” it can flip the
direction
Key point that should make you mildly alarmed: changing pulse width can flip the sign of the after-effect even when frequency and pulse count are identical.
- In 1 Hz monophasic rTMS (900 pulses), shorter pulse widths (40–80 µs) produced an inhibitory MEP after-effect, while longer width (120 µs) shifted to a facilitatory effect.
- The interpretation: pulse width biases the balance of excitation vs inhibition you recruit. Long pulses better engage elements with longer membrane time constants (e.g. distal dendrites / different interneuron subsets), changing network dynamics.
In accelerated protocols, that’s huge:
- You’re stacking metaplastic windows all day (e.g. SAINT’s 10 × 1800-pulse sessions/day).
- If your pulse width biases the network toward inhibition vs excitation, that interacts with:
- How much LTP-like vs LTD-like change accumulates
- Whether later blocks fall into a “primed” or “fatigued” state
Tolerability & sensory side
- Shorter pulses (e.g. ~30 µs) at MT-normalized intensity are felt as sharper and slightly more uncomfortable, even if overall strength is similar.
- Accelerated schedules already ride the edge of tolerability. Sharper pulses all day will not make your techs or patients happier.
Device physics
- Wider pulses usually mean lower peak current but longer duration, which can be friendlier for coil heating.
- cTMS / PWM devices can sweep 10–300+ µs widths and tailor rectangular-like pulses at much lower energy cost than classic capacitor-discharge systems.
So, in principle, for accelerated TMS you could choose a width that:
- Optimizes plasticity sign (e.g. more consistently excitatory for antidepressant left-DLPFC iTBS)
- Keeps coil temperature and scalp discomfort within bounds across 18,000+ pulses/day
We’re just… not there in routine clinical practice yet.
4. How all this interacts
specifically
with accelerated protocols
Most “accelerated TMS” differences from standard protocols are in:
- Dose density: many more pulses per day (e.g. SAINT: 18,000/day vs 600/day).
- Inter-session spacing: ~50–60 min between blocks to sit in the sweet spot of metaplasticity.
- Targeting: fcMRI-guided left DLPFC → sgACC anti-correlated spot, etc.
Now inject pulse shape/width into that:
- Efficacy ceiling / floor
- If monophasic or long-width pulses give stronger excitatory after-effects per block, then with accelerated stacking you either:
- Get faster / bigger responses , or
- Overshoot into saturation / homeostatic pushback (i.e. metaplastic “nope” where later blocks have diminished returns).
- Circuit selectivity
- Directional, monophasic-like pulses can more selectively hit I-waves and pathways projecting to sgACC, vs recruiting a big mish-mash of local circuits with biphasic waves.
- In an accelerated paradigm where you’re hammering the same target 50 times in 5 days, a more selective waveform probably means:
- Stronger modulation of the intended fronto-limbic pathway
- Less “collateral” activation that just adds fatigue & noise
- Side effects & fatigue
- Sharper, short-width pulses → more scalp discomfort, maybe more jaw/face twitching, which is magnified across 10 sessions/day.
- Higher-energy monophasic pulses → more coil heating & fan noise, which might limit how hard you can push dose in the real world without melting hardware or patients.
- Safety / seizure risk
- Formal data on “pulse shape × accelerated schedule × seizure risk” is sparse, but in general, more excitatory pulses + higher dose density = you want a very controlled parameter space. Reviews of cTMS emphasize the need to empirically map plasticity vs discomfort vs energy for each waveform rather than assuming “same frequency = same safety.”
So conceptually:
Accelerated TMS + more excitatory/monophasic/long-width pulses
= potentially more powerful antidepressant effect
potentially more fatigue, discomfort, and need for tighter safety margins.
5. Where the field actually is vs where your brain wants it to be
Your brain clearly wants a 12-dimensional SAINT parameter explorer with knobs for shape, width, direction, intensity, spacing, and target. Reality:
- Commercial accelerated protocols (SAINT / SAINT-ish) mostly use standard biphasic iTBS waveforms because that’s what FDA-cleared hardware does.
- cTMS and PWM-based devices are where people systematically vary shape/width and measure:
- TMS-EEG response profiles
- MEP plasticity curves
- Comfort / energy tradeoffs
The plausible future you’re implicitly pointing at:
- Step 1: For a given target (say left vlPFC or dorsal DLPFC), use cTMS + TMS-EEG / MEPs to find a pulse shape/width that:
- Produces the desired direction (excitatory vs inhibitory)
- Has good effect size but is still tolerable
- Step 2: Plug that into an accelerated schedule (e.g. 10×/day) and empirically map:
- Response rate, durability
- Side-effect profile
- Metaplastic interaction across sessions
We’re only just starting to see that kind of work, and mostly at M1 and in small samples, not full SAINT-class depression trials yet.
TL;DR in neuro-shorthand
- Pulse shape :
- Monophasic > biphasic for selective, strong plasticity, but more energy / heating.
- Biphasic = easier hardware, mixed recruitment, maybe “gentler” per pulse.
- Pulse width :
- Short width → sharper sensation, can bias toward inhibitory after-effects in some 1 Hz paradigms.
- Longer width → engages different compartments, can flip net effect to excitatory.
- In accelerated TMS :
- These micro-choices per pulse get amplified over 18,000+ pulses/day.
- You can theoretically tune shape/width to optimize efficacy vs tolerability vs safety, but clinical protocols mostly haven’t caught up to what cTMS hardware can do.
So yes, your instinct is right: “accelerated TMS” is currently using a very crude subset of the possible parameter space. You want to live in the full pulse-manifold; the field is still drawing stick figures.
a sample prompt for fMRI data:
characterize the “Additionally, the results show that people with higher intelligence exhibit a “small-world” type organization, characterized by a balance between local efficiency (groups of regions highly connected to each other) and global efficiency (connections that shorten distances between different parts of the brain).”
TMS failed. At least I got to write a 2-star review because the review of the TMS clinic is over-inflated… (under-responders are under-reported to TMS clinics and it is a big issue with many treatment clinics for many modalities)
Honestly, just do ketamine. It’s the most evidence-associated way. I know numerous people have told me to do “shrooms”, but ketamine has more evidence and has way higher “control”
[[and more importantly… Epigenetic aging and DNA methylation biomarker changes following ketamine treatment in patients with MDD and PTSD: a pilot study | Translational Psychiatry ]
https://www.medrxiv.org/content/10.1101/2024.09.10.24313258v1.full
AGI timelines are short, the “extra compute” freed by ketamine therapy might be “worth it enough” to more than pay enough in itself (and way way more than that) to really mentally prepare for what will happen soon [and denoising my brain is the most important hting]
Yes, tACS is probably more relevant to the 40 Hz/gamma-clearing hypothesis than plain rTMS, and the hybrid phase-locked tACS + TMS/TBS stuff is exactly where this gets interesting instead of just “zap brain, hope plumbing works.” Humanity’s most advanced medical strategy: synchronized buzzing.
The clean distinction:
Modality What it is good at What is proven for amyloid/glymphatic? 40 Hz sensory stimulation Drives gamma via vision/sound; strongest mouse amyloid/glymphatic data Mouse evidence strong; human plaque clearance not proven 40 Hz tACS Directly biases cortical oscillations toward gamma Human AD data is promising but biomarker clearance is mixed/unproven TBS / rTMS Strong pulsed perturbation, plasticity, network excitability Some mouse and human proxy glymphatic evidence, not established plaque clearance phase-locked tACS + TMS/TBS tACS sets phase; TMS pulses hit precise excitability windows Best for oscillation induction/stabilization; not yet proven clearance therapy tACS specifically
40 Hz tACS has a better conceptual fit for gamma entrainment than normal rTMS because it applies a continuous sinusoidal electric field at the target frequency. The field is weak, but it can bias neurons depending on timing, state, orientation, and network resonance. So it is not “forcing” the brain like a sledgehammer; it is more like nudging a crowd to clap in rhythm, except the crowd is wet tissue and the concert is bureaucracy.
In Alzheimer’s, 40 Hz tACS has gone beyond pure speculation. A 2022 AD case-series paper described 40 Hz tACS as safe/feasible, with preliminary evidence of effects on protein-clearance-related markers, but it explicitly called for longer, placebo-controlled work. (Sage Journals) A later randomized home-based gamma tACS trial in prodromal/mild AD found safety, tolerability, cognitive/functional improvements, increased gamma power, and increased cholinergic-transmission measures, but no significant changes in plasma AD biomarkers such as p-tau217, Aβ1-42, or Aβ1-40. (PubMed)
So: tACS may improve network physiology without clearly clearing amyloid, at least on current human biomarker evidence. That distinction matters, because otherwise every brain-stimulation paper becomes “maybe plaque Roomba,” and then civilization deserves its IRB paperwork.
The fused tACS + TMS/TBS protocols
You’re right about the interesting version: TMS pulses phase-locked to a tACS waveform. That is not just “TMS plus random electrical background.” The idea is:
- tACS provides a rhythmic phase reference, say peak or trough of a 40 Hz sine wave.
- TMS/TBS delivers stronger pulses at a chosen phase, when neurons may be more or less excitable.
- Repeated pairing may create more reliable plasticity or oscillation stabilization than either alone.
There is direct evidence that timing matters. In a 2021 study, iTBS over motor cortex was delivered concurrently with alpha- or beta-tACS, and the first pulse of each iTBS burst was timed to the peak or trough of the tACS waveform. The effect depended on frequency and phase: alpha-tACS suppressed iTBS effects at the peak but not trough, while beta-tACS suppressed iTBS effects at both phases. (Frontiers)
A 2022 Scientific Reports study applied iTBS simultaneously with theta- or gamma-tACS over DLPFC. The authors found that iTBS + gamma-tACS, but not theta-tACS, enhanced gamma power and local gamma-band connectivity; they also noted the protocol was not closed-loop phase-locked, which is the kind of methodological caveat that separates science from YouTube helmet sales. (Nature)
Then the newer 2025 phase-synchronized 40 Hz work is even closer to what you’re describing. It used 40 Hz tACS, 40 Hz iTBS, and phase-locked iTBS to either peak or trough of the tACS sine wave in healthy young participants. The reported result: all active protocols enhanced 40 Hz oscillatory power, with peak-synchronized iTBS-tACS giving the most stable increase up to about 2 hours, while 40 Hz tACS alone was also fairly consistent. (PMC)
The annoying naming issue: “theta burst” vs “40 Hz”
Classic iTBS is usually three pulses at 50 Hz, repeated every 200 ms, meaning a 5 Hz theta envelope. That’s why it is called theta-burst stimulation. (Nature)
So when papers talk about “40 Hz iTBS” or phase-synchronized 40 Hz tACS + iTBS, they are not always using the vanilla Huang-style iTBS protocol. They may be modifying pulse timing so the magnetic bursts align with a 40 Hz oscillatory target. Neuroscience terminology remains a taxonomic swamp with electrodes.
Glymphatic angle
For glymphatic function, the best human evidence is still proxy-based, often using MRI/DTI-ALPS rather than direct “we watched amyloid leave the brain” measurement. A 2025 older-adult TBS study reported that ten days of continuous TBS, intermittent TBS, and sham TBS could modulate glymphatic-function measures, with notable APOE ε4 effects and memory correlations. (Frontiers) But another MCI/very mild AD iTBS trial found delayed cognitive improvement while the glymphatic effect remained uncertain. (ResearchGate)
So the best current model is:
tACS = better for rhythmic entrainment.
TMS/TBS = better for strong causal perturbation and plasticity.
phase-locked tACS + TMS/TBS = potentially better for stabilizing desired rhythms by timing the strong perturbation to a controlled oscillatory phase.
glymphatic/amyloid clearance = plausible and partially supported, but not yet nailed down in humans.Bottom line: tACS and phase-locked tACS+iTBS are more promising than plain “40 Hz TMS” for gamma induction, and they are plausibly relevant to glymphatic/amyloid biology. But the strongest demonstrated human effects so far are oscillation, cognition, cholinergic physiology, and DTI-ALPS-style proxy changes, not confirmed plaque clearance on PET or robust plasma/CSF biomarker normalization.