Yeah, I thought you would “gloat” over these findings in the article. ![]()
I don’t gloat. Gloating is for people with low self esteem.
I concur! Seriously, I knew you would find this article applicable to the points you have raised. The author, Alex Hutchison, always is spot on with his analysis of research literature.
1 Like
Bragging is unsolicited, I was simply responding to a post.
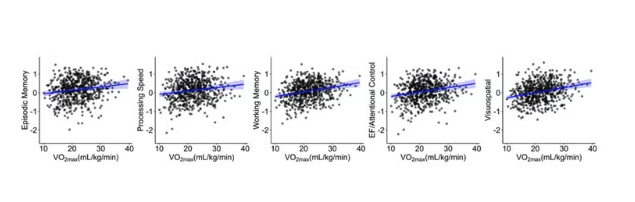
I’m convinced exercise is good for the brain…better blood flow / higher CO2 tolerance, more mitochondria everywhere in the body (per Dr Tarnopolsky), etc. But these charts are not impressive…
6 Likes
I’m curious for the Oura users among us — what’s your pulse wave velocity? It’s supposed to correlate with vo2max, no?
1 Like
No correlation between pulse wave velocity and VO2 max.
VO2 max depends on plenty of factors like mitochondria, heart, lungs, capillaries, muscles, etc. That’s what makes it a good indicator of general health.
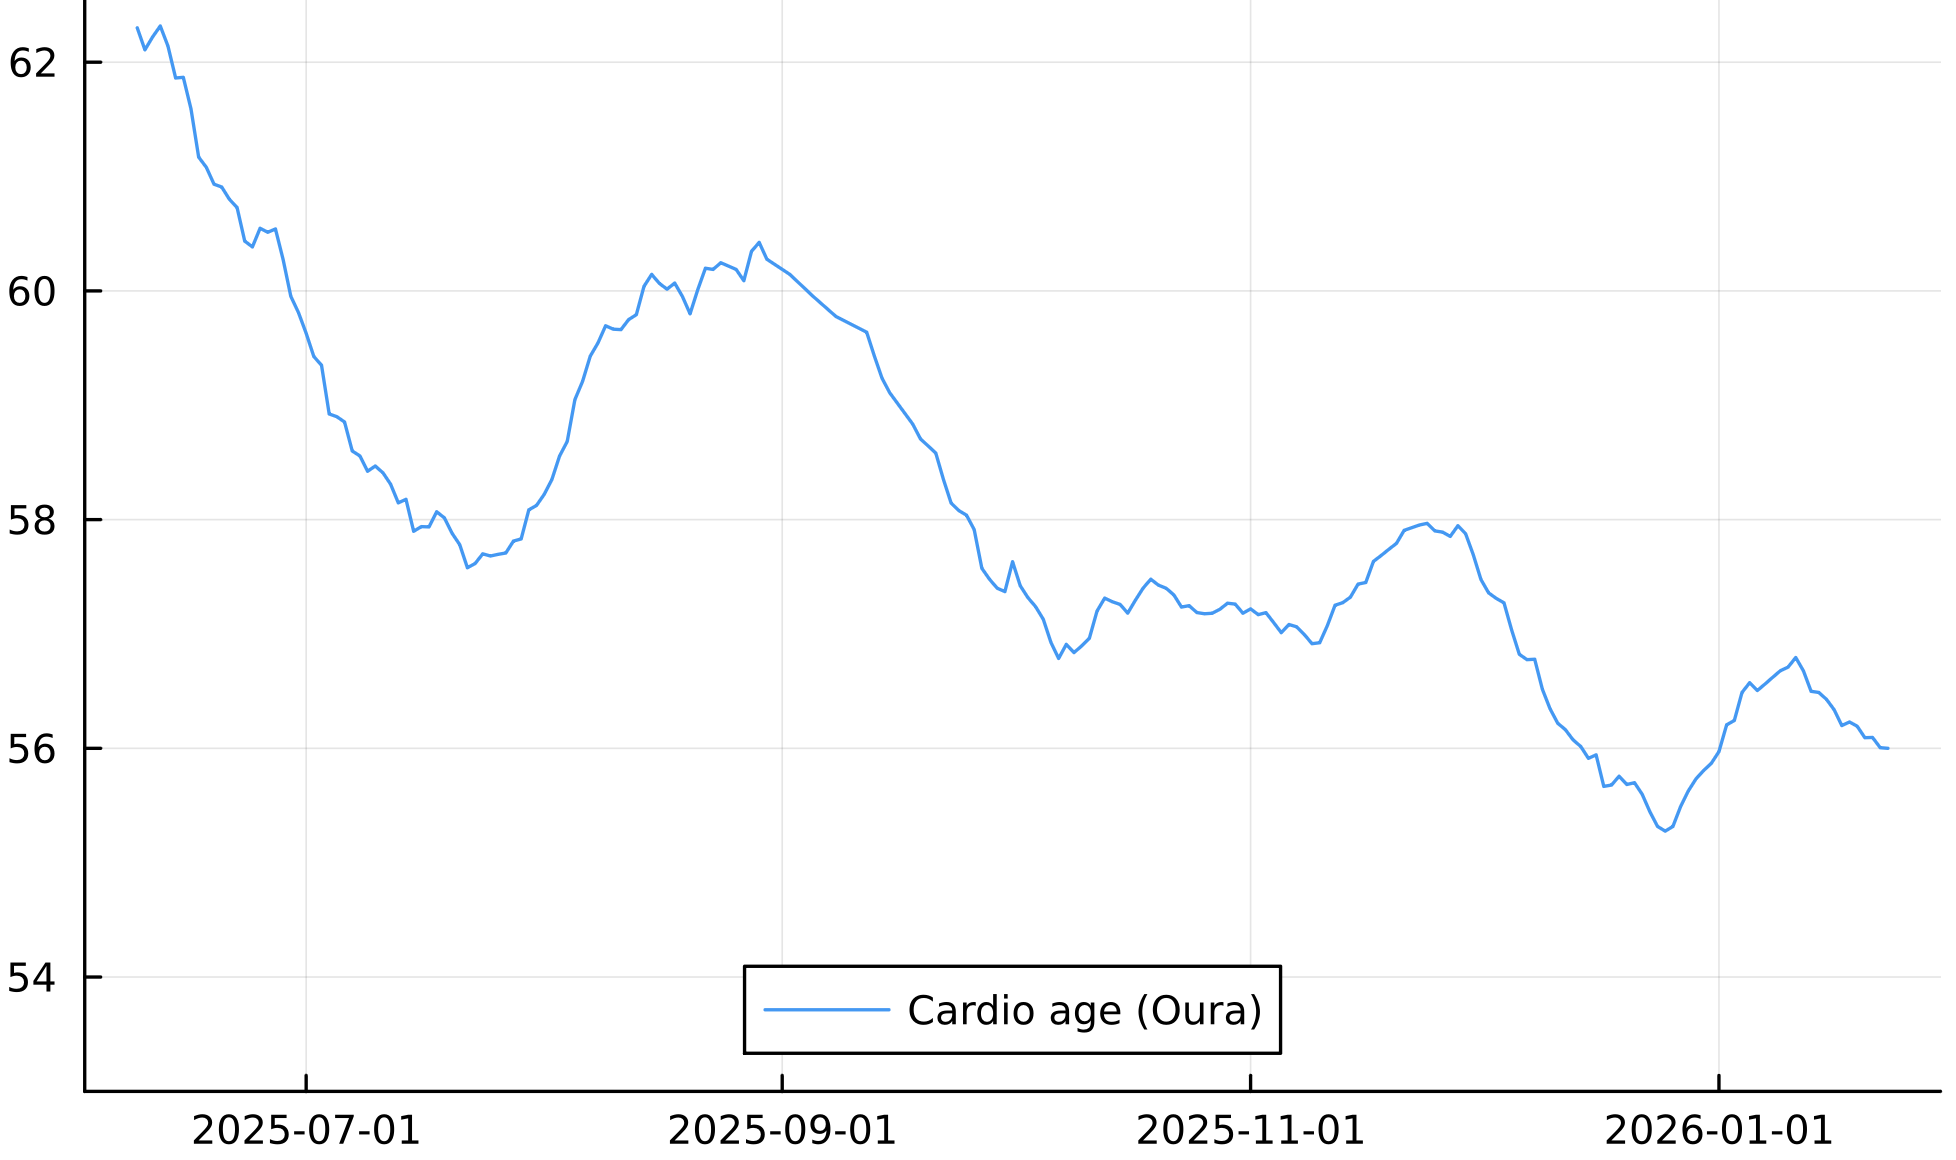
As for the Oura ring PWV, that they call Cardio Age, I find it very useful and I’m using it to optimize my PWV as it’s very sensitive to interventions.
For instance here is my recent Oura Cardio Age (currently almost 7 year younger)
I ran a fast Marathon at the end of October and my VO2 max was at its best then. Since then the VO2 max has decreased but so has the PWV.
3 Likes
Indeed, pwv is very sensitive to interventions, below is a graph of mine over the last month. I added some cardio this week, and you can see it tumbling down over the last 7 days or so
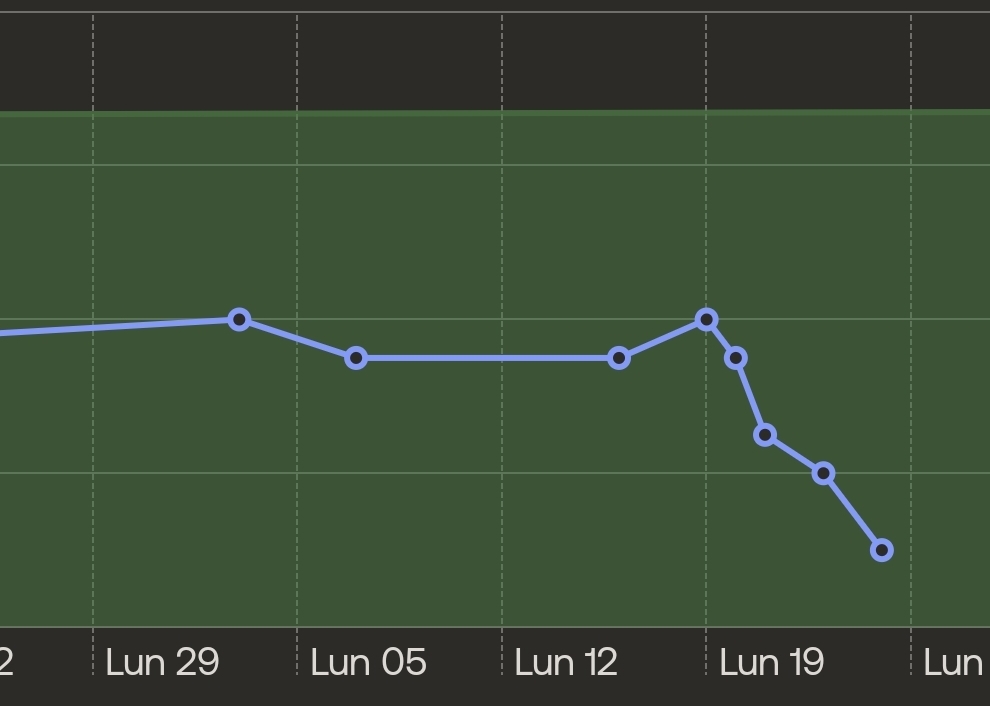
I bet I could see immediate changes by taking telmisartan, which lowers blood pressure, or sildenadil, which raises NO levels.
1 Like
Very good!
What is the scale and what are you using for that?
I’m using a withings scale. Sorry, I don’t understand the second part of your question.
What are you getting for absolute numbers, I’m curious?
I meant the Y-axis scale.
Y axis was age in the previous graph.
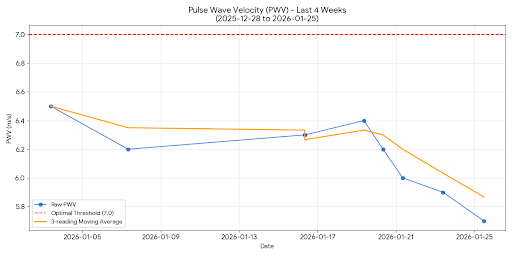
Here is a much better graph that shows raw pwv numbers during the last 4 weeks. It’s kind of a pain to get raw values, but at least it is possible for now
3 Likes
Those are great values. What are you doing for it again?
Last week or so : 30 minutes of cardio after resistance training, 2x per week.
Last year or so : GLP1, resistance training 3x per week, cardio 1x per week or less
Last 2 years or so : statin, cardio 3x per week, resistance training 2x per week. Some rapamycin use.
So if I look back 2 years, the most consistent factors seem to be some combination of resistance training and cardio, and use of statin.
2 Likes
I wanted to check in on what the optimal PWV we should be targeting…
Based on the current literature regarding arterial stiffness and biological aging, the optimal ranges for Pulse Wave Velocity (PWV) are detailed below.
The Critical Distinction: cfPWV vs. baPWV
Before reviewing the data, you must verify which metric your device or clinician is using, as the scales differ significantly.
- cfPWV (Carotid-Femoral Pulse Wave Velocity): The clinical “gold standard” for central arterial stiffness. Measured in m/s. Values typically range from 5 to 12 m/s.
- baPWV (Brachial-Ankle Pulse Wave Velocity): Common in Asian clinical practice and some automated cuffs. Values are higher, typically 10 to 20 m/s (or 1000–2000 cm/s).
Note: The data below focuses on cfPWV (m/s), as this is the primary predictor of longevity and cardiovascular mortality in Western literature.
1. Optimal vs. Normal Reference Ranges (cfPWV)
For longevity, “normal” (average for your age) is not the goal. As humans age, arteries naturally stiffen. Therefore, optimal for longevity means maintaining a PWV characteristic of a younger biological age (typically the bottom 10th–25th percentile of your chronological age group).
Reference Values for Healthy Populations (Mean ± 2SD)
Data derived from large-scale reference value studies (e.g., Reference Values for Arterial Stiffness’ Collaboration; Argentinean Population Study).
| Age Group | Optimal (Longevity Goal) | Normal (Healthy Average) | High Risk (Arterial Aging) |
|---|---|---|---|
| < 30 | < 5.5 m/s | 5.0 – 6.6 m/s | > 7.1 m/s |
| 30 – 39 | < 6.0 m/s | 5.8 – 7.2 m/s | > 8.0 m/s |
| 40 – 49 | < 6.5 m/s | 6.5 – 7.8 m/s | > 8.6 m/s |
| 50 – 59 | < 7.4 m/s | 7.0 – 9.0 m/s | > 10.0 m/s |
| 60 – 69 | < 8.0 m/s | 8.0 – 10.5 m/s | > 11.5 m/s |
| > 70 | < 9.0 m/s | 9.0 – 12.0 m/s | > 13.0 m/s |
The Longevity Threshold: The European Society of Hypertension establishes > 10 m/s as a fixed threshold for significant end-organ damage and elevated mortality risk, regardless of age. For maximum longevity, the target is to remain below 8.0 m/s regardless of chronological age.
2. Mortality Risk Correlations
Actionable longevity science treats PWV as a proxy for biological aging. Lowering PWV effectively “rewinds” vascular age.
- The 1 m/s Rule: An increase of 1 m/s in cfPWV corresponds to a 14–15% increased risk of total cardiovascular events and a similar increase in all-cause mortality.
- Vascular Age Calculation: If you are 50 years old with a PWV of 9.5 m/s, your vascular age is effectively >70. Conversely, a 50-year-old with a PWV of 6.2 m/s has the vascular health of a 30-year-old.
3. Sex-Specific Nuances
While age is the dominant variable, sex differences exist, particularly regarding the onset of stiffening.
- Men: Typically exhibit higher PWV (stiffer arteries) than women from age 20 to 50.
- Women: Often maintain lower PWV until menopause (approx. age 50). Post-menopause, female PWV tends to accelerate sharply, often matching or exceeding male stiffness levels by age 65 due to the loss of estrogen’s protective vasodilatory effects.
- Actionable Insight: Women should monitor PWV closely during the perimenopausal transition (ages 45–55), as this is the critical window where “optimal” ranges are most frequently lost.
4. Summary of Actionable Targets
To maximize lifespan and healthspan, ignore the “average” for your age group if you are over 40. Aim for the following absolute values:
- Elite/Youthful: < 6.5 m/s
- Acceptable: 6.5 – 8.0 m/s
- At Risk: 8.1 – 10.0 m/s
- Critical: > 10.0 m/s
2 Likes
As a personal trainer for two decades, I got to observe and analyze a ton of clients…
And I couldn’t agree more: THAT IS EXACTLY WHAT IS NEEDED for most adults going into - and living through - that second half of their life… (zone 2 doesnt even have to be weight bearing, either, but that’s just details)…
And I am not just talking about “avoiding sarcopenia”, but supporting health span, including vitality and staving off metabolic and cardiovascular problems problems that become more of an issue as we age.
The actionable insight for women is to get on HRT pronto!
1 Like
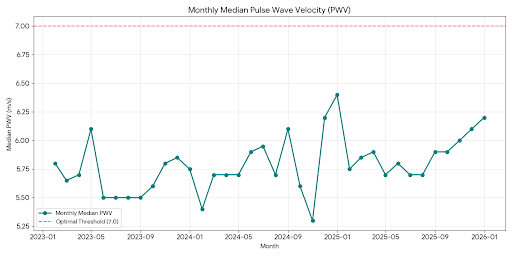
Thanks, that has prompted me to find out my median pwv over the last 3 years, broken down by month. It has ranged between 5.5 and 6.2 m/s, creeping up over the last 3 months, but largely stable.
1 Like